Upgrade to Pro — share decks privately, control downloads, hide ads and more …

Building Handsome Dashboards with Dashing

Building Handsome Dashboards with Dashing

What are the benefits of a team dashboard? Is it easy to setup a dashboard and pull in key metrics using existing API’s from your Rails applications?

Join us while we demonstrate just how easy it is to create and deploy your own dashboards. You will take away a strong understanding of how to identify key metrics for your project, aggregate the data, and share it with your team.

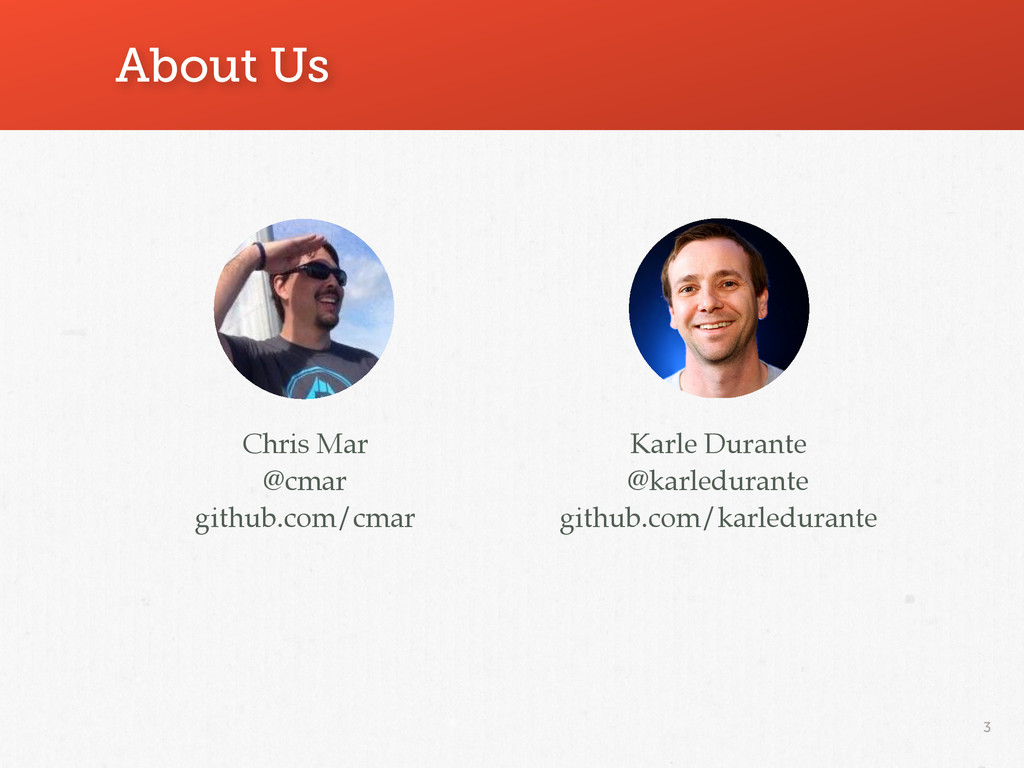
Karle Durante and Chris Mar talk from RubyNation 2014

Chris Mar

June 07, 2014
Tweet

More Decks by Chris Mar

Other Decks in Technology

Transcript

  1. Case Study: Booster • 1 room, 1 team, 1 focus

    • Iterative development cycles: Test, Measure, Learn • Everyone on the “front lines” 10
  2. Case Study: Booster 14 Nov 2012 Group buying exploration Jan

    2013 Launched First Campaign Apr 2013 All Hands ! On Deck Aug 2013 Official Booster Launch! Nov 2013 Operational ! Efficiency Jan 2014 25% of all! CustomInk Traffic!
  3. What Data? • What are the average shirt sales per

    campaign? • How many buyers become organizers? • How many campaigns succeed? • How many submissions do not convert? 17
  4. Key Performance Indicators • Choose indicators that are directly relevant

    to your business • Measure indicators in a way that makes sense for your business • Keep it simple ! 19
  5. Washington Post Noticed 29 … shows that 89,099 shirts were

    ! sold in the past 24 hours… Sales in the past hour were $99,220 A color-coded map of the U.S. shows! which states have the greatest sales. … sales volume for the past four ! weeks sold $197,352.86 in products http://wapo.st/1gx8oT8
  6. Team Benefits • Data Visualization • Insight into customer behaviors/

    patterns • Widespread goal driven and performance culture 31
  7. The Stack • Dashing gem • Sinatra • Rufus Scheduler

    gem • Batman.js • Sprockets - asset pipeline • Gridster.js 34
  8. Dashboards • Multiple for different screen size or audience •

    Drag and drop layout • Custom grid –Widget base dimensions –Num columns 35
  9. Server-Sent Events server-sent events API every 60s 39 Dashing Server

    Application TV Dashboard TV Dashboard Service
  10. 44

  11. 45

  12. 46

  13. 47

  14. 48

  15. 49

  16. Be Considerate • Use simple caching strategies • Don’t request

    all the data • Appropriate polling frequency 58