Upgrade to Pro — share decks privately, control downloads, hide ads and more …

Creating a Dashboard for Visualizing and Interacting with IoT Data

Creating a Dashboard for Visualizing and Interacting with IoT Data

Presented at DeveloperWeek in San Francisco on February 14th, 2017.

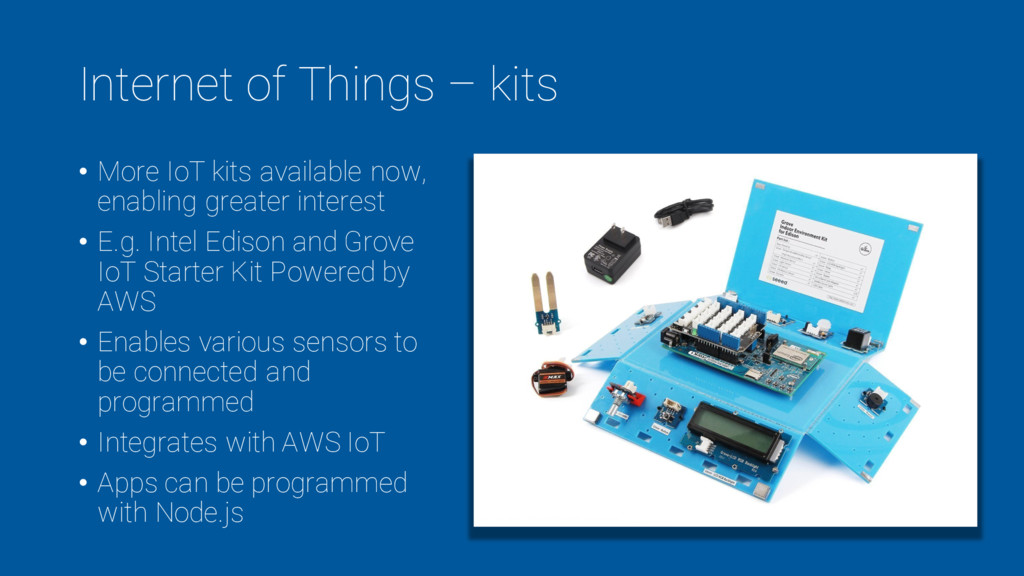
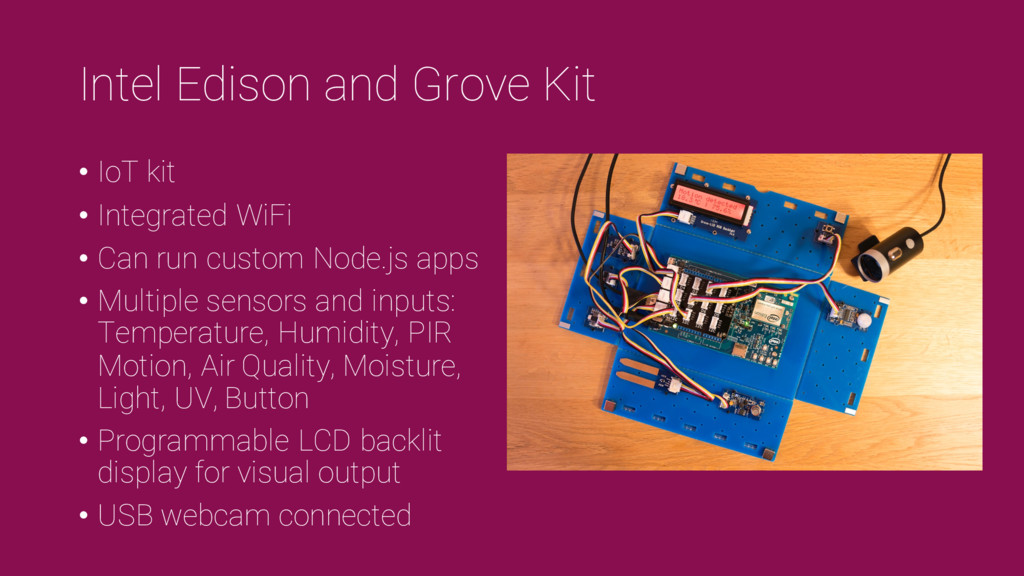
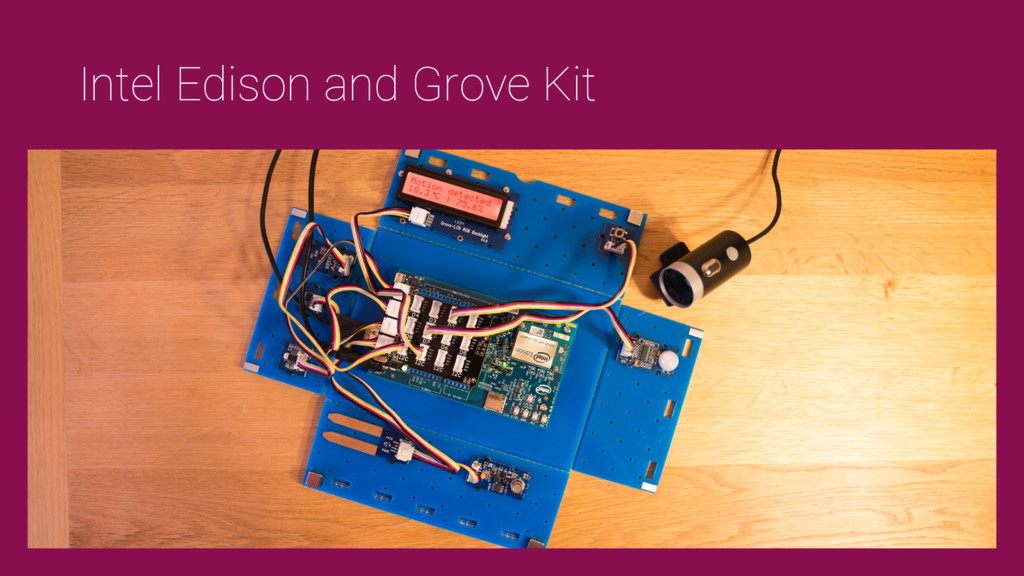
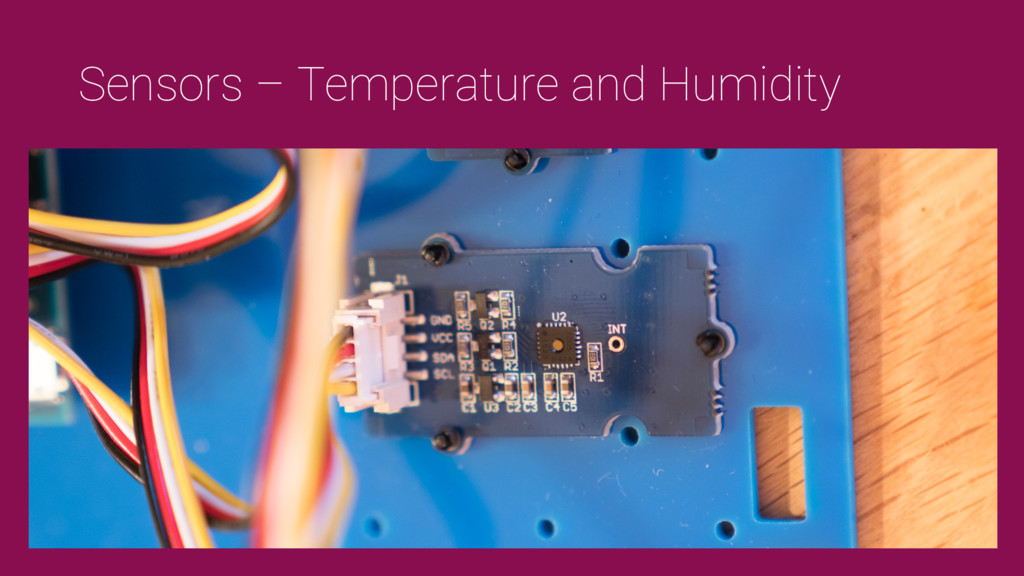
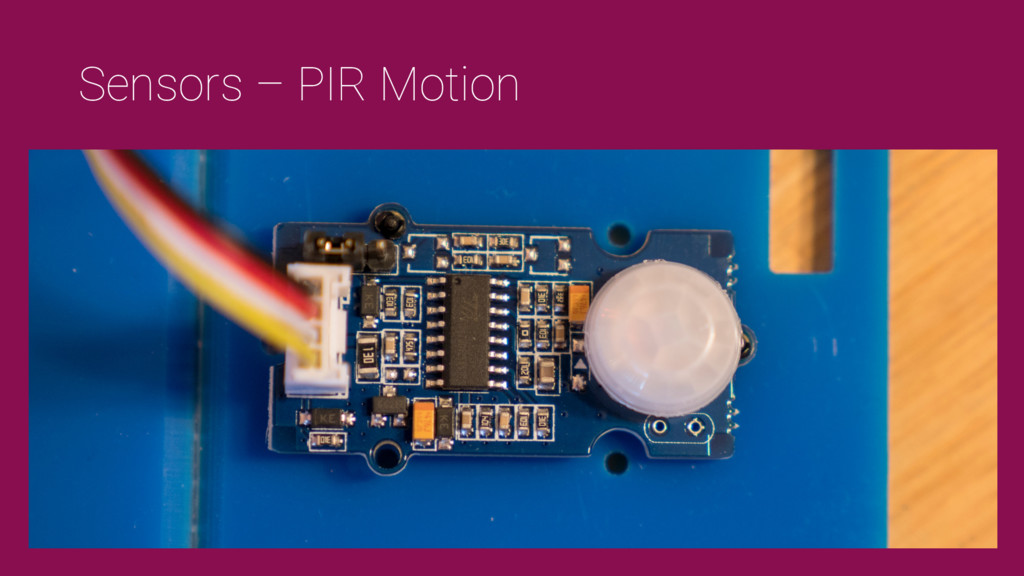
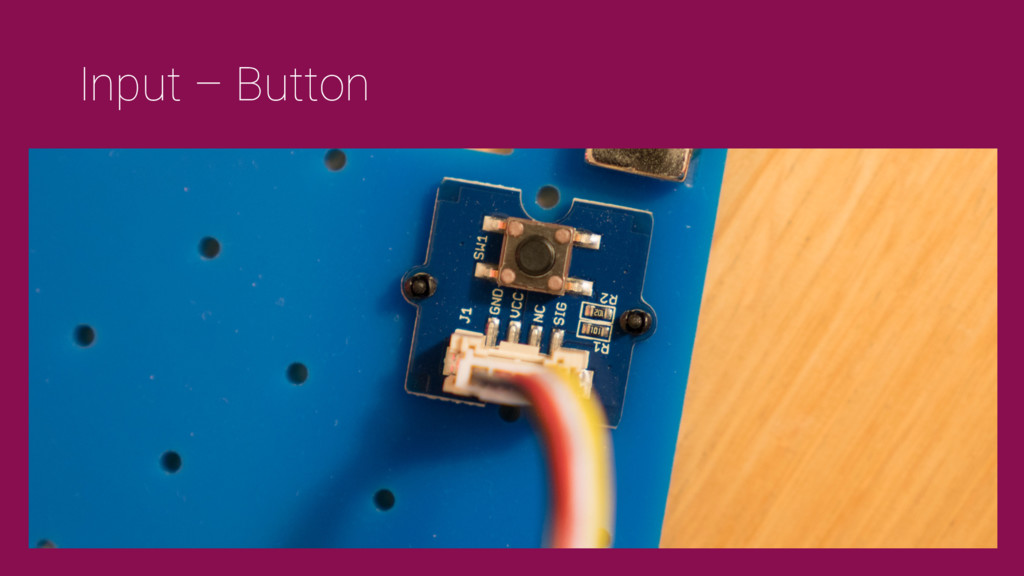
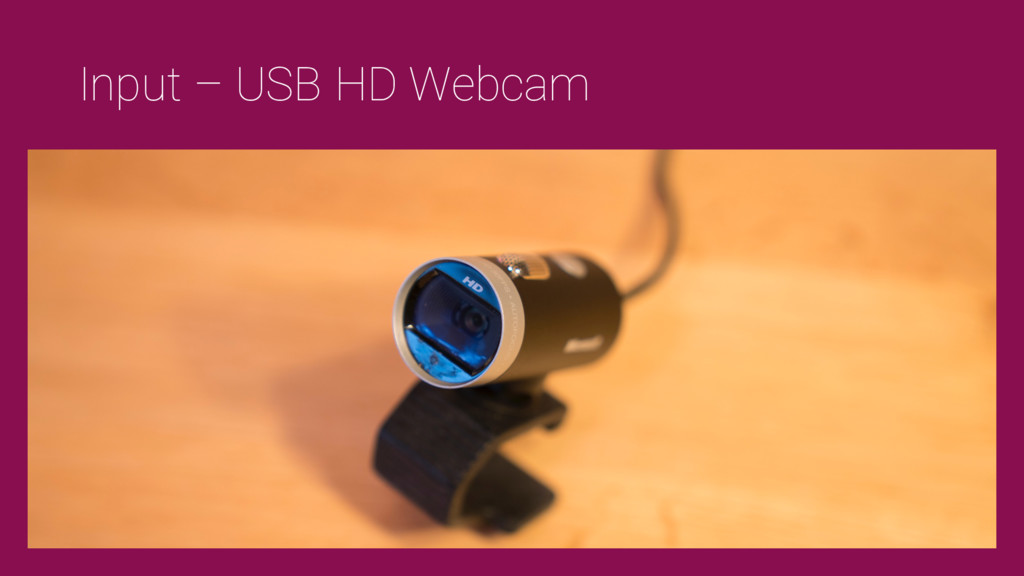
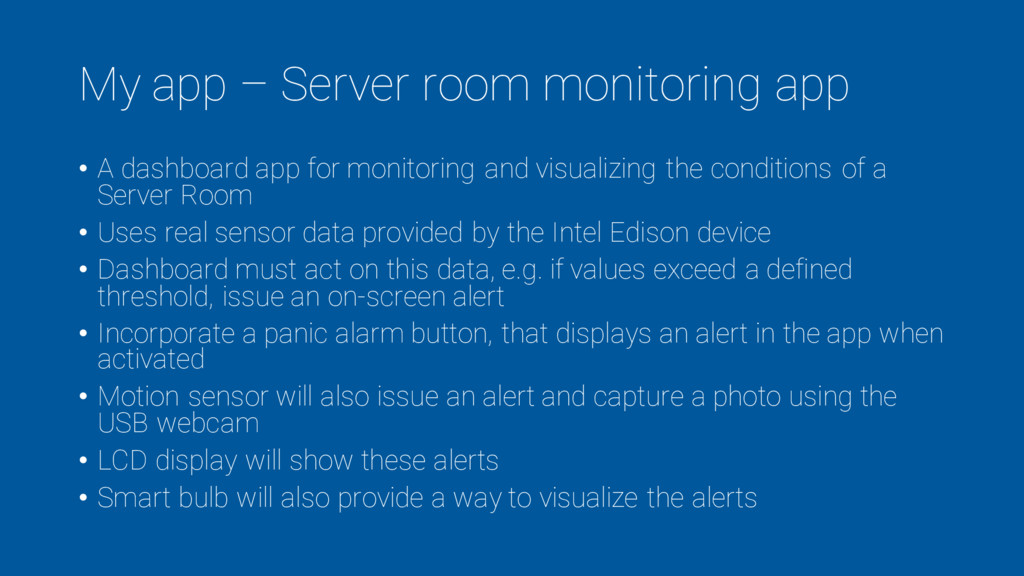
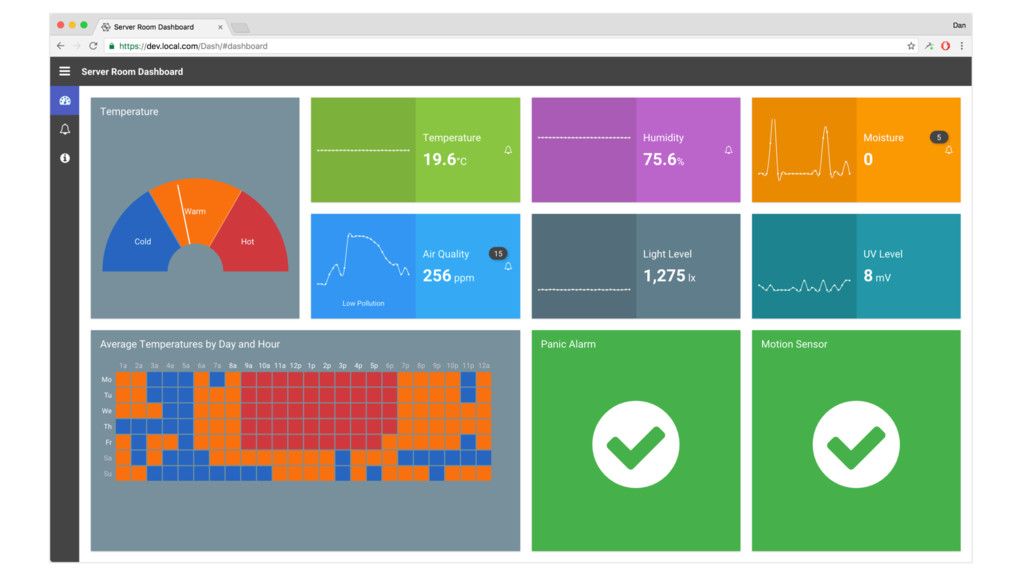
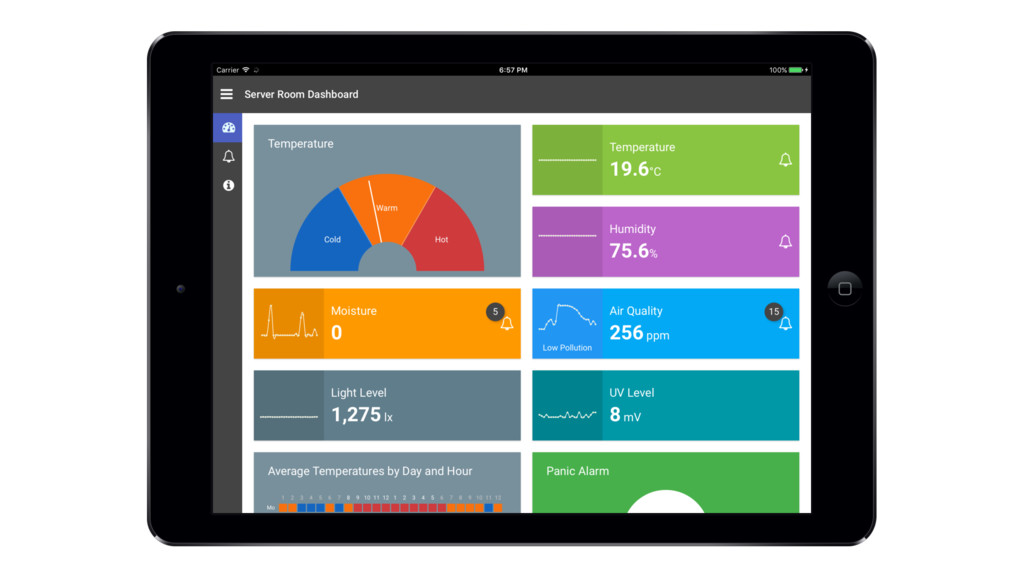
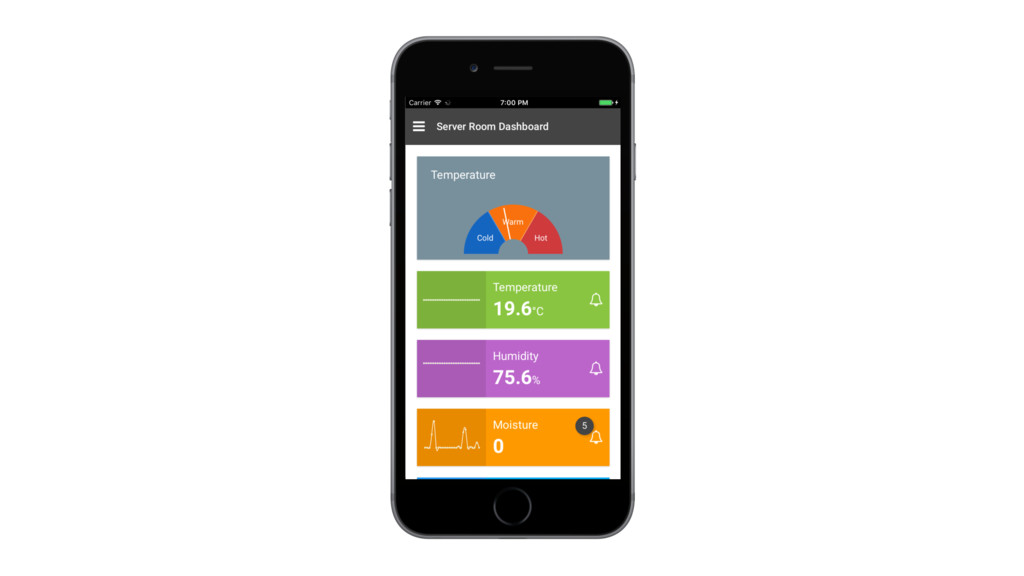
"Learn how to read sensor data from an Intel Edison device, and visualize the connected sensors via a Sencha Ext JS dashboard that’s constructed with components including grids, charts and widgets."

Daniel Gallo

February 14, 2017
Tweet

More Decks by Daniel Gallo

Other Decks in Technology

Transcript

  1. Dan Gallo • Technical Sales Engineer at Sencha • Background

    in web app development speakerdeck.com/danielgallo @DanielJGallo
  2. Big data and Internet of Things (IoT) • How do

    we handle data from different devices and sources? • How do we visualize this data to make it meaningful, and to aid us in a decision making process?
  3. ?

  4. Internet of Things? • Linking of smart objects to the

    Internet • Physical objects that have an IP address • Exchanging of data between these things, and other Internet connected systems
  5. Internet of Things – uses • Smart homes – lighting,

    door locks, security systems, moisture sensor for leaks, smart fridges • Monitoring environment – temperature, light, humidity • Smart cities – street lighting, traffic, rail • Healthcare • Wearables
  6. Internet of Things – communication • Various communication methods may

    be used: Technology Distance Speed Bluetooth 50-150 m / 54-164 yards 1Mbps Cellular 35-200 km / 21-124 miles 600kbps-10Mbps LoRaWAN 2-15 km / 1-9 miles 0.3-50kbps Neul 10 km / 6 miles 100kbps NFC 10 cm / 4 in 100-420kbps Sigfox 3-50 km / 2-31 miles 10-1000bps WiFi 50 m / 54 yards 150-600Mbps Z-Wave 30 m / 32 yards 9-100kbps Zigbee 10-100 m / 11-110 yards 250kbps
  7. Internet of Things – devices • iotlist.co contains a good

    selection of available devices • Some examples:
  8. Internet of Things – devices • iotlist.co contains a good

    selection of available devices • Some examples:
  9. Internet of Things – kits • More IoT kits available

    now, enabling greater interest • E.g. Intel Edison and Grove IoT Starter Kit Powered by AWS • Enables various sensors to be connected and programmed • Integrates with AWS IoT • Apps can be programmed with Node.js
  10. Internet of Things – growth • Cisco estimates the IoT

    will consist of 50 billion devices connected to the Internet by 2020 • Will require the ability to handle and analyze data from many different sources • Also hearing about the IoT much more in the news Source: http://www.cisco.com/c/en/us/solutions/internet-of-things/overview.html
  11. Data • Various services available to help with integration of

    IoT devices and applications: • PubNub • AWS IoT • Azure IoT • These services make it easier to enable devices to communicate with each other and with applications
  12. PubNub • Provides a real-time messaging service • 70+ different

    platform SDKs • Enables devices to communicate with each other regardless of platform
  13. Example – publish messages with Node.js var pubnub = require('pubnub')({

    ssl: true, publish_key: 'publish-key-here' }); pubnub.publish({ channel: 'mychannel', message: { sensor: 'temperature', value: 32.2 }, callback: function(e) { console.log('Message sent', e); } });
  14. Example – subscribe to messages in a web app PUBNUB.init({

    ssl: true, subscribe_key: 'subscribe-key-here' }).subscribe({ channel: 'mychannel', message: function(message) { console.log(message); } }); { sensor: 'temperature', value: 32.2 } Console output: <script src="http://cdn.pubnub.com/pubnub-3.15.2.min.js"></script>
  15. PubNub Blocks – microservices • PubNub Blocks run as microservices

    • JavaScript based functions that run in the cloud • Can execute certain actions when messages are published, for example: • Use the SendGrid API to send the contents of a message as an email • Use IBM Watson to translate text
  16. Intel Edison and Grove Kit • IoT kit • Integrated

    WiFi • Can run custom Node.js apps • Multiple sensors and inputs: Temperature, Humidity, PIR Motion, Air Quality, Moisture, Light, UV, Button • Programmable LCD backlit display for visual output • USB webcam connected
  17. LIFX smart bulb • Internet connected LED bulb • Millions

    of colors • Mobile app for control • REST-based API for third party apps
  18. Johnny-Five – Robotics and IoT Platform • Node.js package that

    provides an out of the box way to easily interact with sensors on a wide range of IoT devices, including Intel Edison • Many APIs and examples • http://johnny-five.io
  19. Sencha Ext JS • JavaScript framework for mobile, tablet and

    desktop apps • Large selection of UI components and widgets • UI can be configured to adapt based on the device type or screen size, enabling an app to run on all platforms from one common codebase
  20. Getting started • Download and install Sencha Cmd and Sencha

    Ext JS from sencha.com • Create a new project from the command line: • Open the project folder in an IDE of your choice sencha -sdk /downloads/ext generate app --name Dash --path /apps/Dash --modern
  21. Getting started – important files • app.json contains application settings,

    such as theme name, version, required packages, caching configuration etc. • app.js initializes the application, and defines the initial view to create on load Ext.application({ name: 'Dash', extend: 'Dash.Application', requires: [ 'Dash.view.main.Main' ], mainView: 'Dash.view.main.Main' });
  22. Getting started – concepts • Applications are structured using an

    MVVM architecture • Each class (view, model, controller etc.) resides within its own .js file, and normally extends from a base class • JSON syntax • A new class is defined by using Ext.define Ext.define('Dash.model.Alert', { extend: 'Ext.data.Model', fields: [{ name: 'text' }, { name: 'value', type: 'number' }, { name: 'sensorType' }] });
  23. My app – Server room monitoring app • A dashboard

    app for monitoring and visualizing the conditions of a Server Room • Uses real sensor data provided by the Intel Edison device • Dashboard must act on this data, e.g. if values exceed a defined threshold, issue an on-screen alert • Incorporate a panic alarm button, that displays an alert in the app when activated • Motion sensor will also issue an alert and capture a photo using the USB webcam • LCD display will show these alerts • Smart bulb will also provide a way to visualize the alerts
  24. My app – Server room monitoring app • Doesn’t require

    a database or any web services • PubNub provides the ability to store messages for a set period, meaning we can easily retrieve recent sensor data when the application loads
  25. Air quality sensor Temp & Humidity sensor Moisture sensor Light

    sensor Button UV sensor PIR Motion sensor USB webcam Edison publishes sensor data Edison subscribes to reset messages Captured photos published to S3 Dashboard app subscribes to sensor data Dashboard app resets motion/panic alarm PubNub Block sends photo via email If app receives panic or motion sensor alarm, flash the LIFX bulb red LCD display shows status and flashes red when alarms activated
  26. In summary • The Internet of Things is getting bigger

    • This means more data, from more sources • In order to do anything meaningful with that data, we need a way to analyze and summarize it
  27. In summary • This requires a UI that can visualize

    information to the user in multiple ways, on a variety of form factors (from mobile to desktop), using Ext JS components such as grids, pivot grids, charts, and D3.js integration • Using a framework like Ext JS provides a mechanism to build a powerful web application to summarize this type of data • Using a real-time service like PubNub makes it easier to exchange data between devices and apps