Upgrade to Pro — share decks privately, control downloads, hide ads and more …

High performance PHP8 at Scale

High performance PHP8 at Scale

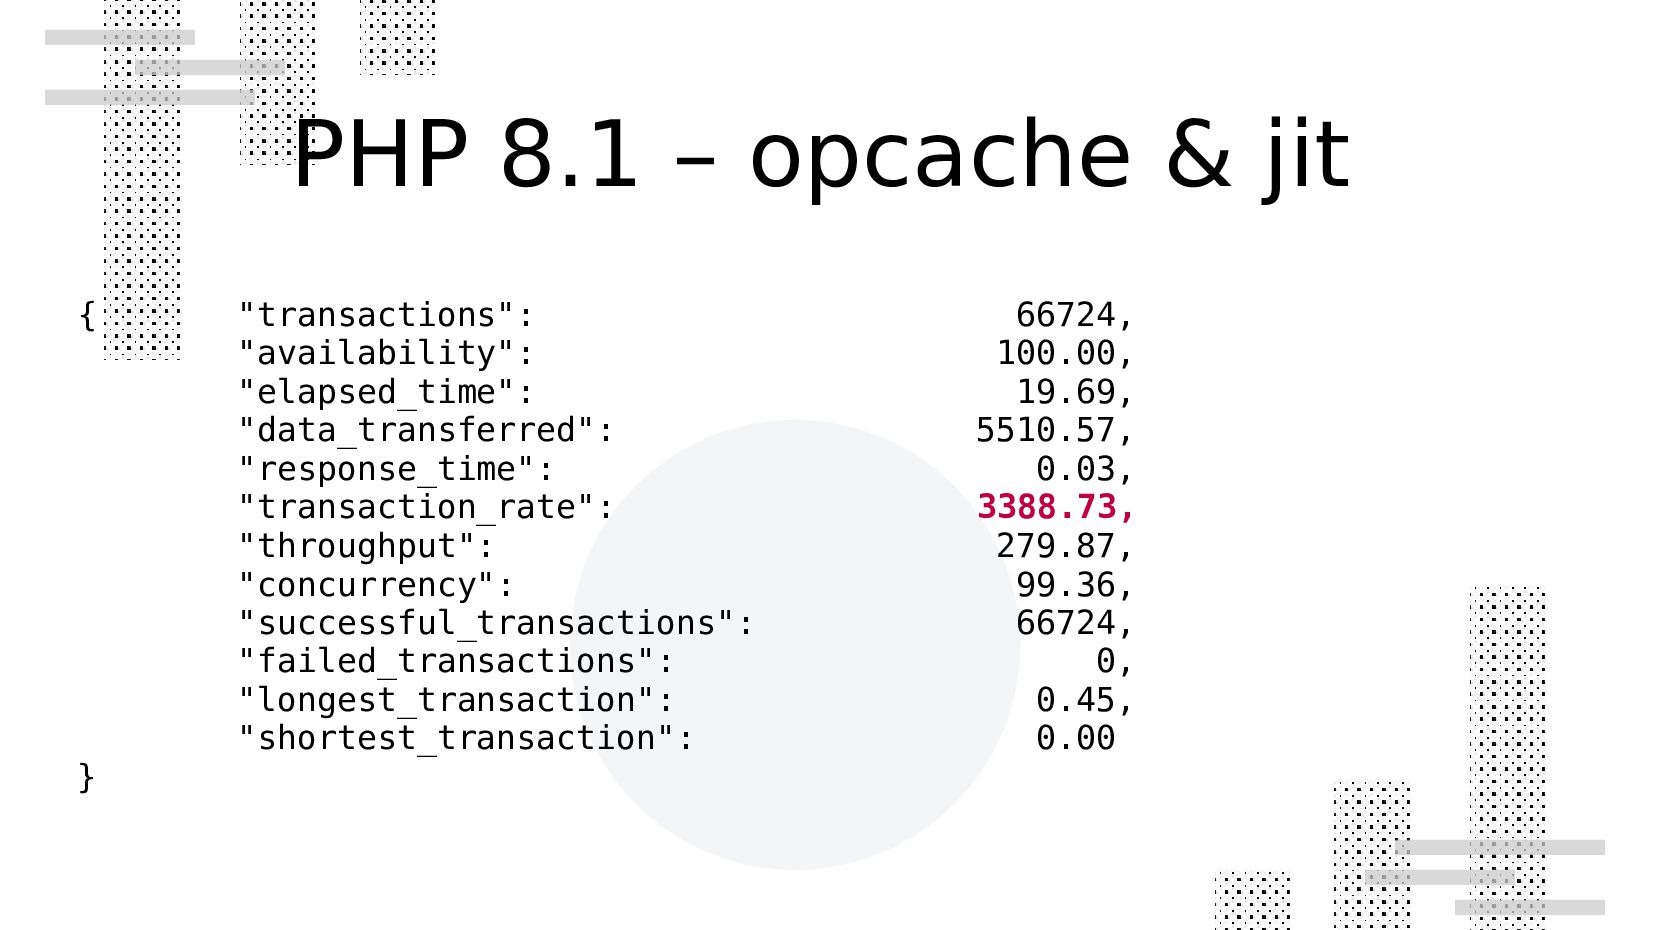
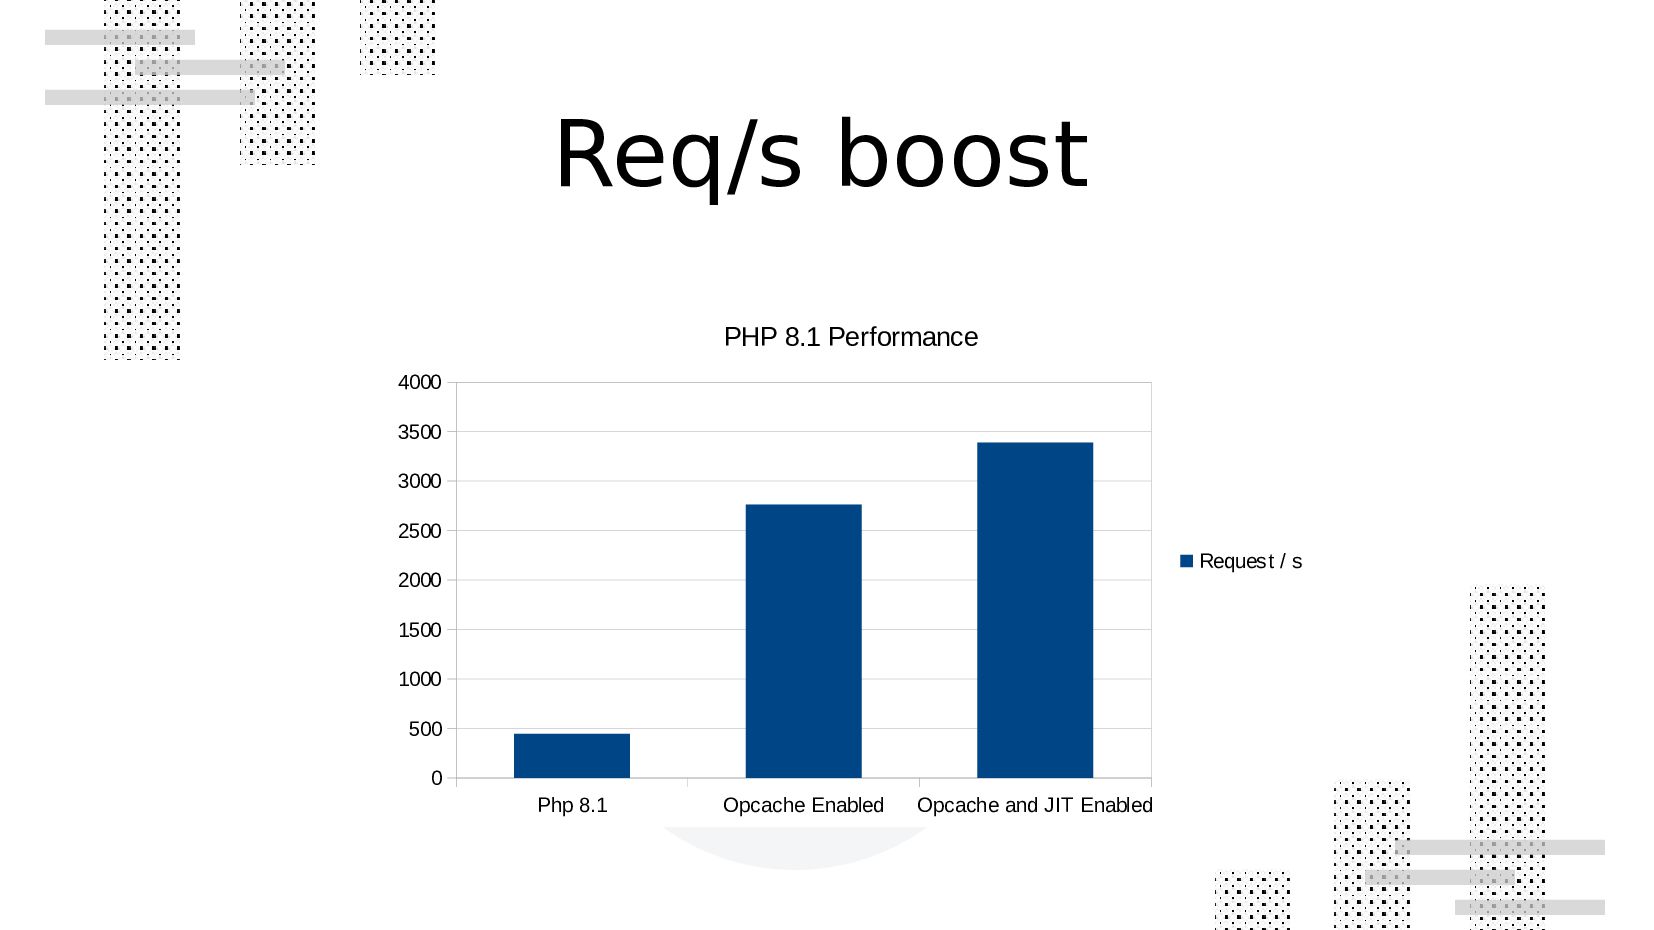
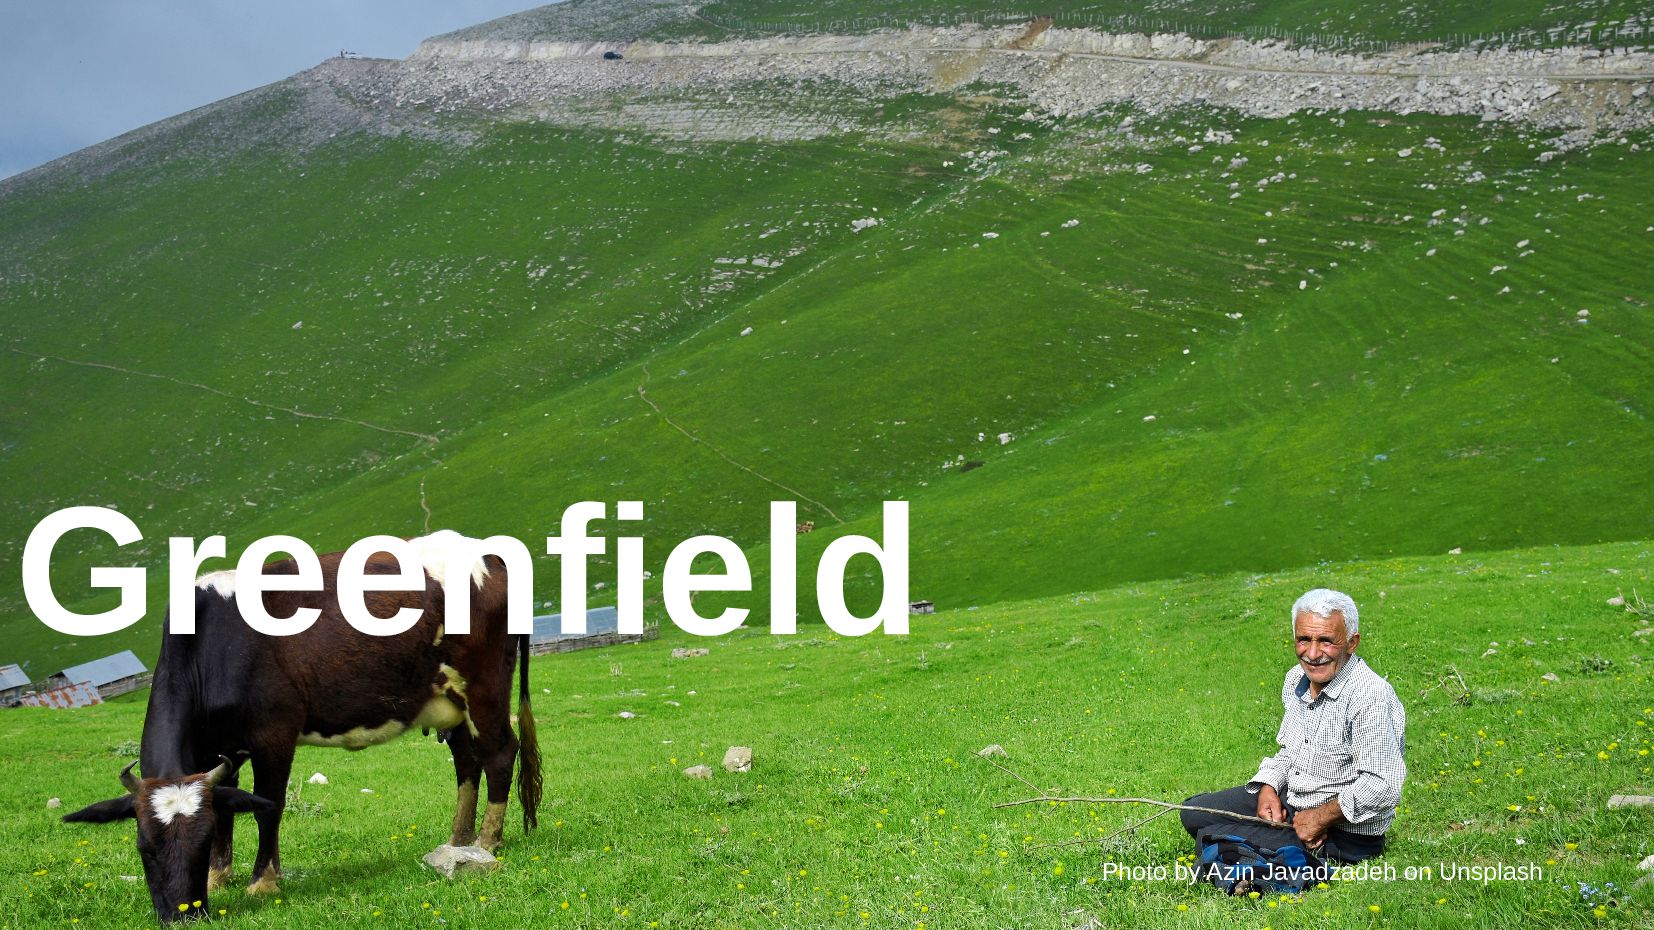
Running well performing php8 application at scale is challenging itself. We gonna start slow and you gonna listen about Php8 JIT compiler configuration and see couple benchmarks. After the JIT we gonna take to another level. Level of developer good practices. With all that knowledge I will guide you on a path of a greenfield application and show the possible pitfalls and hiccups. Finally we gonna take a ride on a roller-coaster of a legacy app that is performance lacking.

Max Małecki

June 23, 2023
Tweet

More Decks by Max Małecki

Other Decks in Technology

Transcript

  1. High performance PHP8 at Scale Max Małecki Poznań, PHPers Summit

    27 May 2023 Photo by Oscar Sutton on Unsplash
  2. Desclimer: Desclimer: I practise what I preach. I practise what

    I preach. Example will be in Symfony 6 Example will be in Symfony 6 Sorry Tyler no Laravel in this presentation. Sorry Tyler no Laravel in this presentation.
  3. Illustrations by Pixeltrue on icons8 0.We gonna talk about “the

    speed” theory; 1.How to find bottlenecks; 2.PHP Configuration tuning; 3.Every day coding good practices; 4.You will learn about benchmarks methodology; 5.We will watch some cool graphs 6.Apply performance boost in to your project. Today’s Agenda
  4. L1 cache reference ......................... 0.5 ns Branch mispredict ............................ 5

    ns L2 cache reference ........................... 7 ns Mutex lock/unlock ........................... 25 ns Main memory reference ...................... 100 ns Compress 1K bytes with Zippy ............. 3,000 ns = 3 µs Send 2K bytes over 1 Gbps network ....... 20,000 ns = 20 µs SSD random read ........................ 150,000 ns = 150 µs Read 1 MB sequentially from memory ..... 250,000 ns = 250 µs Round trip within same datacenter ...... 500,000 ns = 0.5 ms Read 1 MB sequentially from SSD* ..... 1,000,000 ns = 1 ms Disk seek ........................... 10,000,000 ns = 10 ms Read 1 MB sequentially from disk .... 20,000,000 ns = 20 ms Send packet CA->Netherlands->CA .... 150,000,000 ns = 150 ms from https://gist.github.com/hellerbarde/2843375
  5. PHPBench is a benchmark runner for PHP analogous to PHPUnit

    but for performance rather than correctness.
  6. PHPBench (1.2.10) running benchmarks... #standwithukraine with configuration file: /home/mgz/workspace/phpers/summit2023/8.1 Bench/phpbench.json

    with PHP version 8.0.28, xdebug , opcache ❌ ❌ \emgiezet\Tests\Benchmark\TimeConsumerBench benchConsume............................I4 - Mo152.444μs (±0.09%) Subjects: 1, Assertions: 0, Failures: 0, Errors: 0 +------+-------------------+--------------+-----+------+----------+-----------+--------------+----------------+ | iter | benchmark | subject | set | revs | mem_peak | time_avg | comp_z_value | comp_deviation | +------+-------------------+--------------+-----+------+----------+-----------+--------------+----------------+ | 0 | TimeConsumerBench | benchConsume | | 1000 | 704,944b | 152.652μs | +0.92σ | +0.08% | | 1 | TimeConsumerBench | benchConsume | | 1000 | 704,944b | 152.713μs | +1.38σ | +0.12% | | 2 | TimeConsumerBench | benchConsume | | 1000 | 704,944b | 152.390μs | -1.05σ | -0.09% | | 3 | TimeConsumerBench | benchConsume | | 1000 | 704,944b | 152.390μs | -1.05σ | -0.09% | | 4 | TimeConsumerBench | benchConsume | | 1000 | 704,944b | 152.503μs | -0.20σ | -0.02% | +------+-------------------+--------------+-----+------+----------+-----------+--------------+----------------+
  7. Bottleneck A bottleneck is a phenomenon where the performance and/or

    capacity of an entire system is limited by a single or limited number of components or resources.
  8. CPU

  9. Virtualisation Bandwidth to and from the cloud provider Sharing a

    HDD, disk seek death Network I/O fluctuations in the cloud Enabling high-availability without accounting for failover
  10. Database This slide can be separate presentation about database. Most

    popular: 1)Deadlocks, 2)Large joins taking up memory, 3)Long & short running queries
  11. To push your system as far as it’s possible and

    check when it stop responding.
  12. This will run 100 concurent sessions with 100 request each

    in benchmark mode, so with no delays between requests.
  13. { "transactions": 10000, "availability": 100.00, "elapsed_time": 134.82, "data_transferred": 77.36, "response_time":

    1.34, "transaction_rate": 74.17, "throughput": 0.57, "concurrency": 99.57, "successful_transactions": 10000, "failed_transactions": 0, "longest_transaction": 1.73, "shortest_transaction": 0.09 }
  14. Benchmarking localhost (be patient).....done Server Software: nginx/1.17.8 Server Hostname: localhost

    Server Port: 80 Document Path: /en/blog/posts/aliquam-sodales-odio-id- eleifend-tristique Document Length: 31309 bytes
  15. Concurrency Level: 100 Time taken for tests: 0.271 seconds Complete

    requests: 100 Failed requests: 0 Total transferred: 3186100 bytes HTML transferred: 3130900 bytes Requests per second: 369.54 [#/sec] (mean) Time per request: 270.604 [ms] (mean) Time per request: 2.706 [ms] (mean, across all concurrent requests) Transfer rate: 11498.08 [Kbytes/sec] received
  16. Connection Times (ms) min mean[+/-sd] median max Connect: 0 1

    0.2 1 2 Processing: 9 129 73.3 130 259 Waiting: 9 129 73.3 129 259 Total: 10 130 73.1 131 260
  17. Percentage of the requests served within a certain time (ms)

    50% 131 66% 171 75% 191 80% 205 90% 230 95% 249 98% 260 99% 260 100% 260 (longest request)
  18. https://github.com/gatling/gatling • Written mostly in Scala • Support load testing

    scenarios in scala/java/kotlin • Have scenario recorder • Needs own server to unleash its full capabilities • Available also as paid SaaS: gatling.io
  19. Profiling checking the entire callstack for given part of code.

    Each function is listed with: execution time and amount of calls.
  20. RUN curl "http://pecl.php.net/get/xhprof-2.3.2.tgz" -fsL -o ./xhprof- 2.3.2.tgz && \ mkdir

    /var/xhprof && tar xf ./xhprof-2.3.2.tgz -C /var/xhprof && \ cd /var/xhprof/xhprof-2.3.2/extension && \ phpize && \ ./configure && \ make && \ make install # custom settings for xhprof COPY ./xhprof.ini /usr/local/etc/php/conf.d/xhprof.ini RUN docker-php-ext-enable xhprof #folder for xhprof profiles (same as in file xhprof.ini) RUN mkdir -m 777 /profiles Add it to your Dockerfile
  21. #[Route('/', name: 'blog_index', defaults: ['page' => '1', '_format' => 'html'],

    methods: ['GET'])] #[Route('/rss.xml', name: 'blog_rss', defaults: ['page' => '1', '_format' => 'xml'], methods: ['GET'])] #[Route('/page/{page<[1-9]\d{0,8}>}', name: 'blog_index_paginated', defaults: ['_format' => 'html'], methods: ['GET'])] #[Cache(smaxage: 10)] public function index(Request $request, int $page, string $_format, PostRepository $posts, TagRepository $tags): Response { xhprof_enable(XHPROF_FLAGS_MEMORY + XHPROF_FLAGS_CPU); $tag = null; if ($request->query->has('tag')) { $tag = $tags->findOneBy(['name' => $request->query->get('tag')]); } $latestPosts = $posts->findLatest($page, $tag); file_put_contents('/profiles/'.time().'.application.xhprof', serialize(xhprof_disable())); // Every template name also has two extensions that specify the format and // engine for that template. // See https://symfony.com/doc/current/templates.html#template-naming return $this->render('blog/index.'.$_format.'.twig', [ 'paginator' => $latestPosts, 'tagName' => $tag?->getName(), ]); }
  22. Pros • Can be used with production settings. • Can

    profile only couple lines of code.
  23. Tip of the day. • If you like your SSD

    life span turn off profiling while load testing ;)
  24. There are only two hard things in Computer Science: cache

    invalidation and naming things. - Phil Karlton
  25. Photo by shri on Unsplash or for the tofu course

    To don’t offend anybody today.
  26. JIT Modes • opcache.jit = 1205 - all code is

    JIT compiled • opcache.jit = 1235 - only selected code portions (based on their relative use) are passed to the JIT compilation • opcache.jit = 1255 - application code is tracked for compilation by JIT and selected parts of the code are transferred to the compiler
  27. Benchmark App • Symfony Demo App – In a docker

    container – Ngnix & php-fpm – In prod mode – Whitout xdebug – Mysql isntead of sqlite – It has symfony.cache enabled (#[Cache(smaxage: 10)])
  28. What we gonna benchmark? • 8.1 • 8.1 Opcache •

    8.1 Opcache + JIT compiler enabled
  29. PHP 8.1 – no opcache { "transactions": 66730, "availability": 100.00,

    "elapsed_time": 149.54, "data_transferred": 5511.54, "response_time": 0.22, "transaction_rate": 446.24, "throughput": 36.86, "concurrency": 99.45, "successful_transactions": 66730, "failed_transactions": 0, "longest_transaction": 1.75, "shortest_transaction": 0.00 }
  30. PHP 8.1 – opcache { "transactions": 66988, "availability": 100.00, "elapsed_time":

    24.26, "data_transferred": 5535.86, "response_time": 0.04, "transaction_rate": 2761.25, "throughput": 228.19, "concurrency": 99.38, "successful_transactions": 66988, "failed_transactions": 0, "longest_transaction": 0.40, "shortest_transaction": 0.00 }
  31. PHP 8.1 – opcache & jit { "transactions": 66724, "availability":

    100.00, "elapsed_time": 19.69, "data_transferred": 5510.57, "response_time": 0.03, "transaction_rate": 3388.73, "throughput": 279.87, "concurrency": 99.36, "successful_transactions": 66724, "failed_transactions": 0, "longest_transaction": 0.45, "shortest_transaction": 0.00 }
  32. Req/s boost Php 8.1 Opcache Enabled Opcache and JIT Enabled

    0 500 1000 1500 2000 2500 3000 3500 4000 PHP 8.1 Performance Request / s
  33. Photo by Brands&People on Unsplash What you can What you

    can apply to your apply to your project? project?