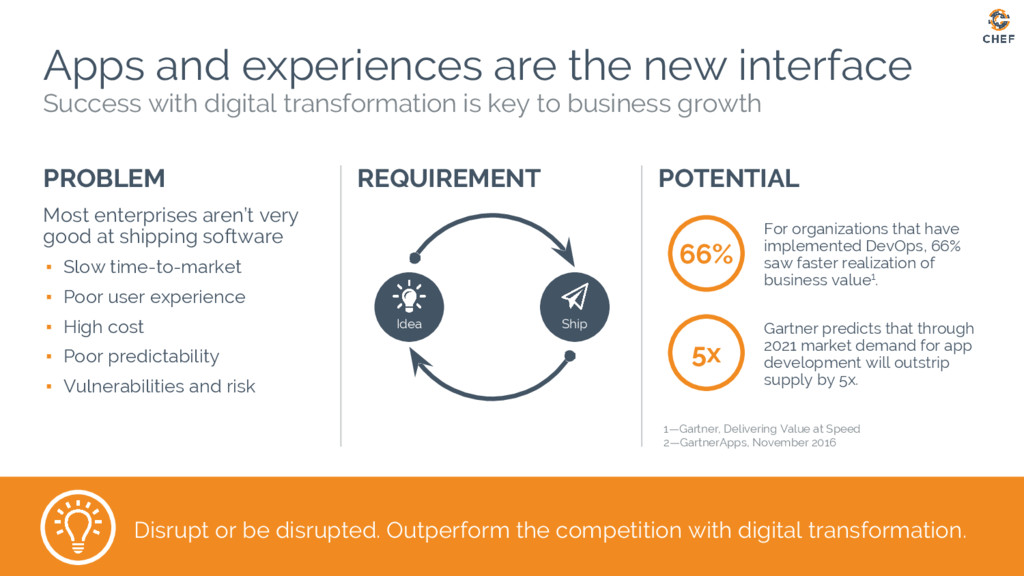
be disrupted. Outperform the competition with digital transformation. Success with digital transformation is key to business growth Idea Ship PROBLEM Most enterprises aren’t very good at shipping software ▪ Slow time-to-market ▪ Poor user experience ▪ High cost ▪ Poor predictability ▪ Vulnerabilities and risk POTENTIAL 1—Gartner, Delivering Value at Speed 2—GartnerApps, November 2016 REQUIREMENT For organizations that have implemented DevOps, 66% saw faster realization of business value1. Gartner predicts that through 2021 market demand for app development will outstrip supply by 5x. 66%
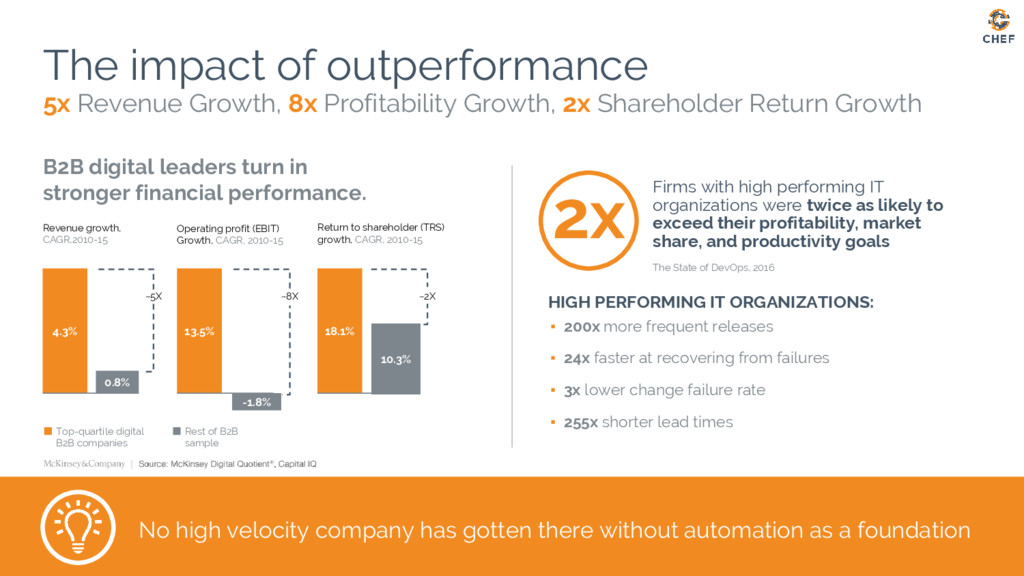
2x Shareholder Return Growth 4.3% 13.5% 18.1% 0.8% -1.8% 10.3% B2B digital leaders turn in stronger financial performance. Top-quartile digital B2B companies Rest of B2B sample Revenue growth, CAGR,2010-15 Operating profit (EBIT) Growth, CAGR, 2010-15 Return to shareholder (TRS) growth, CAGR, 2010-15 ~5X ~8X ~2X Firms with high performing IT organizations were twice as likely to exceed their profitability, market share, and productivity goals The State of DevOps, 2016 HIGH PERFORMING IT ORGANIZATIONS: ▪ 200x more frequent releases ▪ 24x faster at recovering from failures ▪ 3x lower change failure rate ▪ 255x shorter lead times No high velocity company has gotten there without automation as a foundation 2x
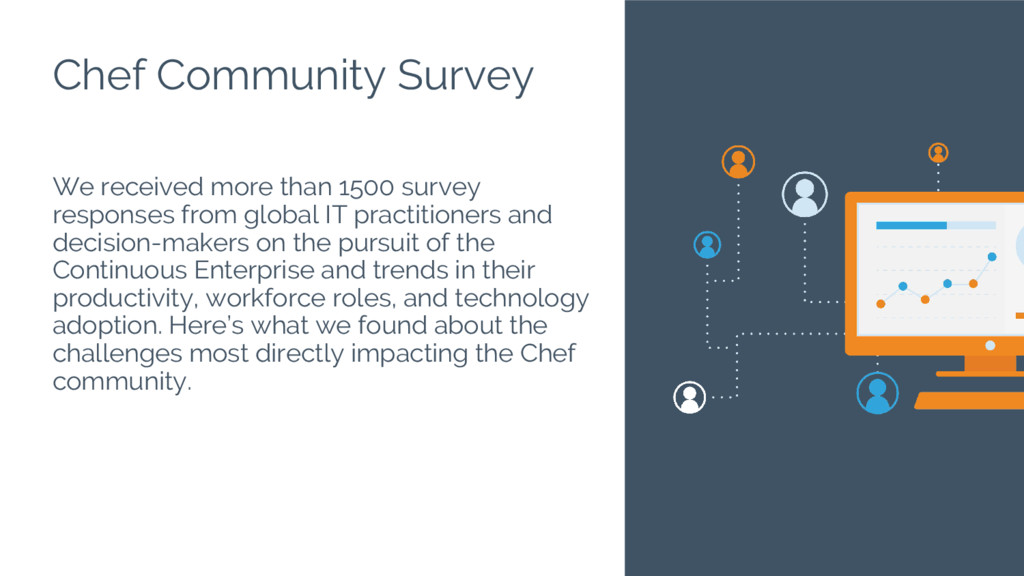
practitioners and decision-makers on the pursuit of the Continuous Enterprise and trends in their productivity, workforce roles, and technology adoption. Here’s what we found about the challenges most directly impacting the Chef community. Chef Community Survey
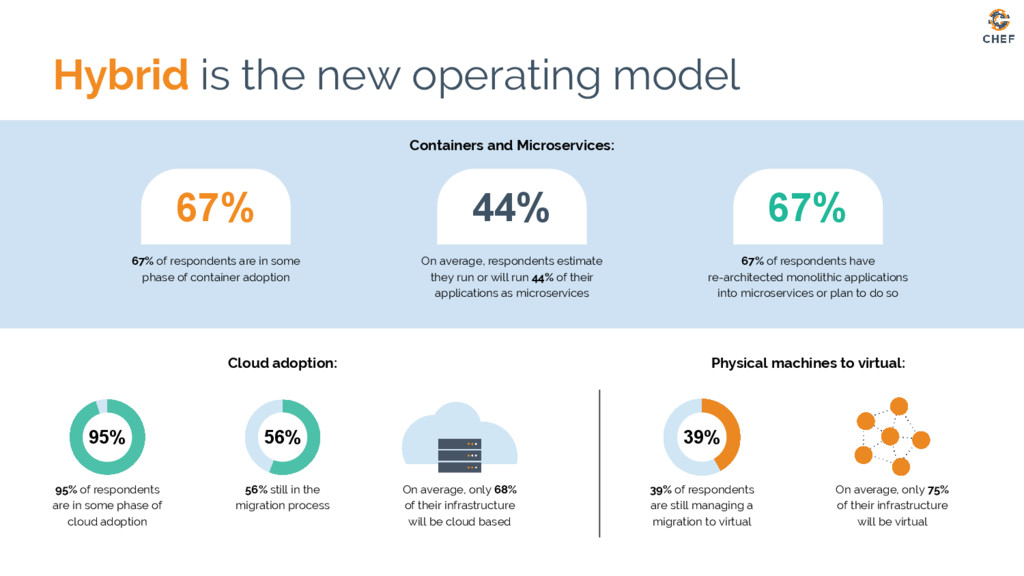
Cloud adoption: 95% of respondents are in some phase of cloud adoption 56% still in the migration process On average, only 68% of their infrastructure will be cloud based 67% 44% 67% 67% of respondents are in some phase of container adoption On average, respondents estimate they run or will run 44% of their applications as microservices 67% of respondents have re-architected monolithic applications into microservices or plan to do so 95% Physical machines to virtual: 39% of respondents are still managing a migration to virtual 39% On average, only 75% of their infrastructure will be virtual
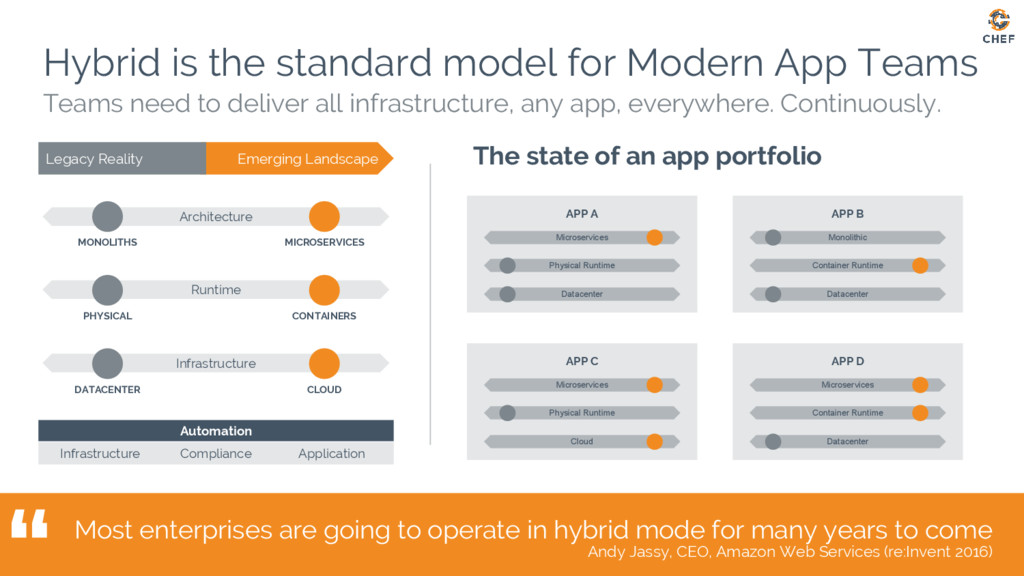
Runtime Datacenter Microservices ” Hybrid is the standard model for Modern App Teams Teams need to deliver all infrastructure, any app, everywhere. Continuously. Emerging Landscape Legacy Reality Most enterprises are going to operate in hybrid mode for many years to come Andy Jassy, CEO, Amazon Web Services (re:Invent 2016) Architecture MONOLITHS MICROSERVICES Runtime PHYSICAL CONTAINERS Infrastructure DATACENTER CLOUD Infrastructure Application Compliance Automation The state of an app portfolio APP A APP B APP C APP D Physical Runtime Datacenter
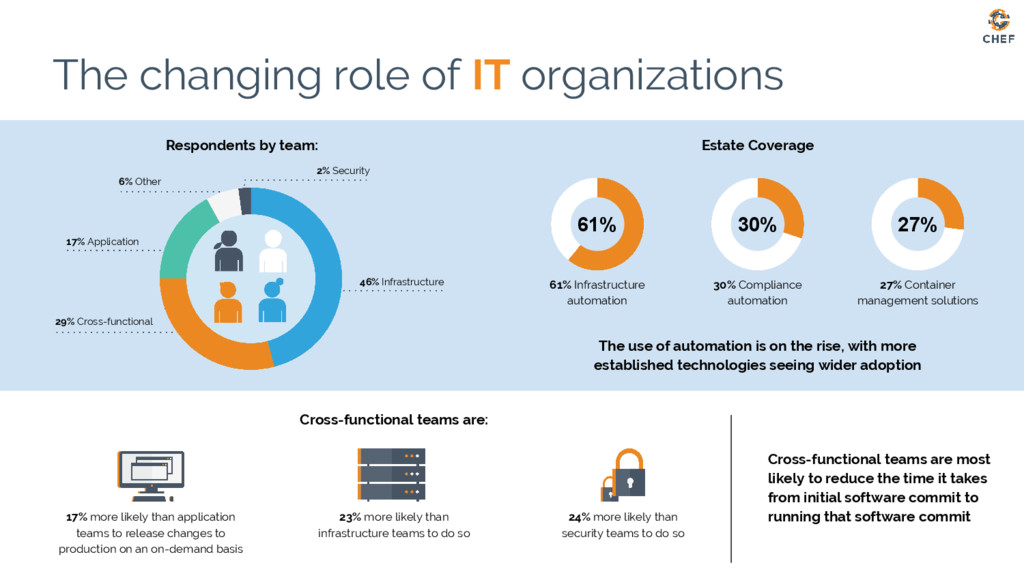
Security 46% Infrastructure 29% Cross-functional 17% Application 6% Other 61% 30% 27% Estate Coverage 61% Infrastructure automation 30% Compliance automation 27% Container management solutions The use of automation is on the rise, with more established technologies seeing wider adoption Cross-functional teams are: 17% more likely than application teams to release changes to production on an on-demand basis 23% more likely than infrastructure teams to do so 24% more likely than security teams to do so Cross-functional teams are most likely to reduce the time it takes from initial software commit to running that software commit
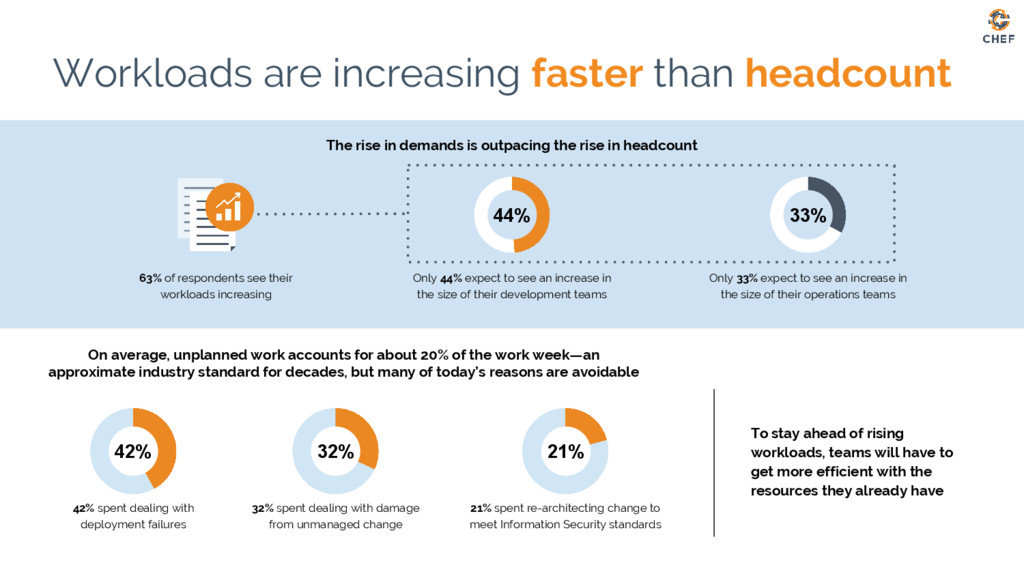
is outpacing the rise in headcount On average, unplanned work accounts for about 20% of the work week—an approximate industry standard for decades, but many of today’s reasons are avoidable 42% spent dealing with deployment failures 63% of respondents see their workloads increasing Only 44% expect to see an increase in the size of their development teams Only 33% expect to see an increase in the size of their operations teams 44% 33% 42% 32% 21% 32% spent dealing with damage from unmanaged change 21% spent re-architecting change to meet Information Security standards To stay ahead of rising workloads, teams will have to get more efficient with the resources they already have
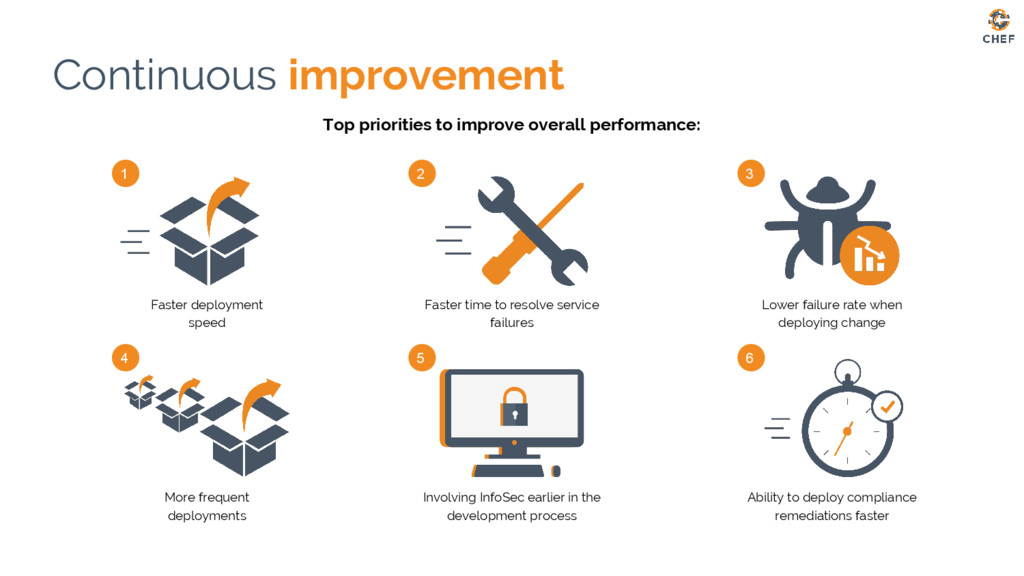
performance: Faster time to resolve service failures Lower failure rate when deploying change More frequent deployments Involving InfoSec earlier in the development process Ability to deploy compliance remediations faster 1 2 3 4 5 6
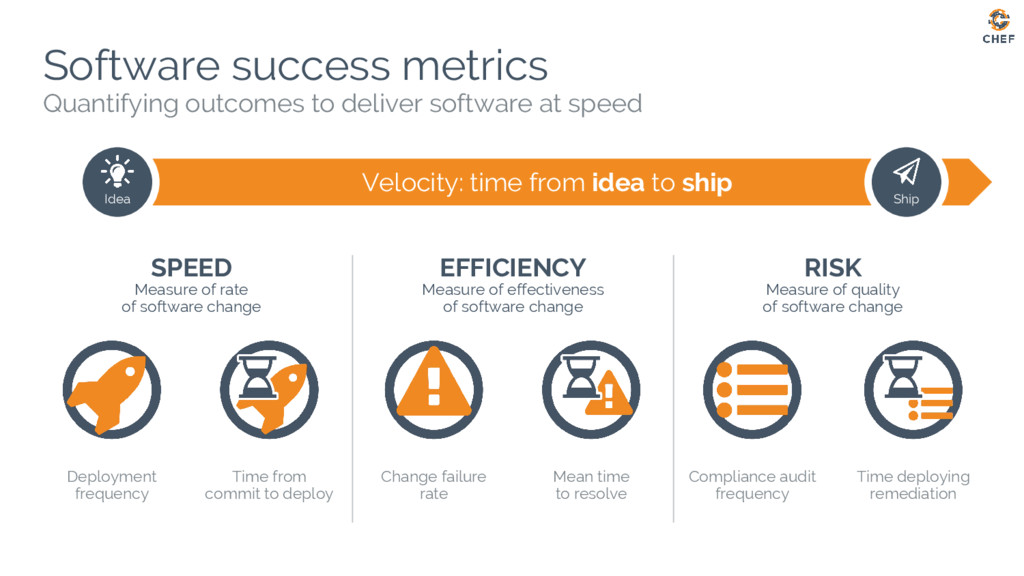
outcomes to deliver software at speed Deployment frequency Time from commit to deploy Mean time to resolve Time deploying remediation Change failure rate SPEED Measure of rate of software change EFFICIENCY Measure of effectiveness of software change RISK Measure of quality of software change Compliance audit frequency Idea Ship
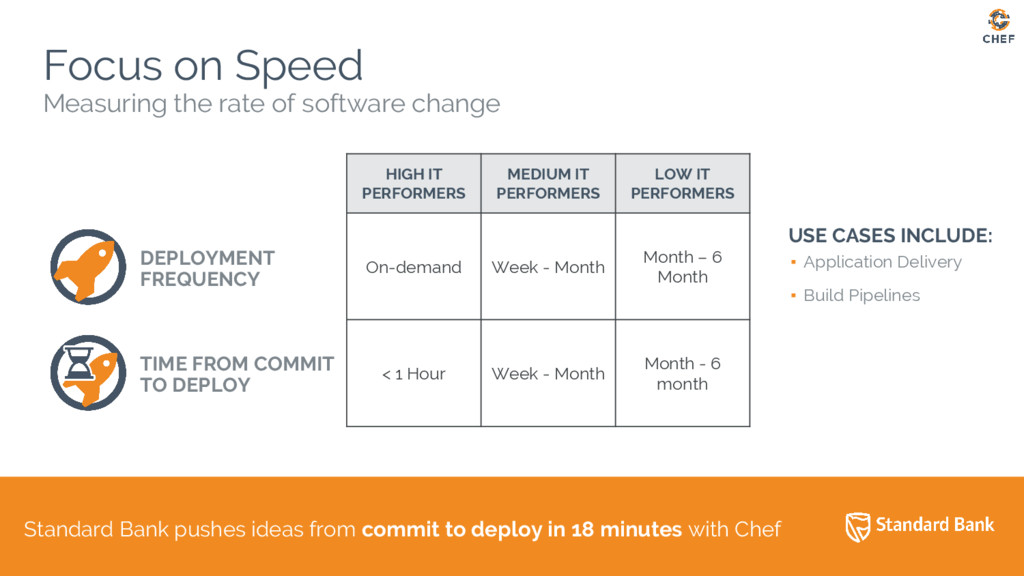
minutes with Chef Focus on Speed Measuring the rate of software change HIGH IT PERFORMERS MEDIUM IT PERFORMERS LOW IT PERFORMERS On-demand Week - Month Month – 6 Month < 1 Hour Week - Month Month - 6 month USE CASES INCLUDE: ▪ Application Delivery ▪ Build Pipelines DEPLOYMENT FREQUENCY TIME FROM COMMIT TO DEPLOY
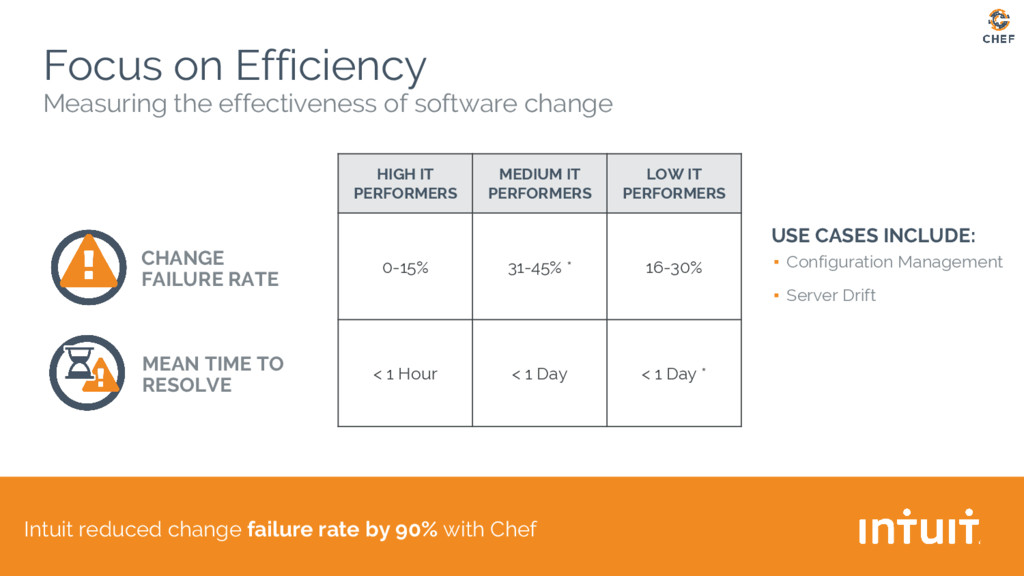
on Efficiency Measuring the effectiveness of software change HIGH IT PERFORMERS MEDIUM IT PERFORMERS LOW IT PERFORMERS 0-15% 31-45% * 16-30% < 1 Hour < 1 Day < 1 Day * USE CASES INCLUDE: ▪ Configuration Management ▪ Server Drift CHANGE FAILURE RATE MEAN TIME TO RESOLVE
on Risk Measuring the quality of software change HIGH IT PERFORMERS MEDIUM IT PERFORMERS LOW IT PERFORMERS On-Demand Week - Month Month - 12 Months < 1 Hour Week - Month Month - 6 Months USE CASES INCLUDE: ▪ Compliance Automation ▪ Compliance Coverage COMPLIANCE AUDIT FREQUENCY TIME DEPLOYING REMEDIATION
outcomes to deliver software at speed Deployment frequency Time from commit to deploy Mean time to resolve Time deploying remediation Change failure rate SPEED Measure of rate of software change EFFICIENCY Measure of effectiveness of software change RISK Measure of quality of software change Compliance audit frequency Idea Ship