algorithms and fundamentals n Usage examples n Basic sampling techniques and estimators n Preferential data delivery n Online join algorithms n Relation to OLAP, etc. n Some thoughts on research directions n More resources to appear on the web n Annotated bibliography n Extended slide set n Survey paper
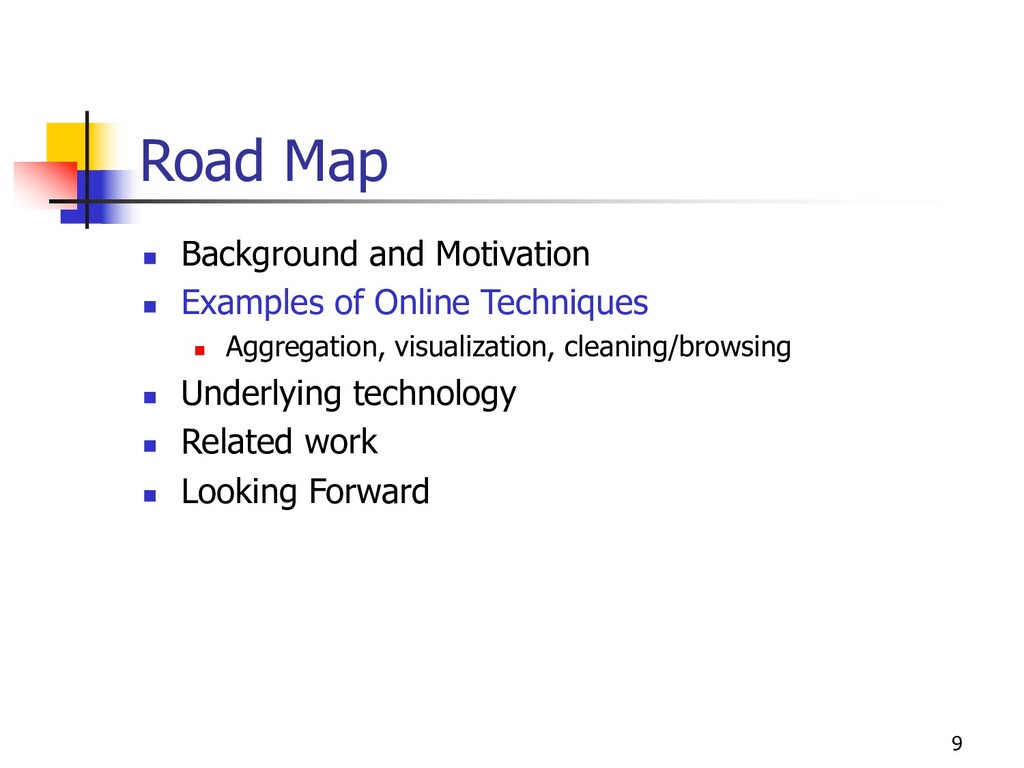
n Tech trends and prognostications n Goals for online processing n Examples of online techniques n Underlying technology n Related work n Looking forward
Real-time interaction (impatience!) n Spreadsheets, WYSIWYG editors n Modern statistics packages n Netscape STOP button n Visually-oriented interface n Approximate results are usually OK Time System 1 System 2 System 3 1.0000 3.01325 4.32445 7.5654 2.0000 4.54673 6.56784 8.6562 3.0000 5.46571 6.87658 10.3343 VS
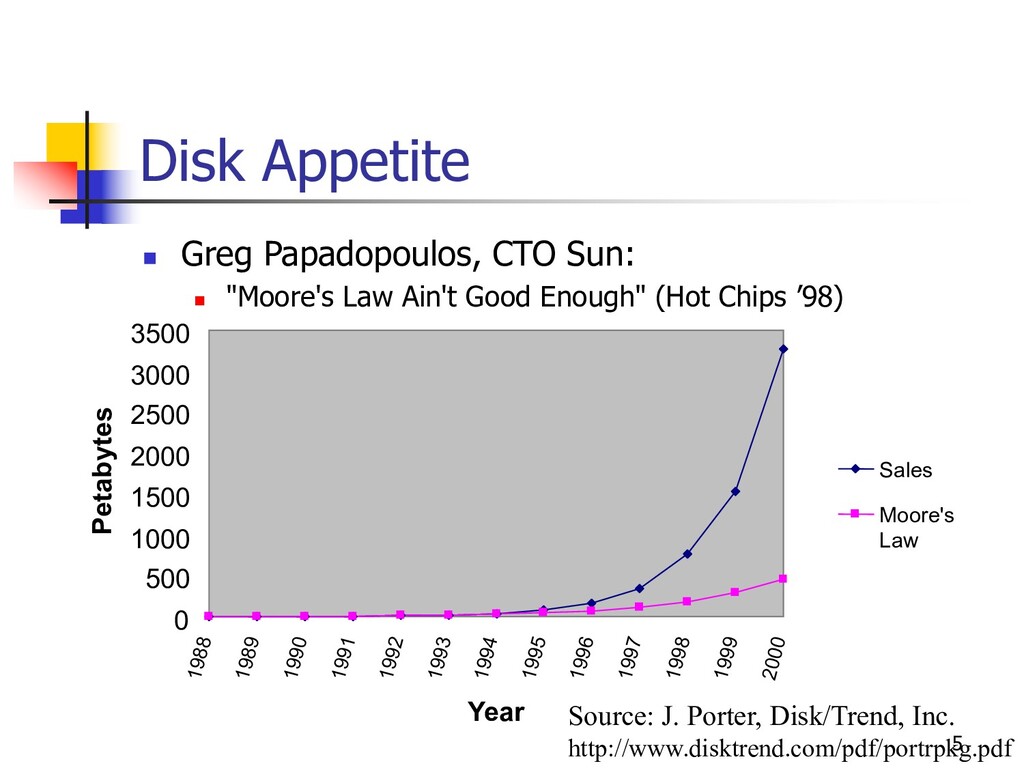
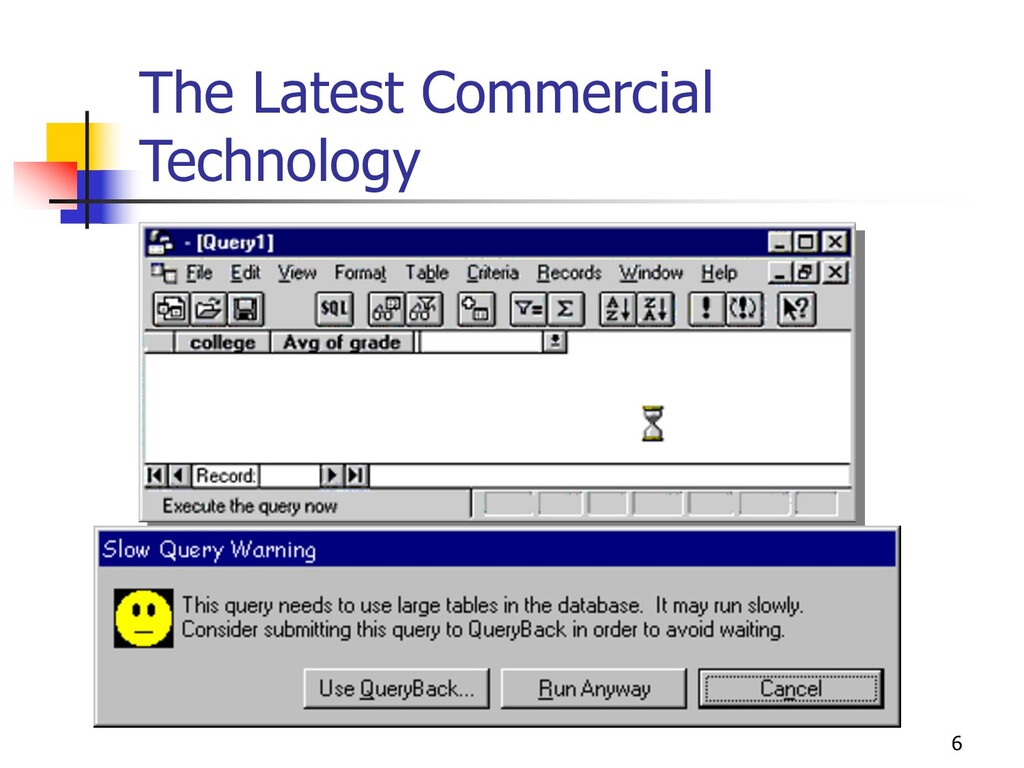
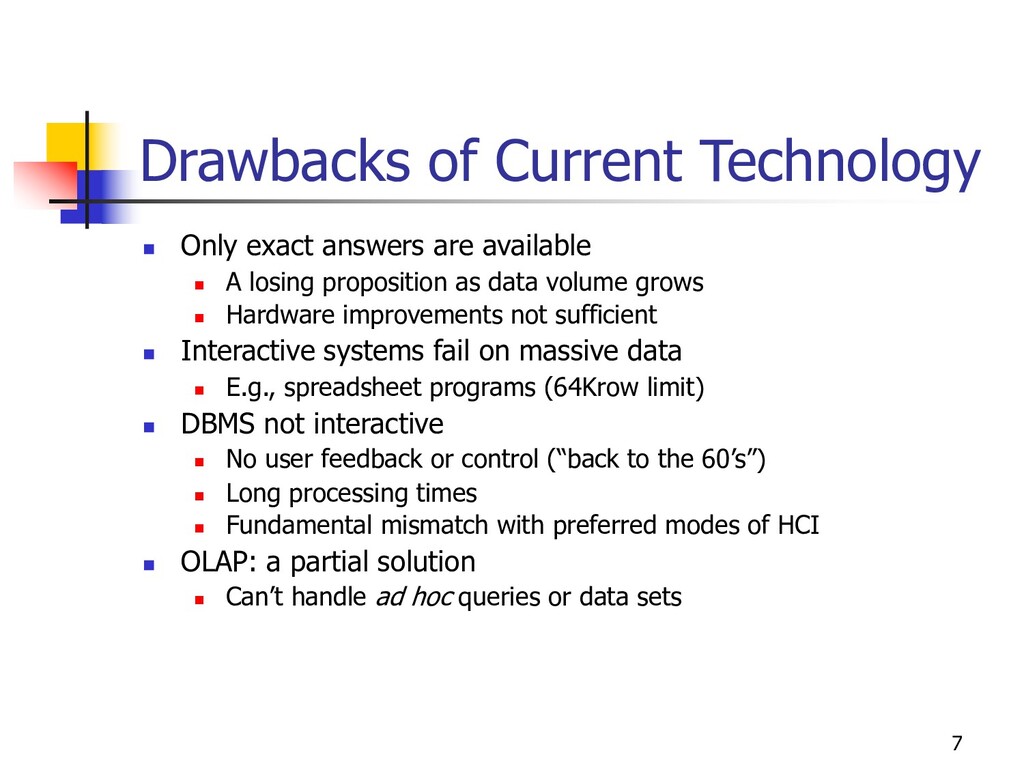
available n A losing proposition as data volume grows n Hardware improvements not sufficient n Interactive systems fail on massive data n E.g., spreadsheet programs (64Krow limit) n DBMS not interactive n No user feedback or control (“back to the 60’s”) n Long processing times n Fundamental mismatch with preferred modes of HCI n OLAP: a partial solution n Can’t handle ad hoc queries or data sets
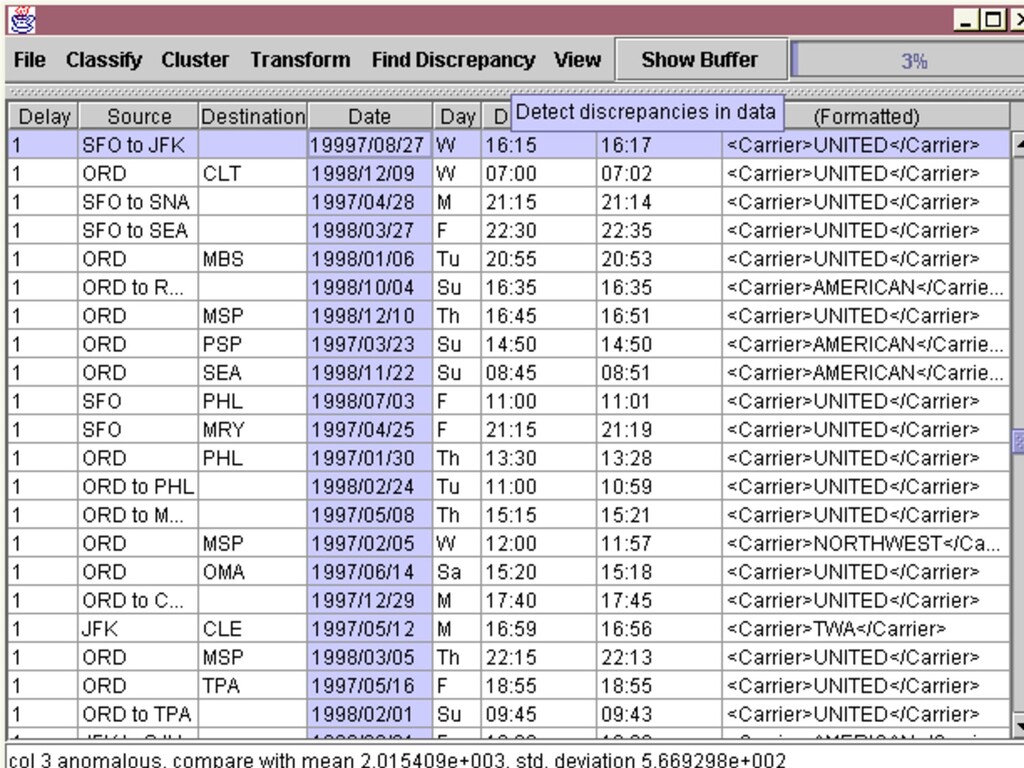
spreadsheet n A fraction of data is materialized in GUI widget n Scrolling = preference for data delivery in a quantile n Permits “fuzzy” querying n Interactive data cleaning n Online structure and discrepancy detection n Online aggregation
online techniques n Underlying technology n Building blocks: sampling, estimation n Preferential data delivery n Pipelined adaptive processing algorithms n Related work n Looking forward
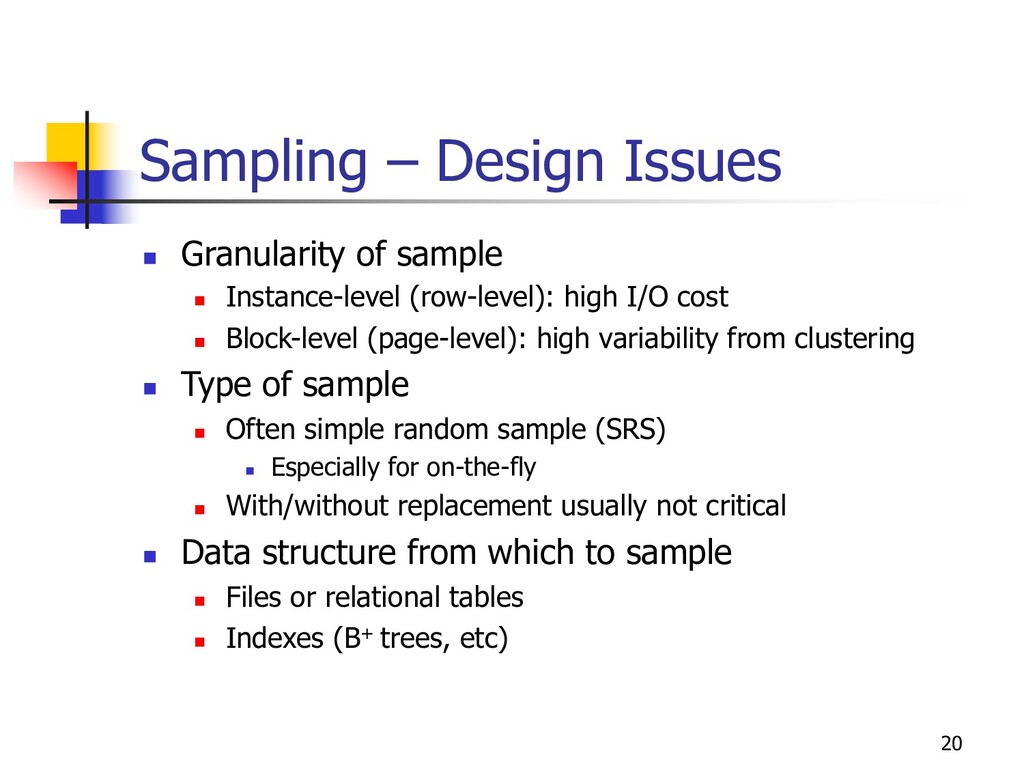
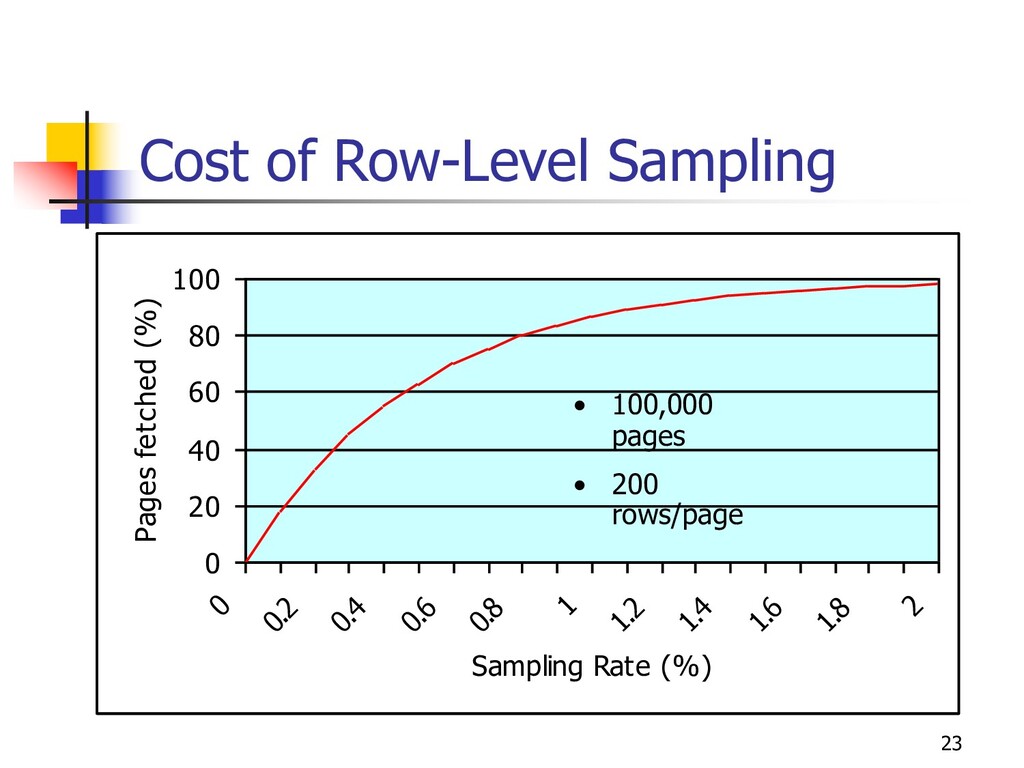
Instance-level (row-level): high I/O cost n Block-level (page-level): high variability from clustering n Type of sample n Often simple random sample (SRS) n Especially for on-the-fly n With/without replacement usually not critical n Data structure from which to sample n Files or relational tables n Indexes (B+ trees, etc)
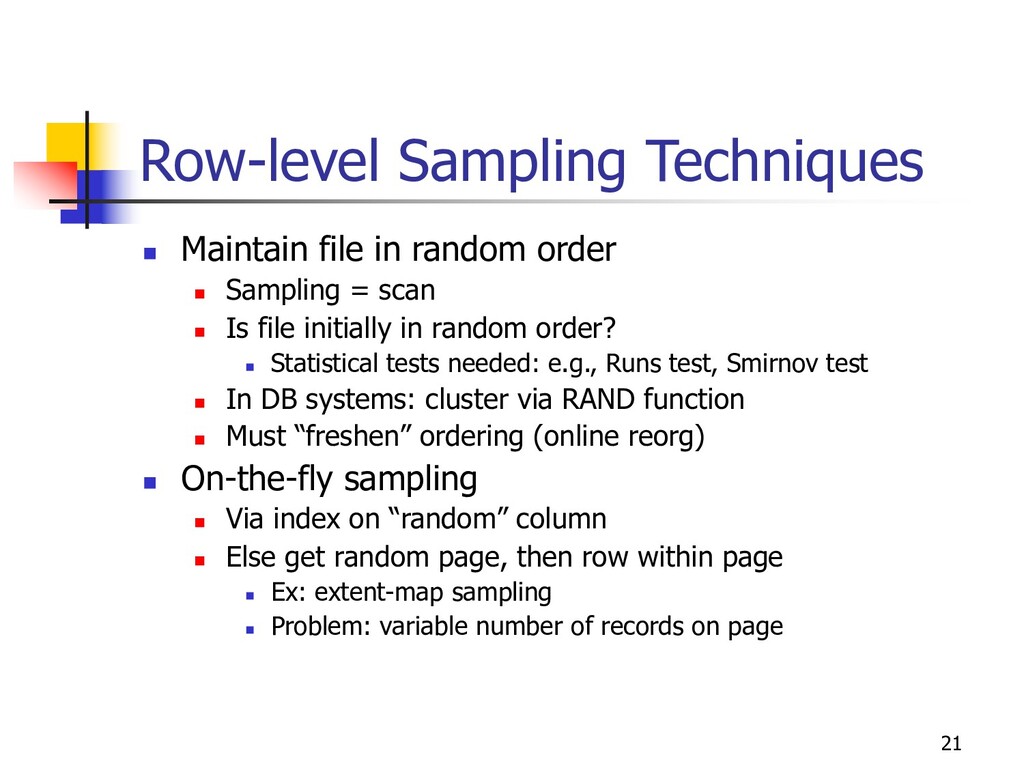
n Sampling = scan n Is file initially in random order? n Statistical tests needed: e.g., Runs test, Smirnov test n In DB systems: cluster via RAND function n Must “freshen” ordering (online reorg) n On-the-fly sampling n Via index on “random” column n Else get random page, then row within page n Ex: extent-map sampling n Problem: variable number of records on page
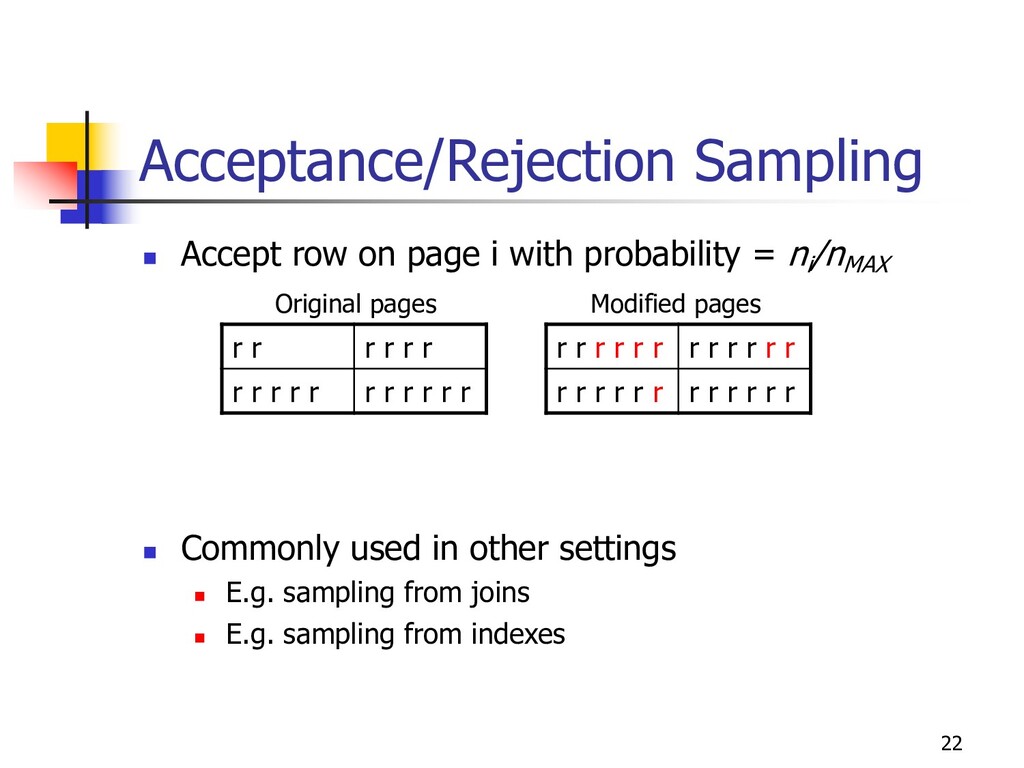
probability = ni /nMAX n Commonly used in other settings n E.g. sampling from joins n E.g. sampling from indexes r r r r r r r r r r r r r r r r r r r r r r r r r r r r r r r r r r r r r r r r r Original pages Modified pages
SQL: SELECT * WHERE RAND() <= 0.01 n Similar capability in SAS n Bernoulli Sampling with pre-specified rate n Informix, Oracle 8i, (DB2) n Ex: SELECT * FROM T1 SAMPLE ROW(10%), T2 n Ex: SELECT * FROM T1 SAMPLE BLOCK(10%), T2 n Not for novices n Need to pre-specify precision n no feedback/control n recall the “multiresolution” patterns from example n No estimators provided in current systems
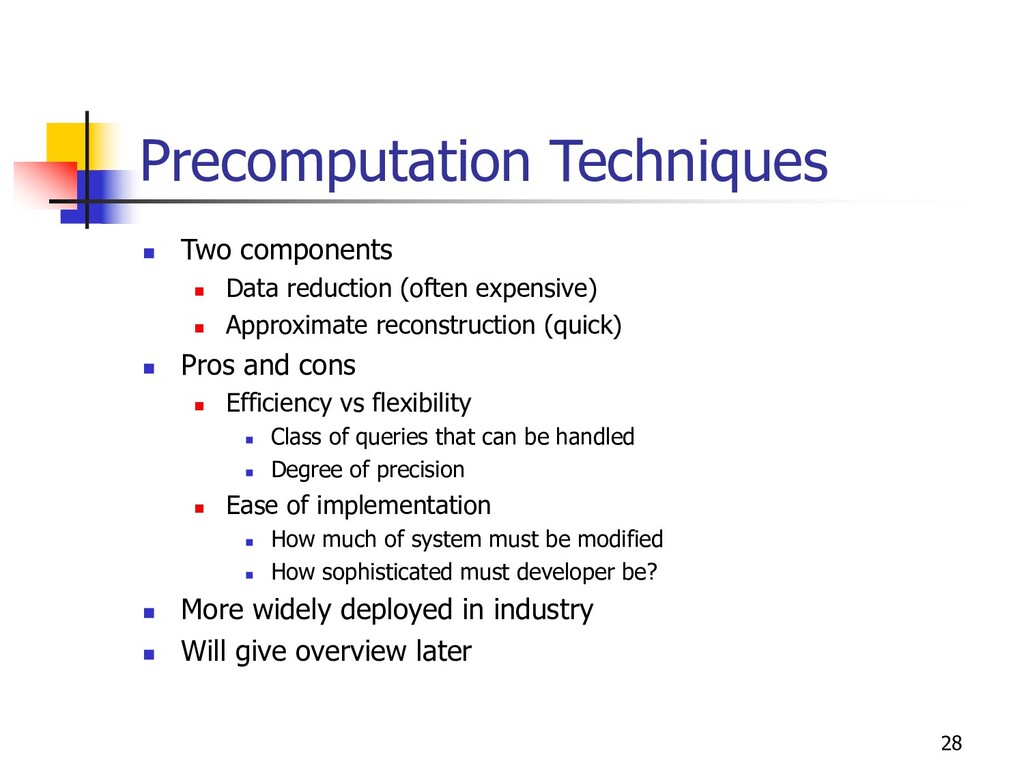
expensive) n Approximate reconstruction (quick) n Pros and cons n Efficiency vs flexibility n Class of queries that can be handled n Degree of precision n Ease of implementation n How much of system must be modified n How sophisticated must developer be? n More widely deployed in industry n Will give overview later
online techniques n Underlying technology n Building blocks: sampling, estimation n Preferential data delivery n Pipelined adaptive processing algorithms n Related technology: precomputation n Looking forward
n Spreadsheet scrollbars n Pipeline quasi-sort n Continuous re-optimization (eddies) n Index stride n High I/O costs, good for outliers n Online Reordering (“Juggle”) n Excellent in most cases, no index required n [VLDB ’99, VLDBJ ’00]
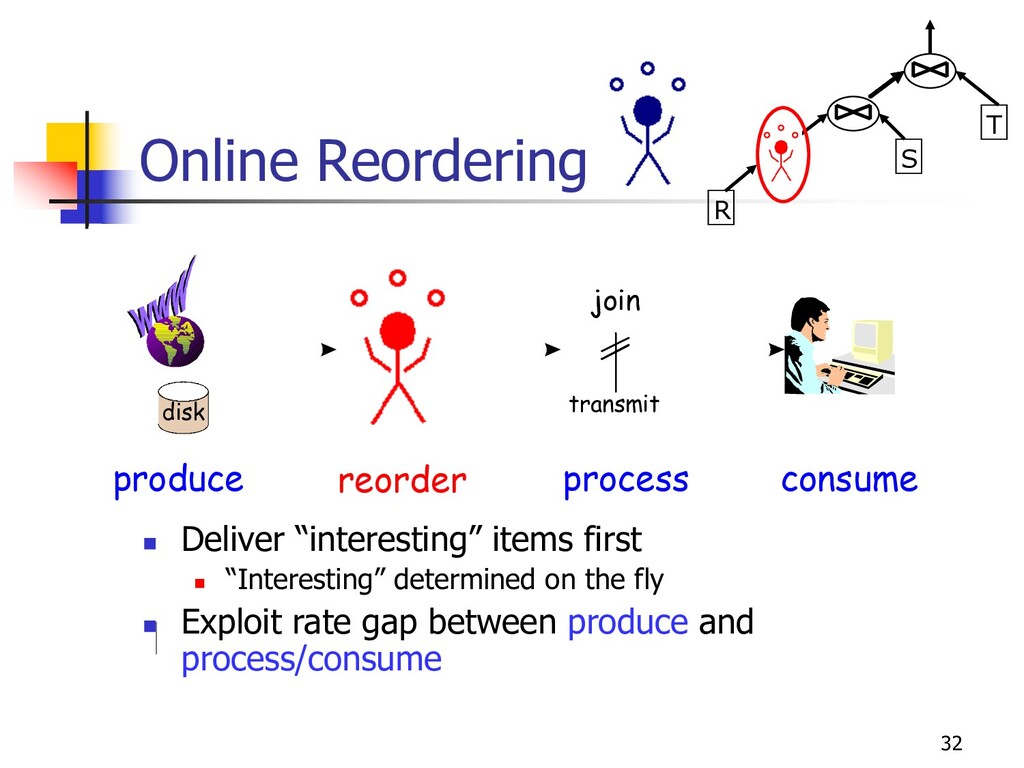
spool/enrich from auxiliary side disk n Juggle data between buffer and side disk n keep buffer full of “interesting” items n getNext chooses best item currently on buffer n getNext, enrich/spool decisions -- based on reordering policy n Side disk management n hash index, populated in a way that postpones random I/O n play both sides of sort/hash duality buffer spool prefetch enrich getNext side disk produce process/consume
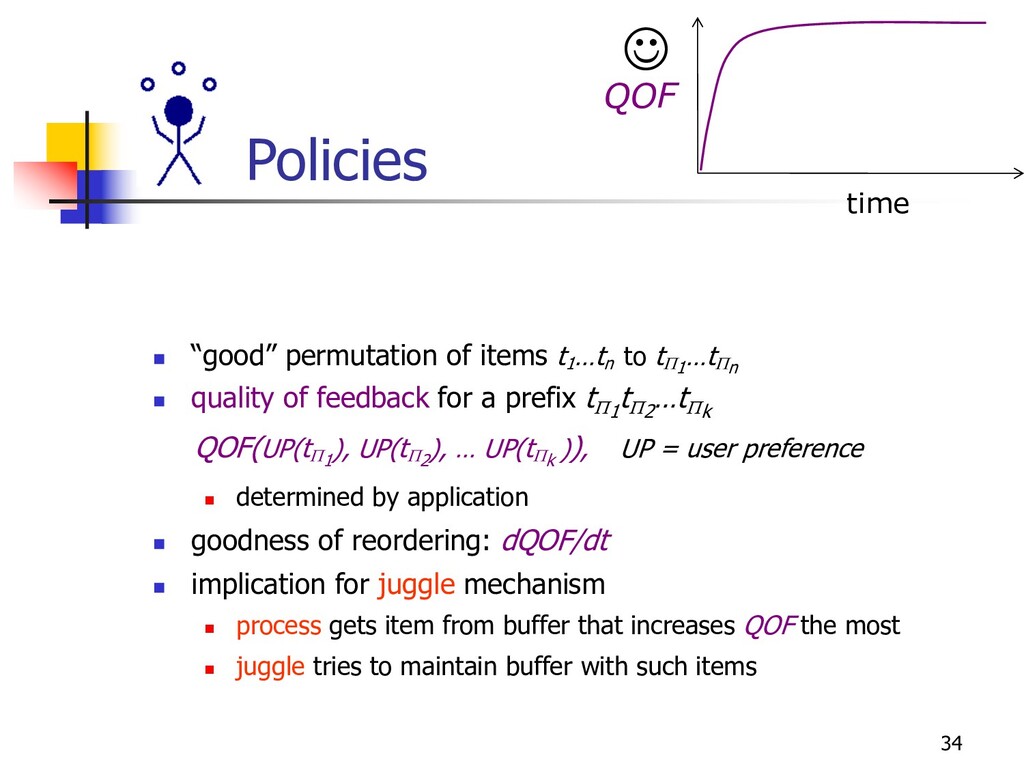
tP1 …tPn n quality of feedback for a prefix tP1 tP2 …tPk QOF(UP(tP1 ), UP(tP2 ), … UP(tPk )), UP = user preference n determined by application n goodness of reordering: dQOF/dt n implication for juggle mechanism n process gets item from buffer that increases QOF the most n juggle tries to maintain buffer with such items time QOF J
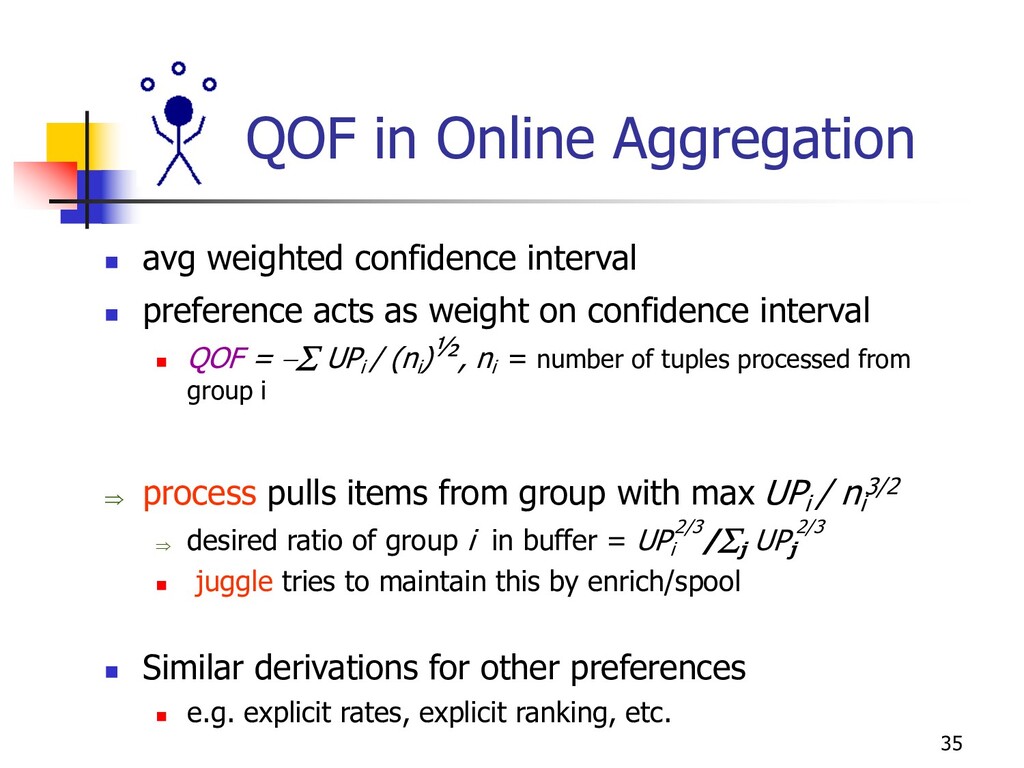
n preference acts as weight on confidence interval n QOF = -å UPi / (ni )½, ni = number of tuples processed from group i Þ process pulls items from group with max UPi / ni 3/2 Þ desired ratio of group i in buffer = UPi 2/3/åj UPj 2/3 n juggle tries to maintain this by enrich/spool n Similar derivations for other preferences n e.g. explicit rates, explicit ranking, etc.
online techniques n Underlying technology n Building blocks: sampling, estimation, pre-computation n Preferential data delivery n Pipelined adaptive processing algorithms n Related work n Looking forward
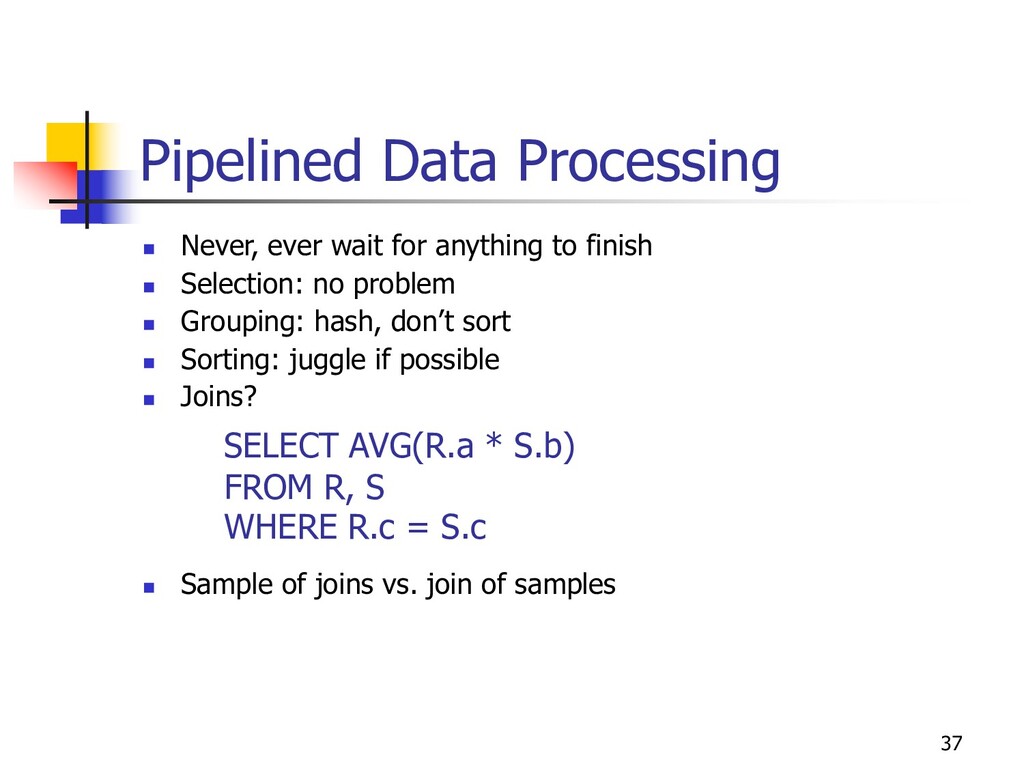
to finish n Selection: no problem n Grouping: hash, don’t sort n Sorting: juggle if possible n Joins? n Sample of joins vs. join of samples SELECT AVG(R.a * S.b) FROM R, S WHERE R.c = S.c
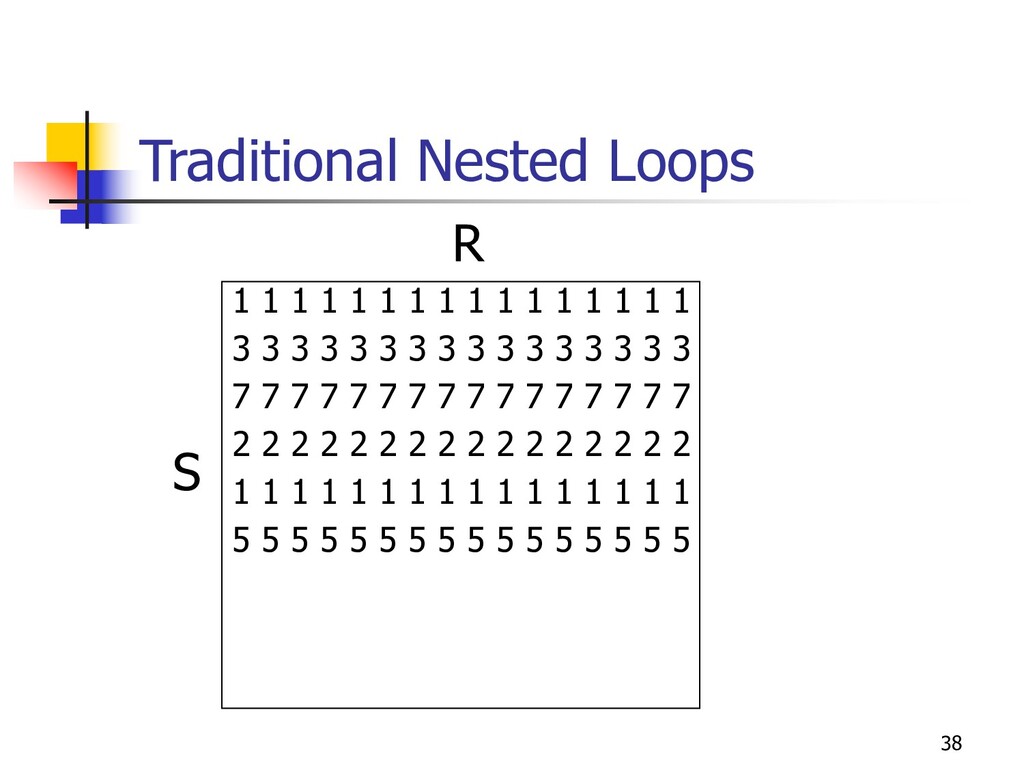
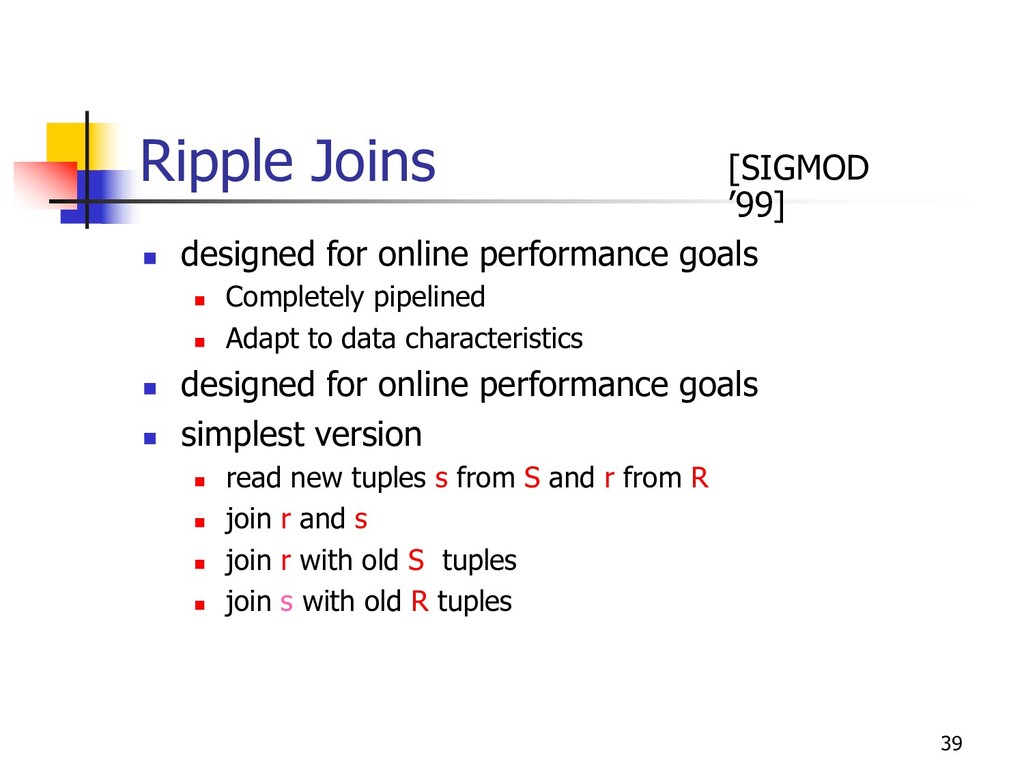
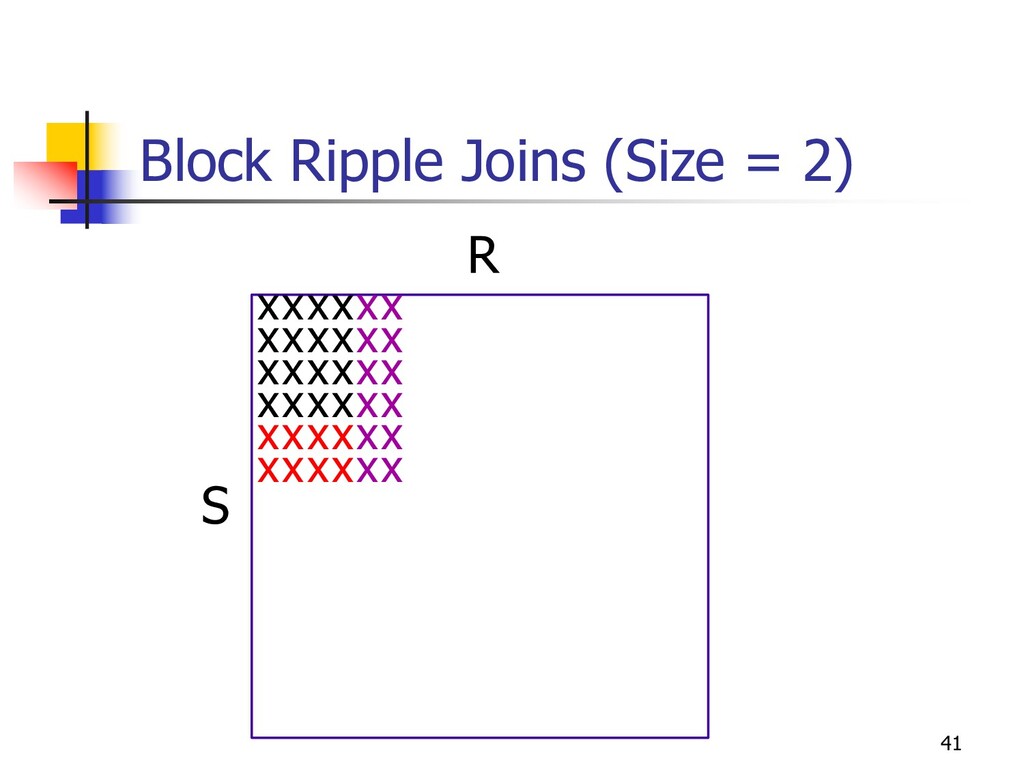
Completely pipelined n Adapt to data characteristics n designed for online performance goals n simplest version n read new tuples s from S and r from R n join r and s n join r with old S tuples n join s with old R tuples [SIGMOD ’99]
in alternating nested loops n Index: coincides with index-nested loop n Hash: symmetric hash tables n Adaptive aspect ratio n User sets animation rate (via slider) n System goal: n minimize CI length n Subject to time constraint n System solves optimization problem (approximately) n Samples from higher-variance relation faster
n Ongoing work on scalability issues n Memory compaction technique n Parallelism n Graceful degradation to out-of-core hashing n a la Tukwila, XJoin, but sensitive to statistical issues n Nested queries n Optimization issues n A number of API and other systems issues n DMKD journal paper on Informix implementation n Forthcoming paper on sampling in DB2
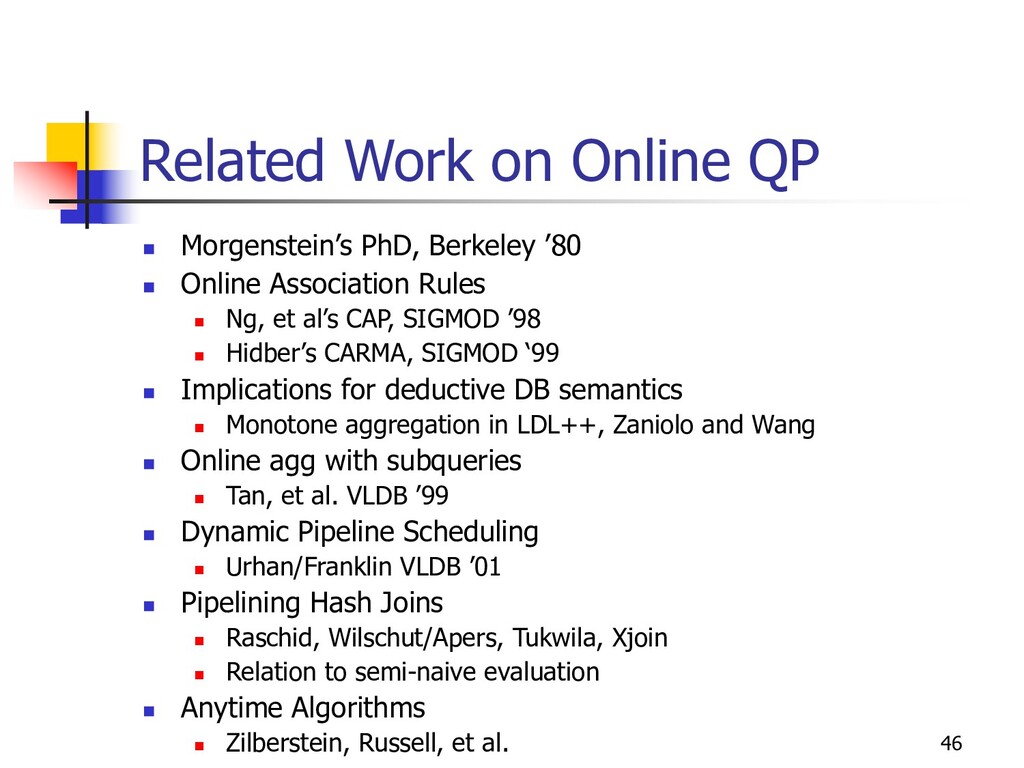
’80 n Online Association Rules n Ng, et al’s CAP, SIGMOD ’98 n Hidber’s CARMA, SIGMOD ‘99 n Implications for deductive DB semantics n Monotone aggregation in LDL++, Zaniolo and Wang n Online agg with subqueries n Tan, et al. VLDB ’99 n Dynamic Pipeline Scheduling n Urhan/Franklin VLDB ’01 n Pipelining Hash Joins n Raschid, Wilschut/Apers, Tukwila, Xjoin n Relation to semi-naive evaluation n Anytime Algorithms n Zilberstein, Russell, et al.
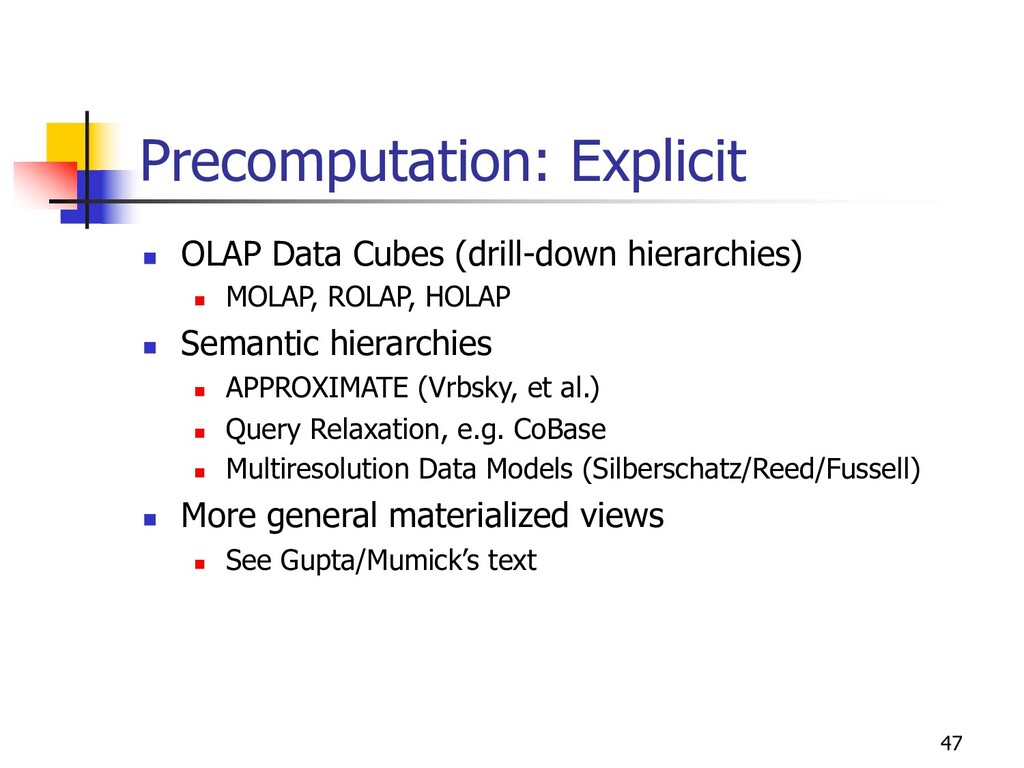
MOLAP, ROLAP, HOLAP n Semantic hierarchies n APPROXIMATE (Vrbsky, et al.) n Query Relaxation, e.g. CoBase n Multiresolution Data Models (Silberschatz/Reed/Fussell) n More general materialized views n See Gupta/Mumick’s text
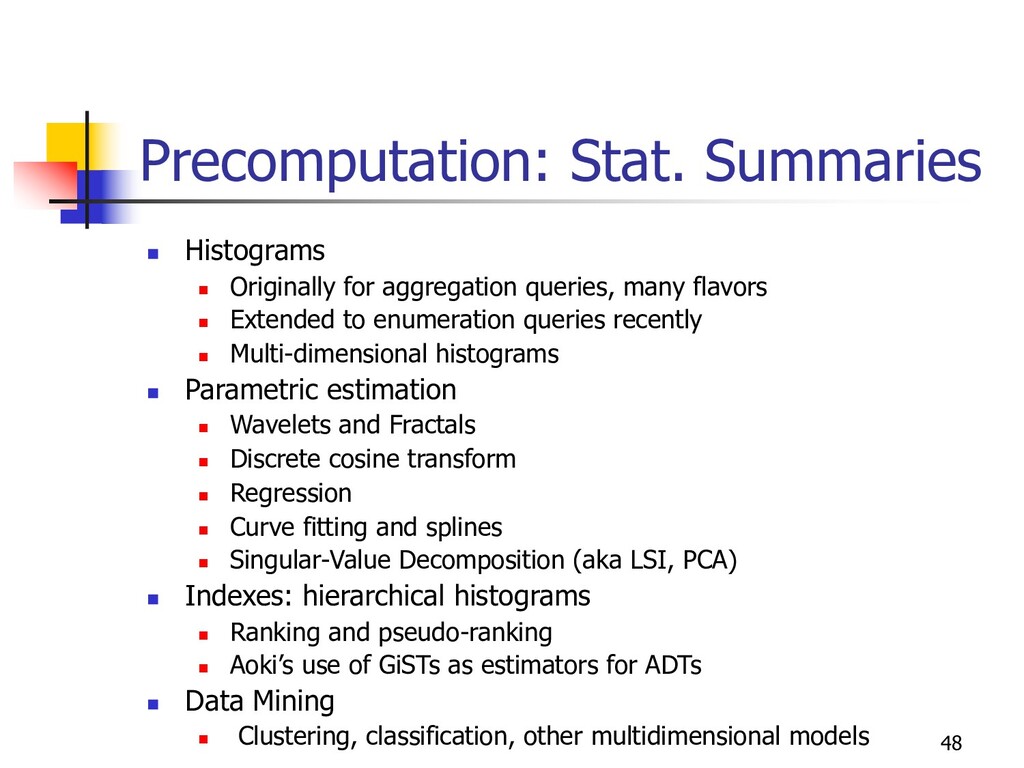
queries, many flavors n Extended to enumeration queries recently n Multi-dimensional histograms n Parametric estimation n Wavelets and Fractals n Discrete cosine transform n Regression n Curve fitting and splines n Singular-Value Decomposition (aka LSI, PCA) n Indexes: hierarchical histograms n Ranking and pseudo-ranking n Aoki’s use of GiSTs as estimators for ADTs n Data Mining n Clustering, classification, other multidimensional models
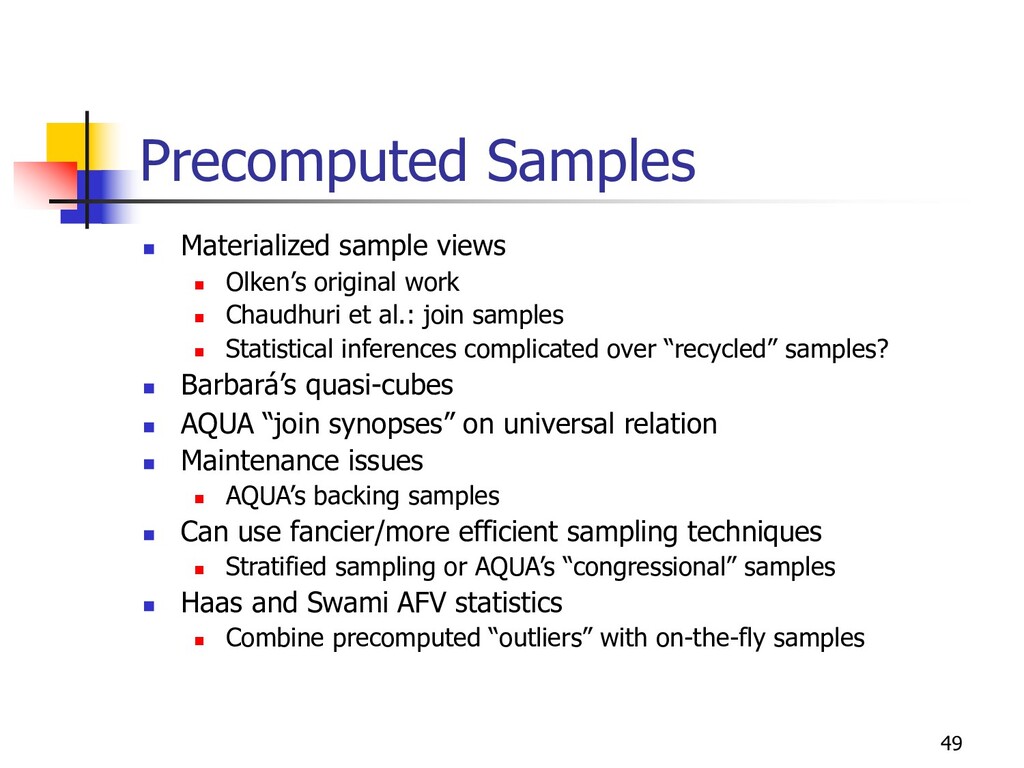
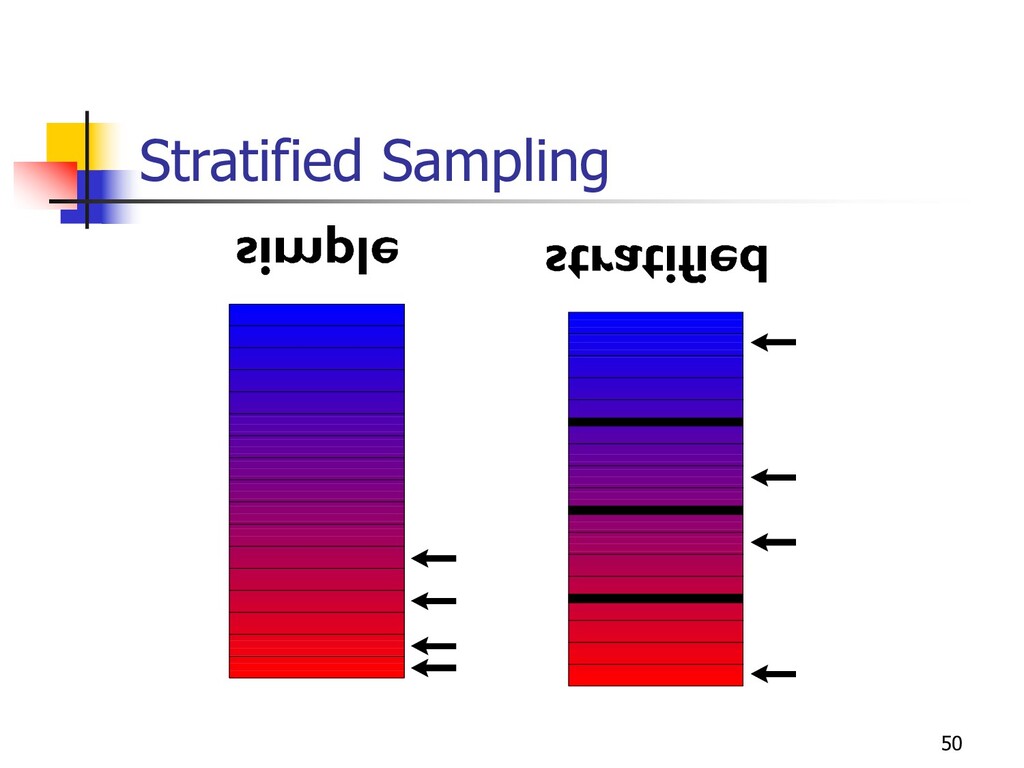
work n Chaudhuri et al.: join samples n Statistical inferences complicated over “recycled” samples? n Barbará’s quasi-cubes n AQUA “join synopses” on universal relation n Maintenance issues n AQUA’s backing samples n Can use fancier/more efficient sampling techniques n Stratified sampling or AQUA’s “congressional” samples n Haas and Swami AFV statistics n Combine precomputed “outliers” with on-the-fly samples
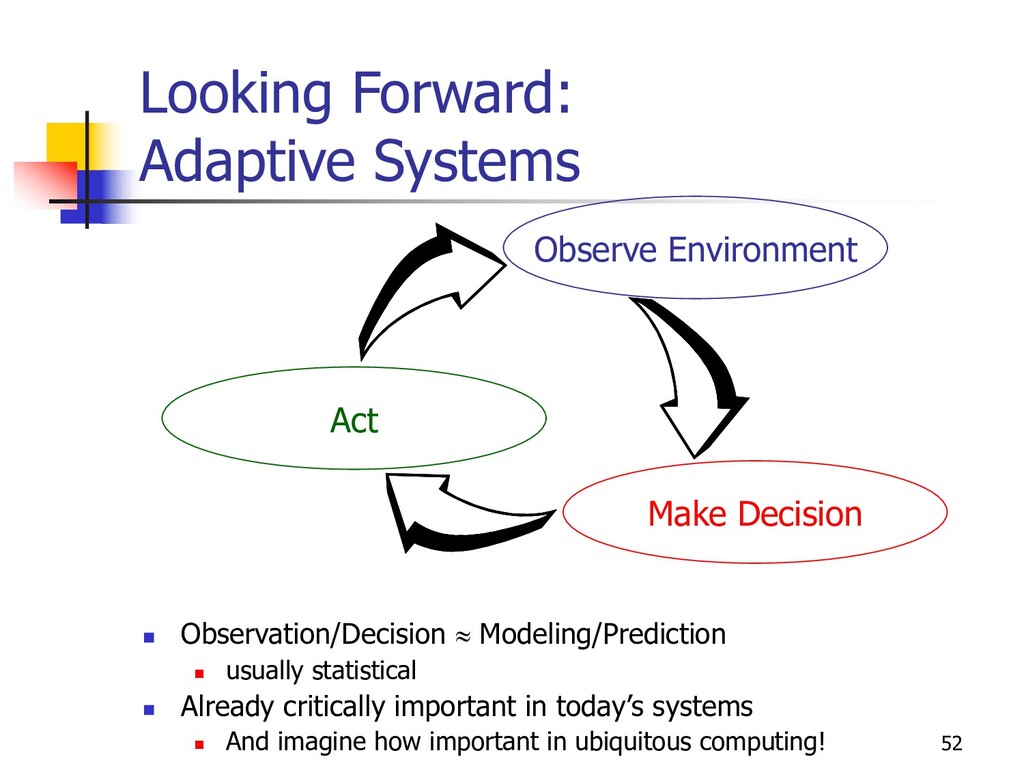
usually statistical n Already critically important in today’s systems n And imagine how important in ubiquitous computing! Observe Environment Make Decision Act
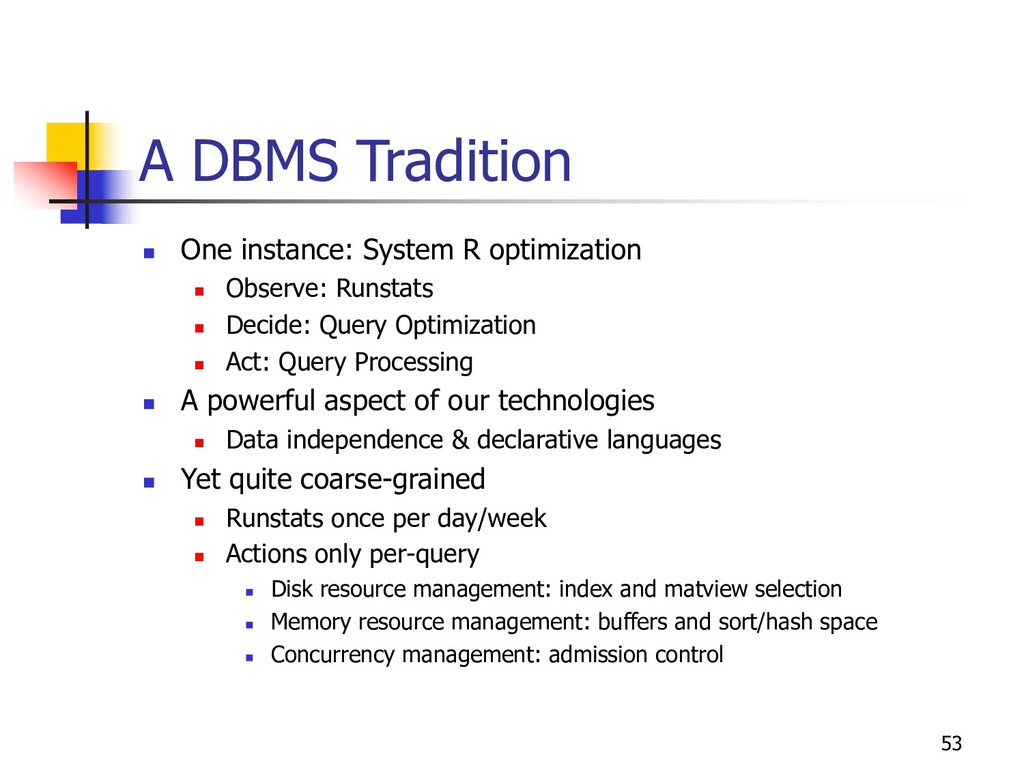
n Observe: Runstats n Decide: Query Optimization n Act: Query Processing n A powerful aspect of our technologies n Data independence & declarative languages n Yet quite coarse-grained n Runstats once per day/week n Actions only per-query n Disk resource management: index and matview selection n Memory resource management: buffers and sort/hash space n Concurrency management: admission control
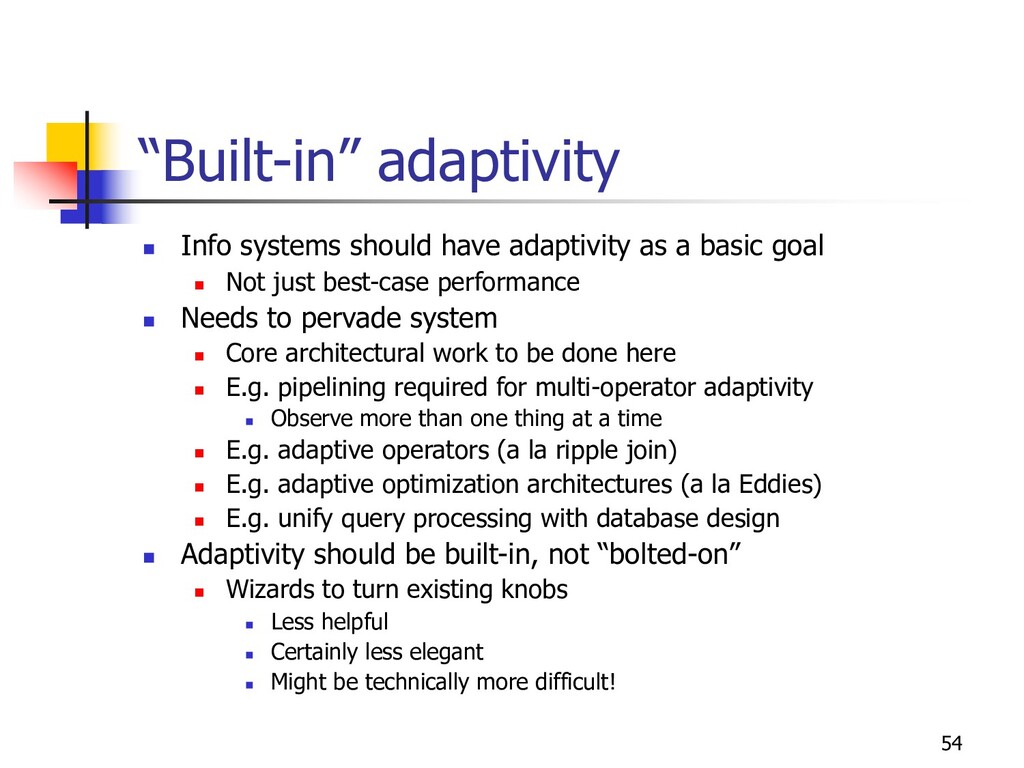
a basic goal n Not just best-case performance n Needs to pervade system n Core architectural work to be done here n E.g. pipelining required for multi-operator adaptivity n Observe more than one thing at a time n E.g. adaptive operators (a la ripple join) n E.g. adaptive optimization architectures (a la Eddies) n E.g. unify query processing with database design n Adaptivity should be built-in, not “bolted-on” n Wizards to turn existing knobs n Less helpful n Certainly less elegant n Might be technically more difficult!
work in DB Directions Workshops n UI’s perceived as “soft”, hard to measure/publish n Yet people use our systems n And arguably we are trying to make them better for people n Problem: our performance metrics n “Mirth index” vs. wall-clock time n One can find reasonable “hard” metrics for mirth n Many of these metrics may be statistical n Also consider “woe index”, e.g. in maintainability n Most of these indices have to do with user time n Not, e.g., resource utilization n Good UI work need not require good UIs! n Can attack new metrics directly n We don’t have to go back to art school
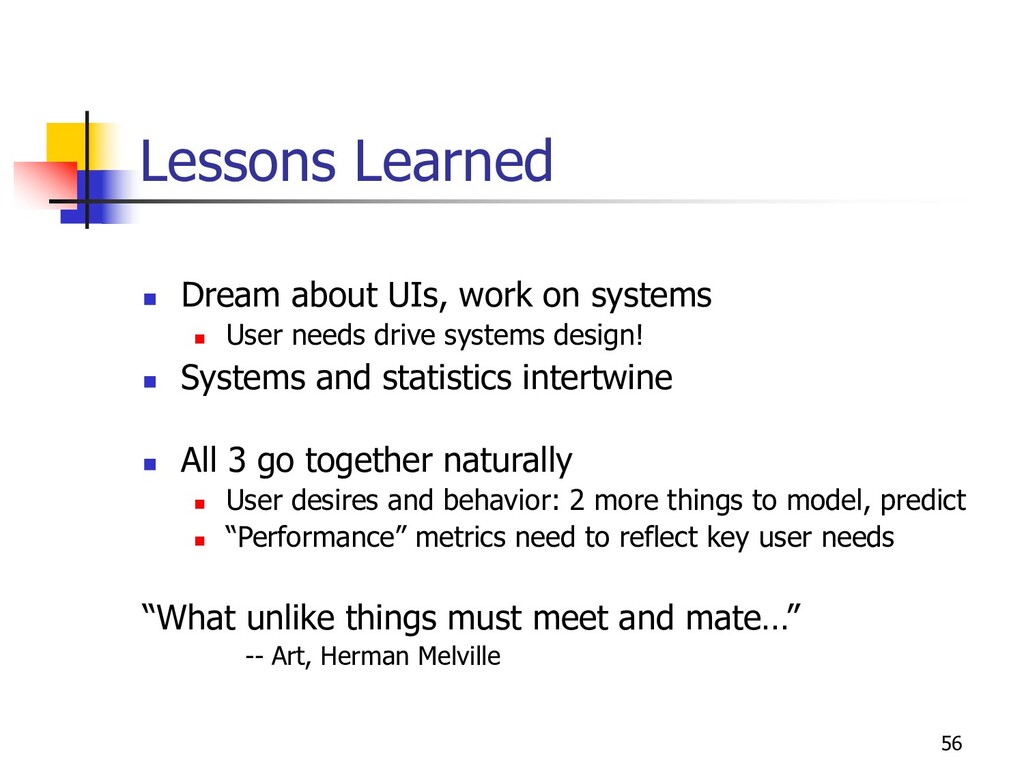
n User needs drive systems design! n Systems and statistics intertwine n All 3 go together naturally n User desires and behavior: 2 more things to model, predict n “Performance” metrics need to reflect key user needs “What unlike things must meet and mate…” -- Art, Herman Melville
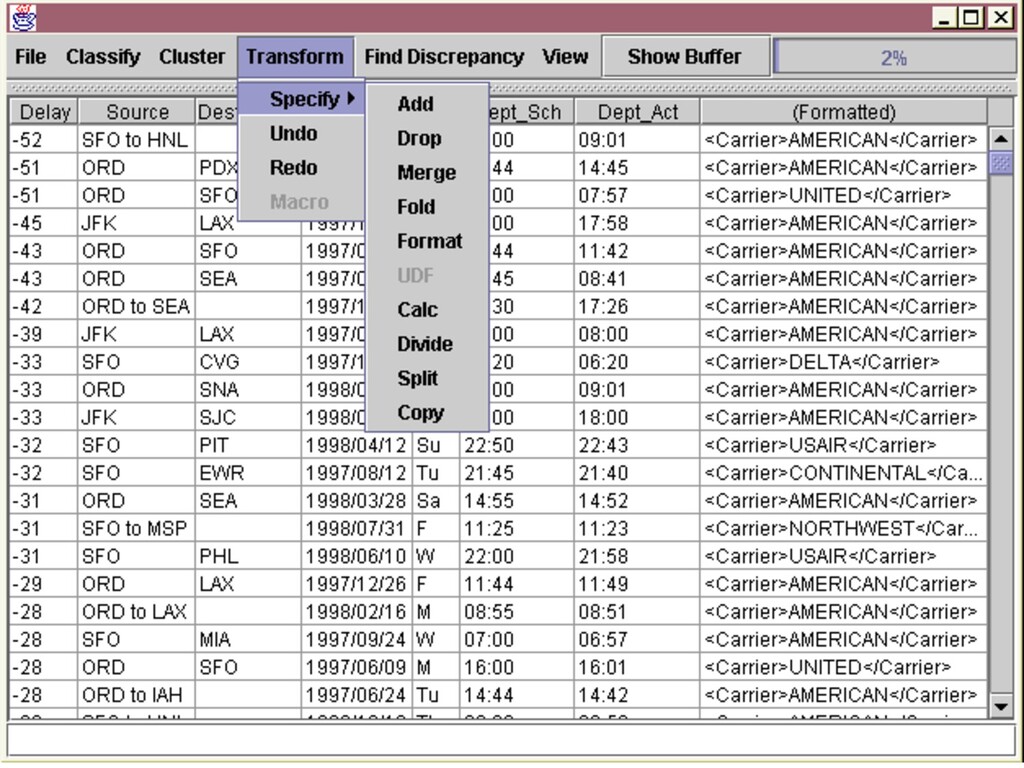
![15 Online Enumeration n Potter’s Wheel [VLDB 2001] n Scalable](https://files.speakerdeck.com/presentations/a38a454a9c6542599614d40db5d2b525/slide_14.jpg)