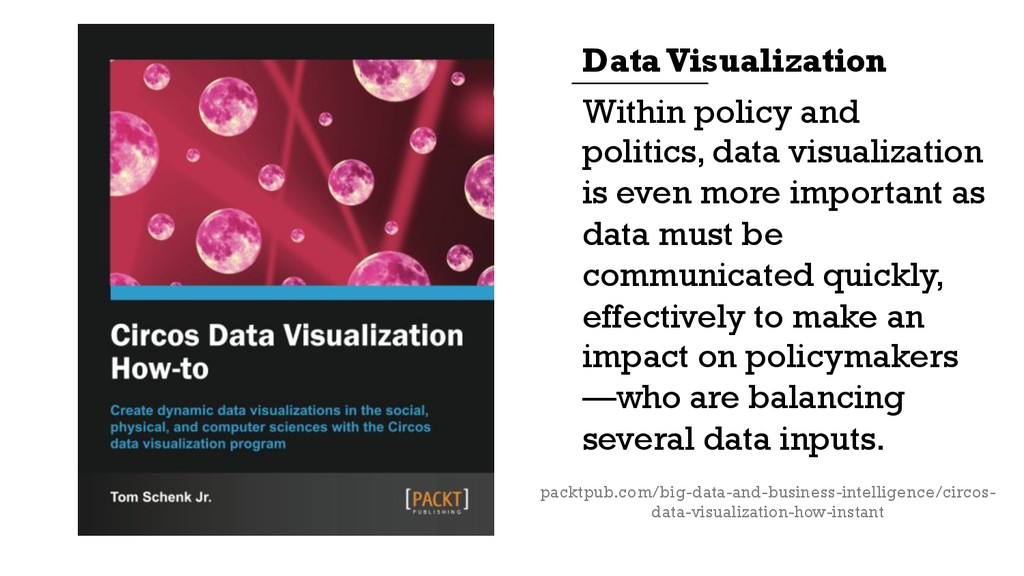
as data must be communicated quickly, effectively to make an impact on policymakers —who are balancing several data inputs. Data Visualization packtpub.com/big-data-and-business-intelligence/circos- data-visualization-how-instant
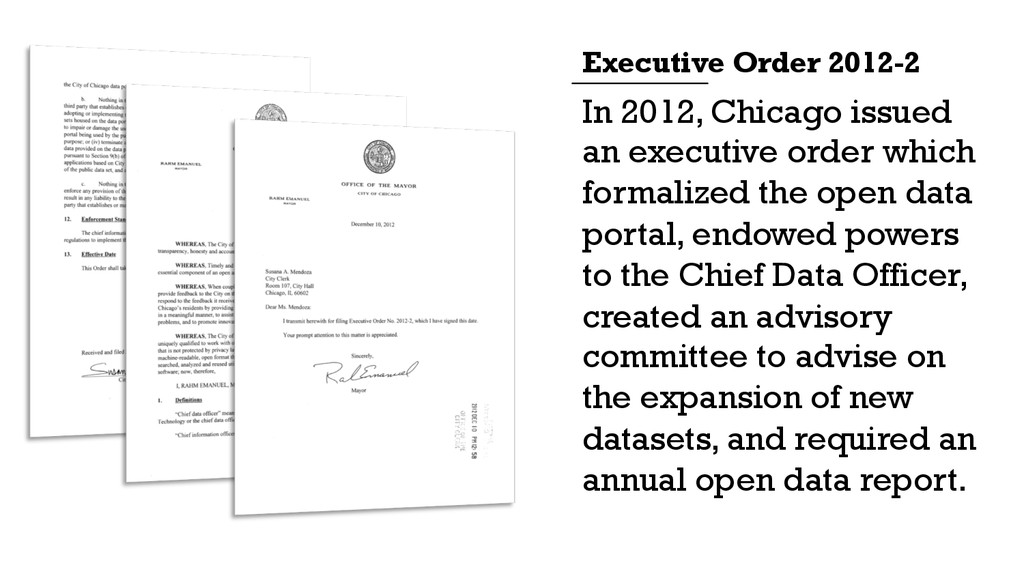
open data portal, endowed powers to the Chief Data Officer, created an advisory committee to advise on the expansion of new datasets, and required an annual open data report. Executive Order 2012-2
to increase and improve the quality of City data available internally and externally, and facilitate methods for analyzing that data to help create a smarter and more efficient city.
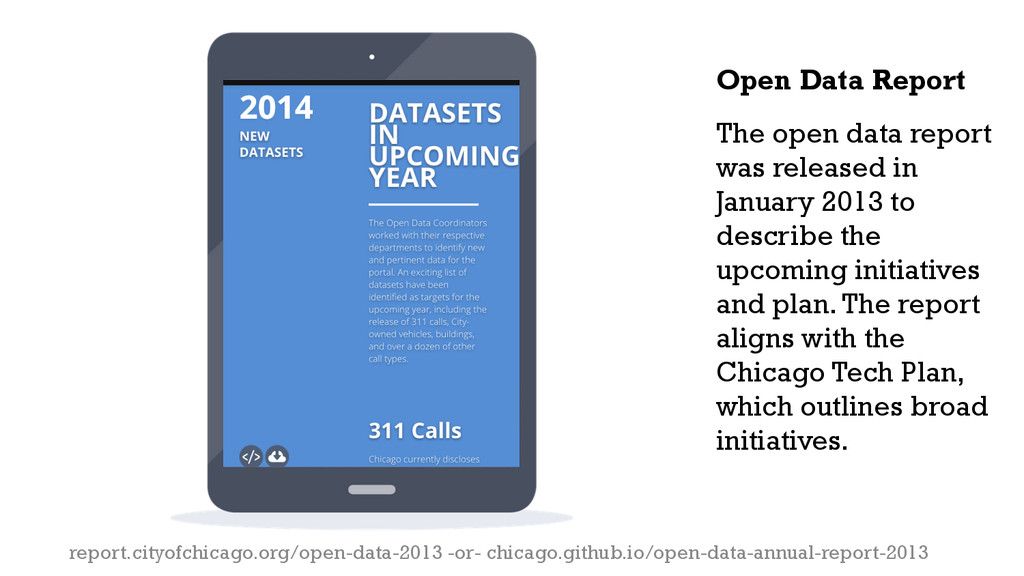
describe the upcoming initiatives and plan. The report aligns with the Chicago Tech Plan, which outlines broad initiatives. Open Data Report report.cityofchicago.org/open-data-2013 -or- chicago.github.io/open-data-annual-report-2013
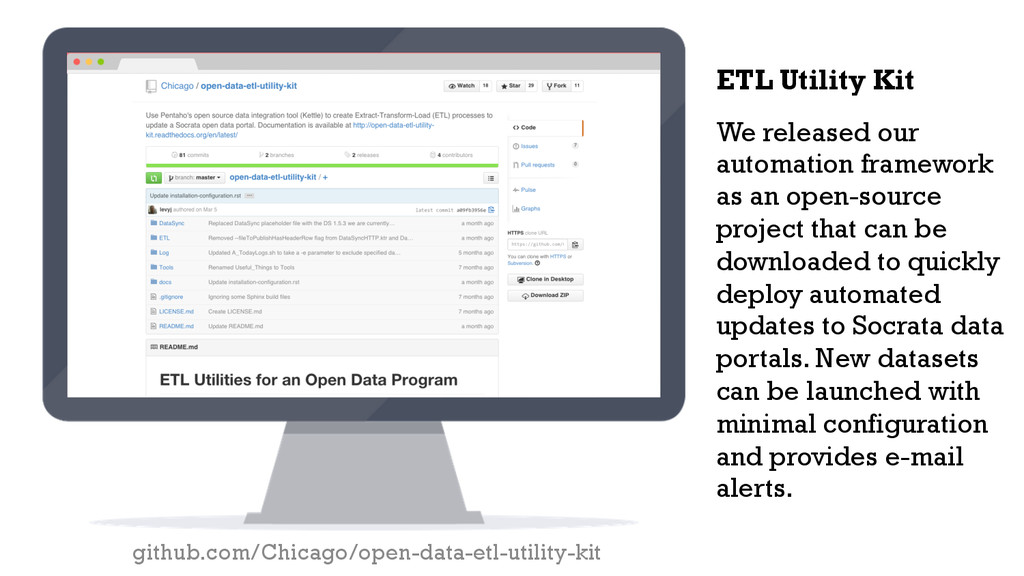
can be downloaded to quickly deploy automated updates to Socrata data portals. New datasets can be launched with minimal configuration and provides e-mail alerts. ETL Utility Kit github.com/Chicago/open-data-etl-utility-kit
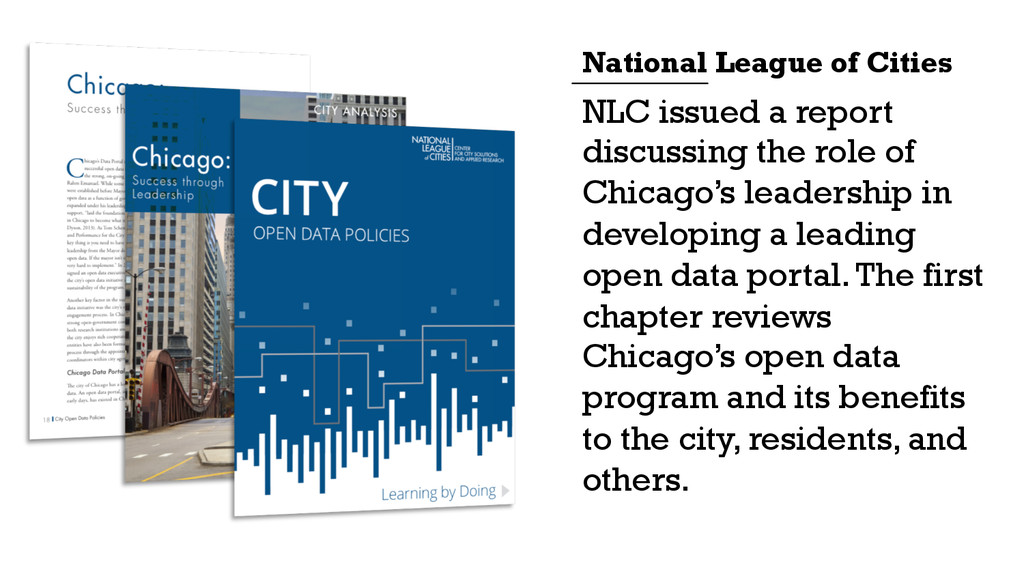
in developing a leading open data portal. The first chapter reviews Chicago’s open data program and its benefits to the city, residents, and others. National League of Cities
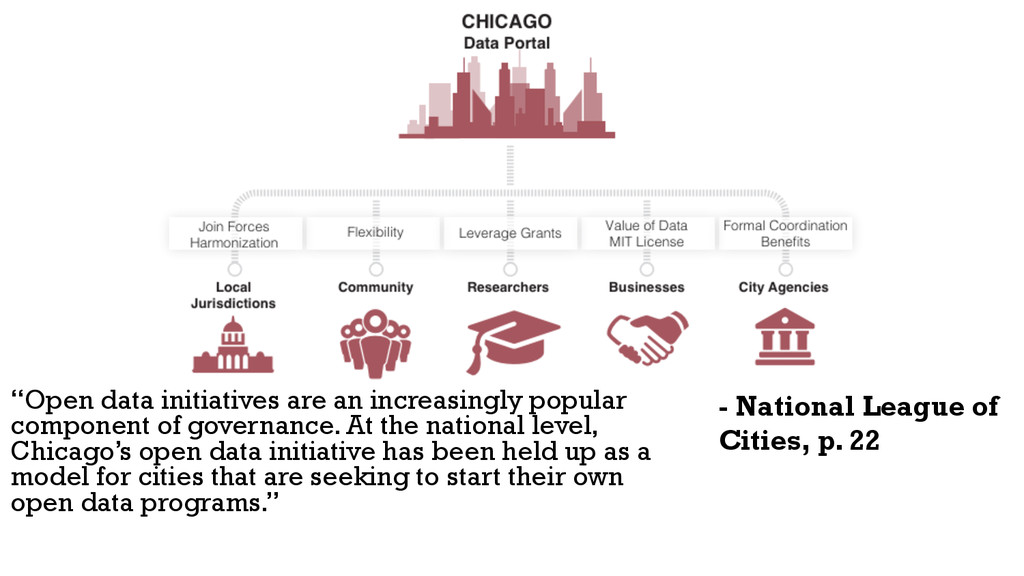
At the national level, Chicago’s open data initiative has been held up as a model for cities that are seeking to start their own open data programs.” - National League of Cities, p. 22
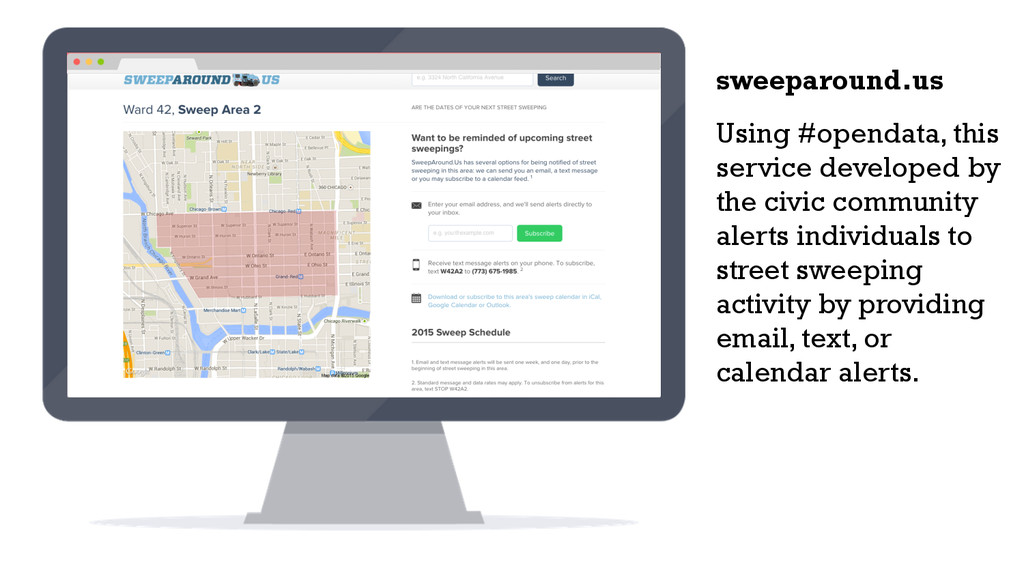
led by Chicago residents interested in technology and society. Smart Chicago Collaborative and non-profits provide assistance and city officials regularly engage in meetups and other activities. This group has produced several helpful apps. Community
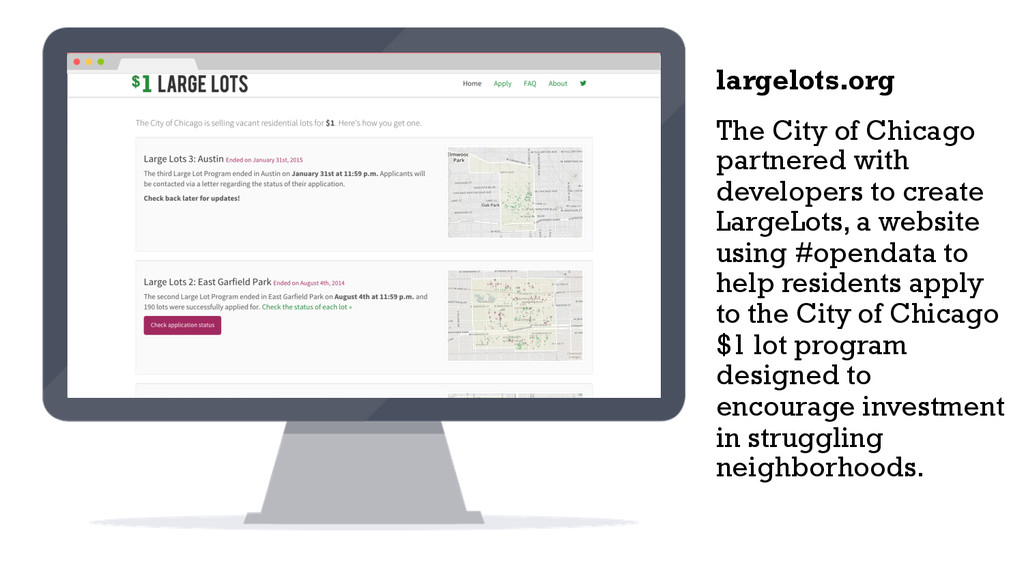
a website using #opendata to help residents apply to the City of Chicago $1 lot program designed to encourage investment in struggling neighborhoods. largelots.org
across Chicago during the fall and winter months. This provides an easy-to- use central website built upon open data by a volunteer. chicagoflushots.org
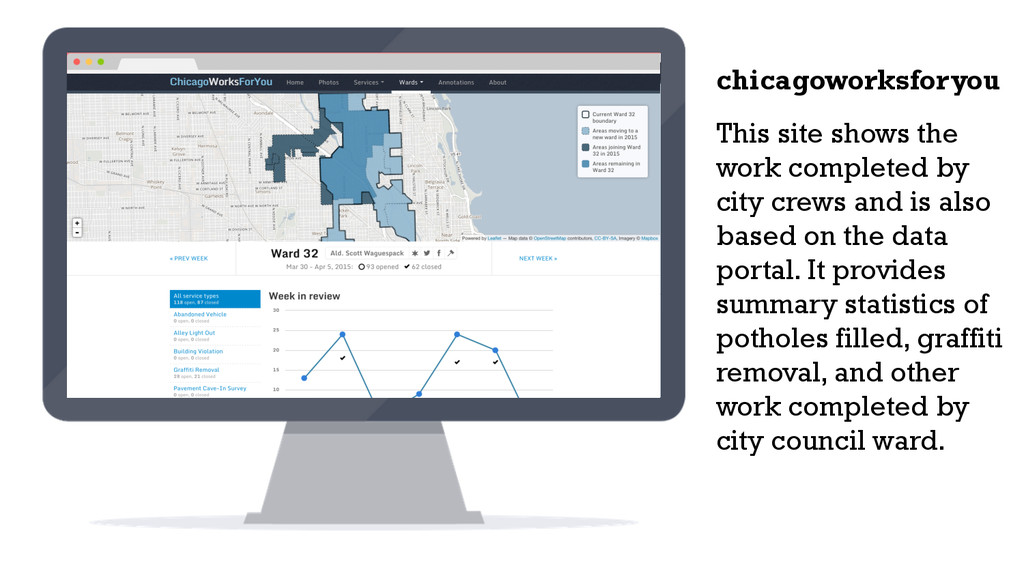
is also based on the data portal. It provides summary statistics of potholes filled, graffiti removal, and other work completed by city council ward. chicagoworksforyou
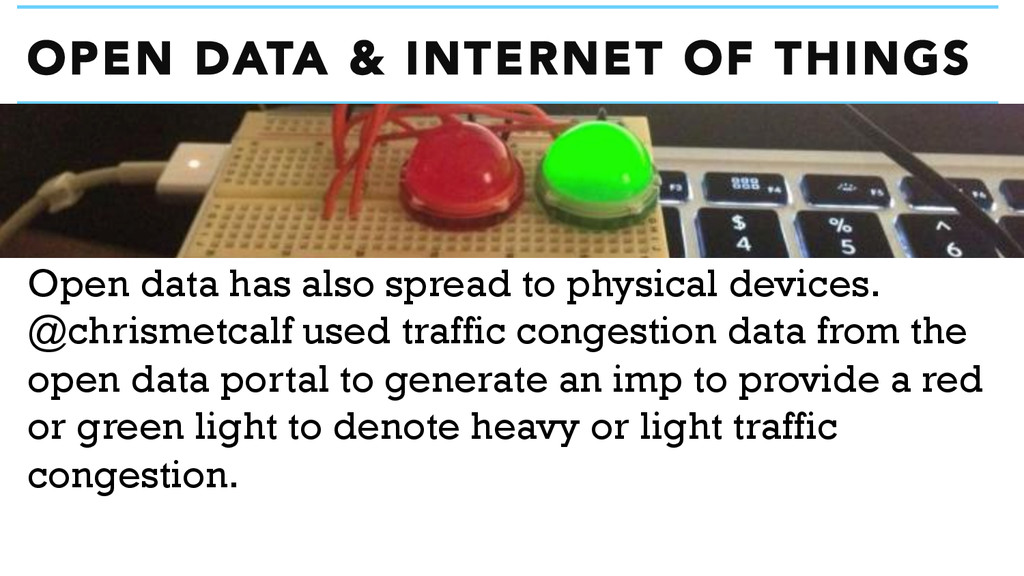
spread to physical devices. @chrismetcalf used traffic congestion data from the open data portal to generate an imp to provide a red or green light to denote heavy or light traffic congestion.
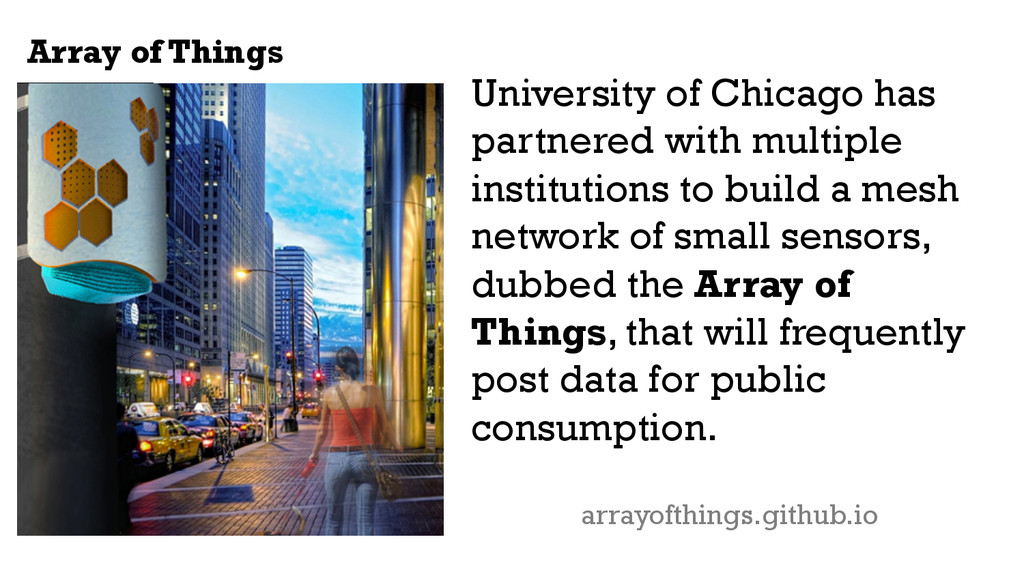
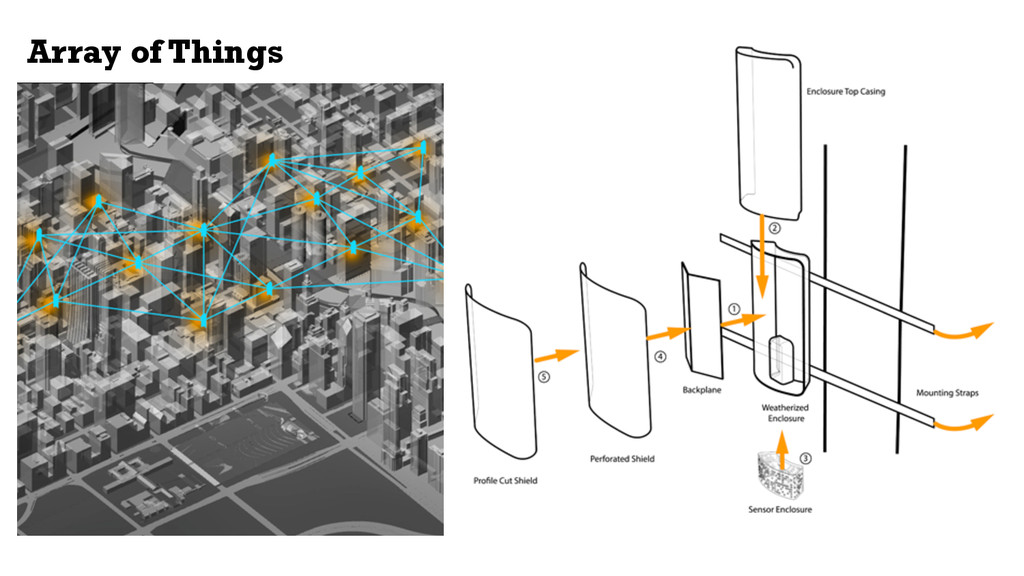
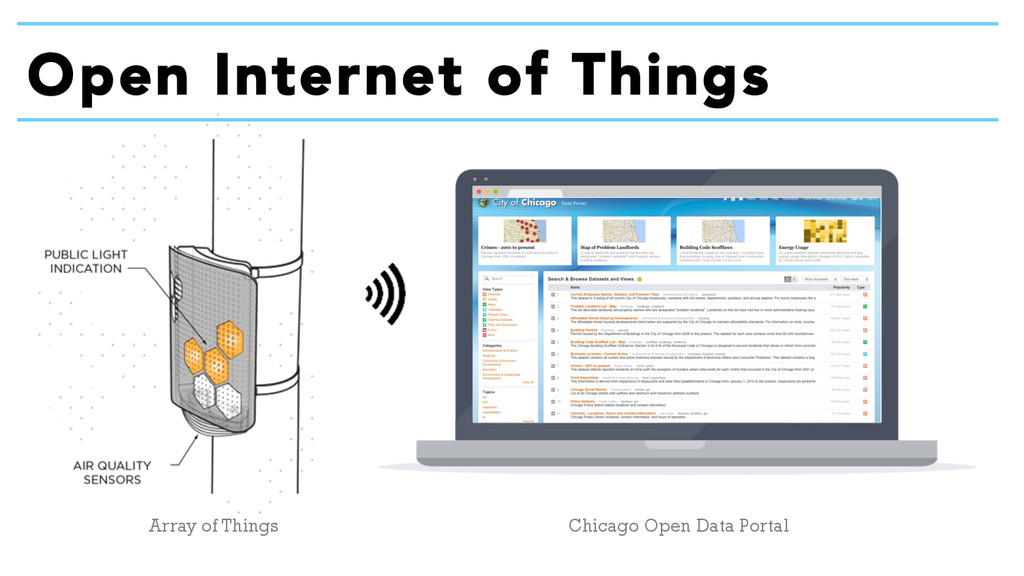
institutions to build a mesh network of small sensors, dubbed the Array of Things, that will frequently post data for public consumption. arrayofthings.github.io
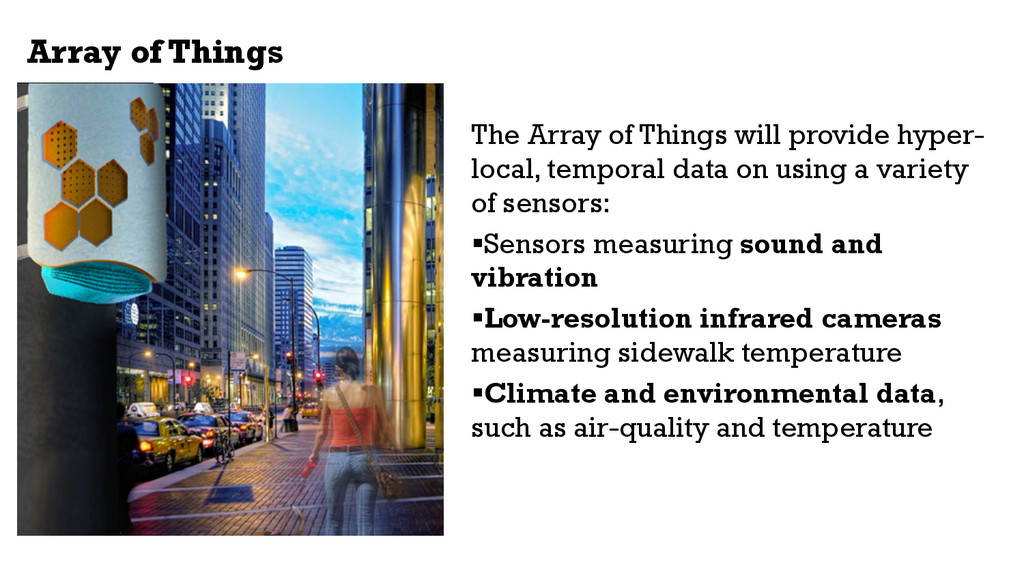
local, temporal data on using a variety of sensors: ! Sensors measuring sound and vibration ! Low-resolution infrared cameras measuring sidewalk temperature ! Climate and environmental data, such as air-quality and temperature
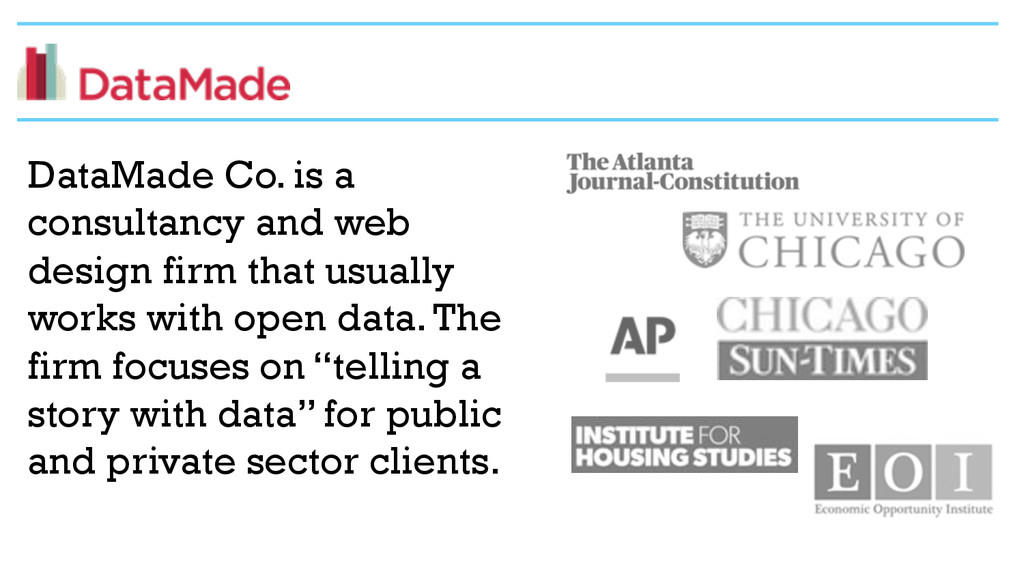
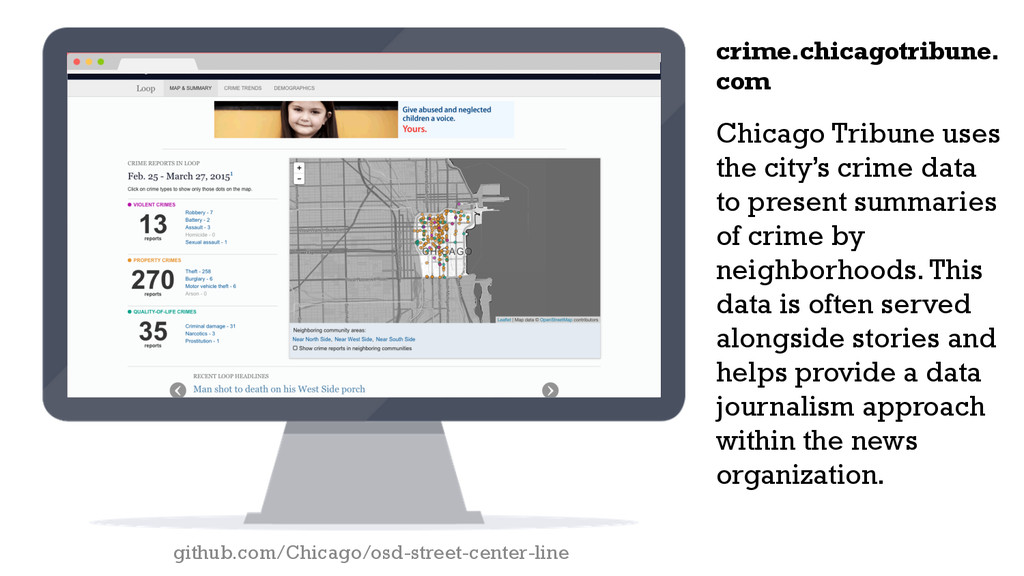
of crime by neighborhoods. This data is often served alongside stories and helps provide a data journalism approach within the news organization. crime.chicagotribune. com github.com/Chicago/osd-street-center-line
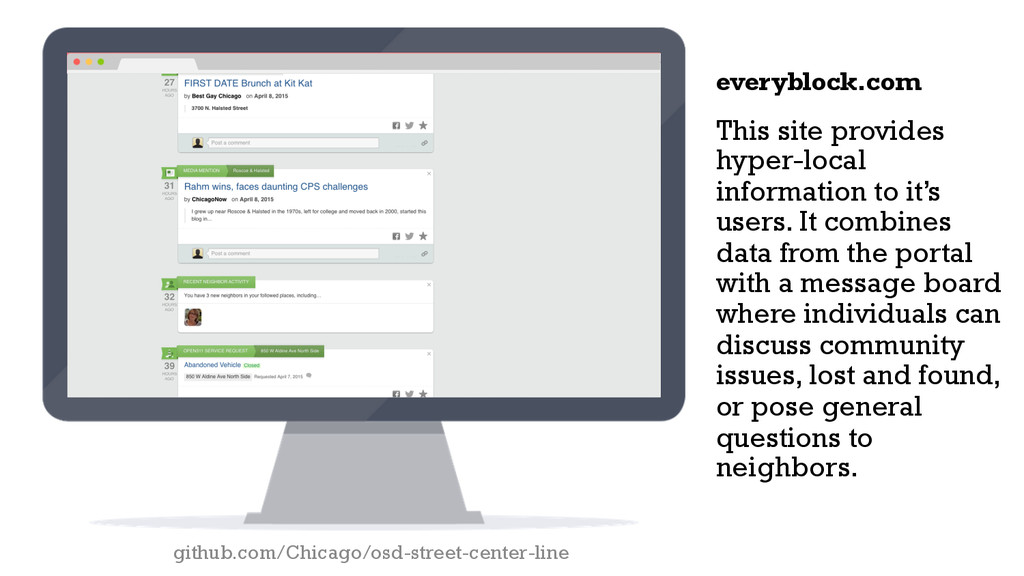
data from the portal with a message board where individuals can discuss community issues, lost and found, or pose general questions to neighbors. everyblock.com github.com/Chicago/osd-street-center-line
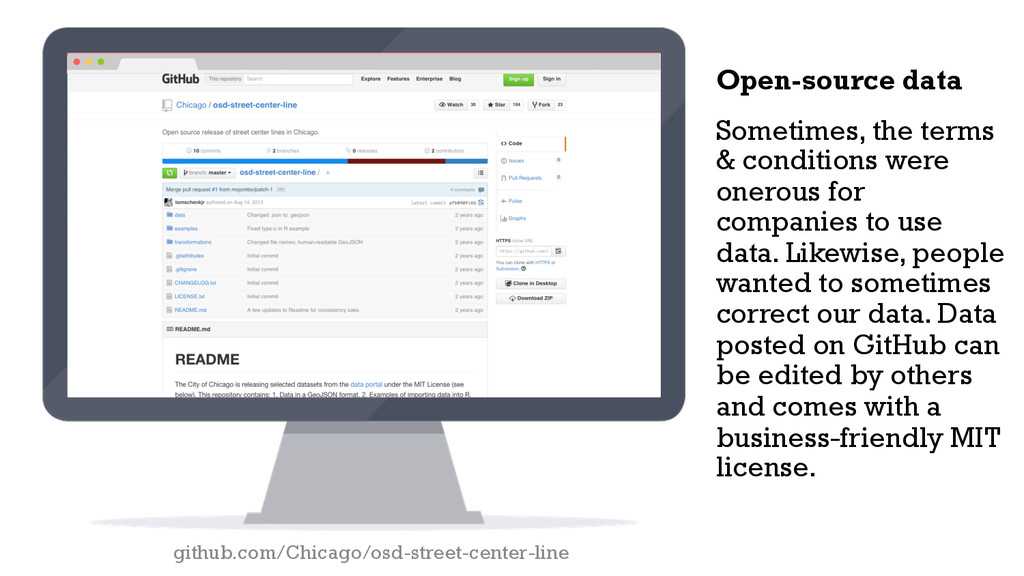
use data. Likewise, people wanted to sometimes correct our data. Data posted on GitHub can be edited by others and comes with a business-friendly MIT license. Open-source data github.com/Chicago/osd-street-center-line
universities and groups willing to engage in projects with the city. We can leverage open data portal and data itself to create cooperative relationships. Researchers
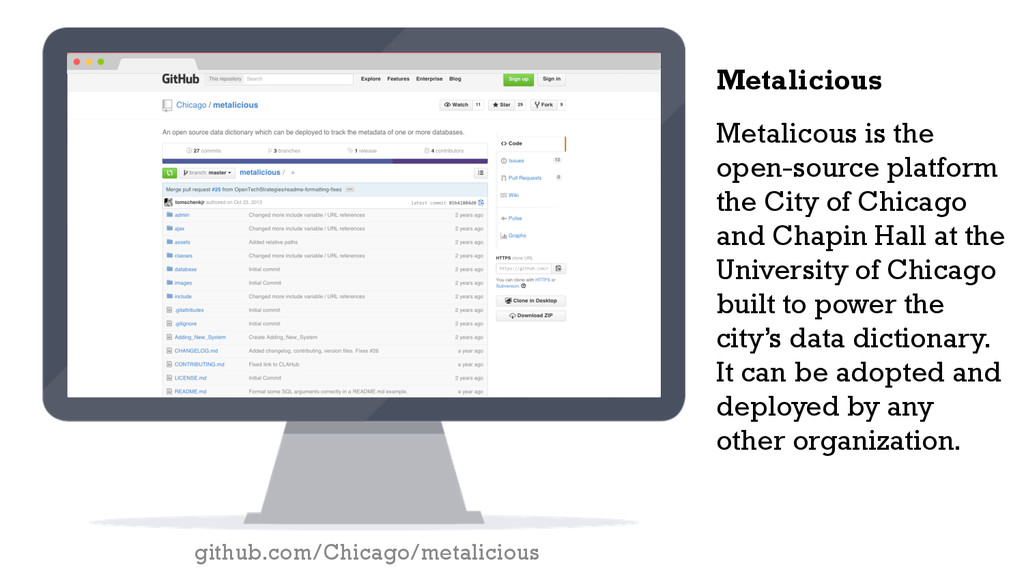
Chapin Hall at the University of Chicago built to power the city’s data dictionary. It can be adopted and deployed by any other organization. Metalicious github.com/Chicago/metalicious
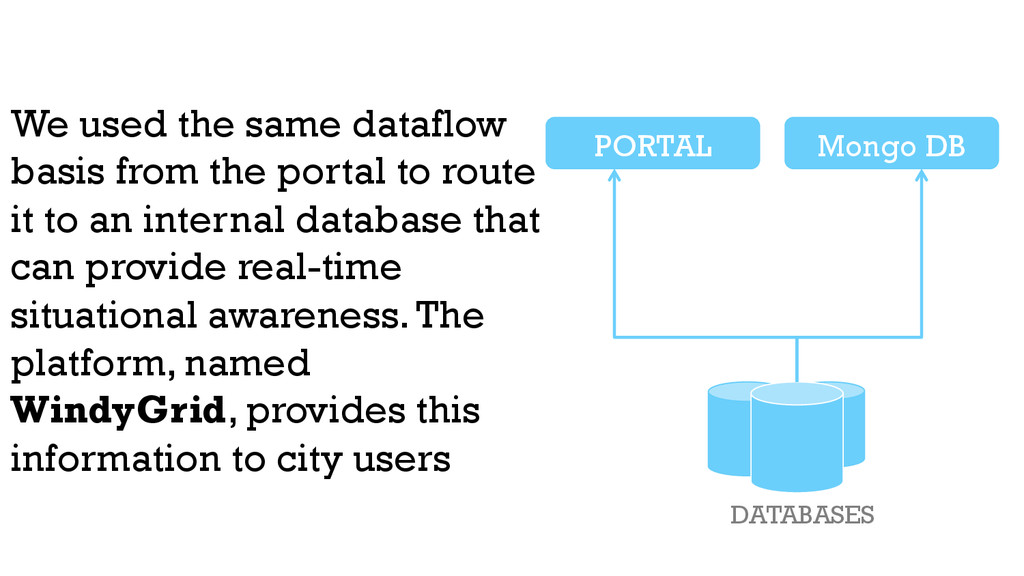
route it to an internal database that can provide real-time situational awareness. The platform, named WindyGrid, provides this information to city users DATABASES PORTAL Mongo DB
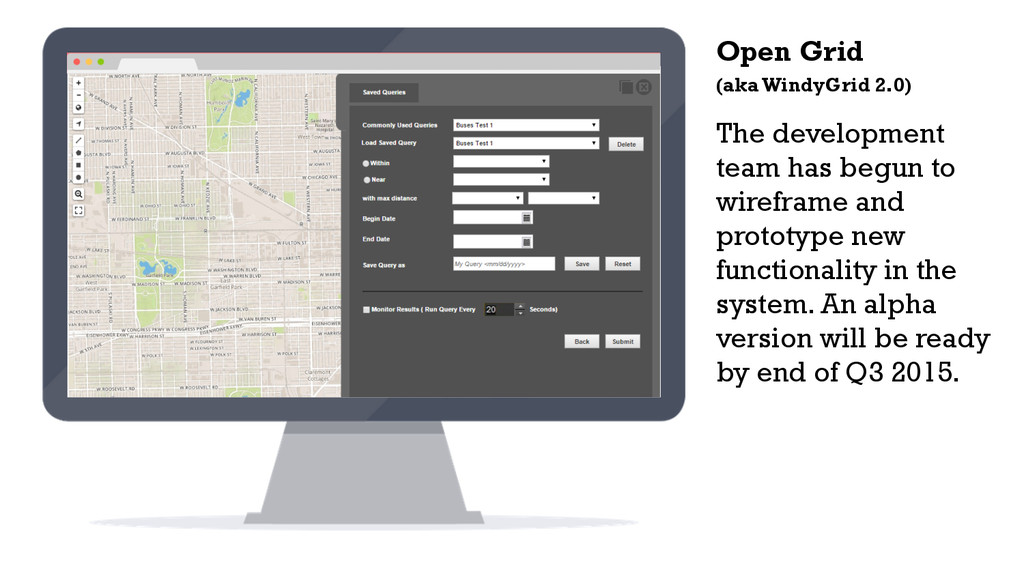
situational awareness system that brings over a dozen data sources together into a single application. This September, it will be released as an open source project. WindyGrid
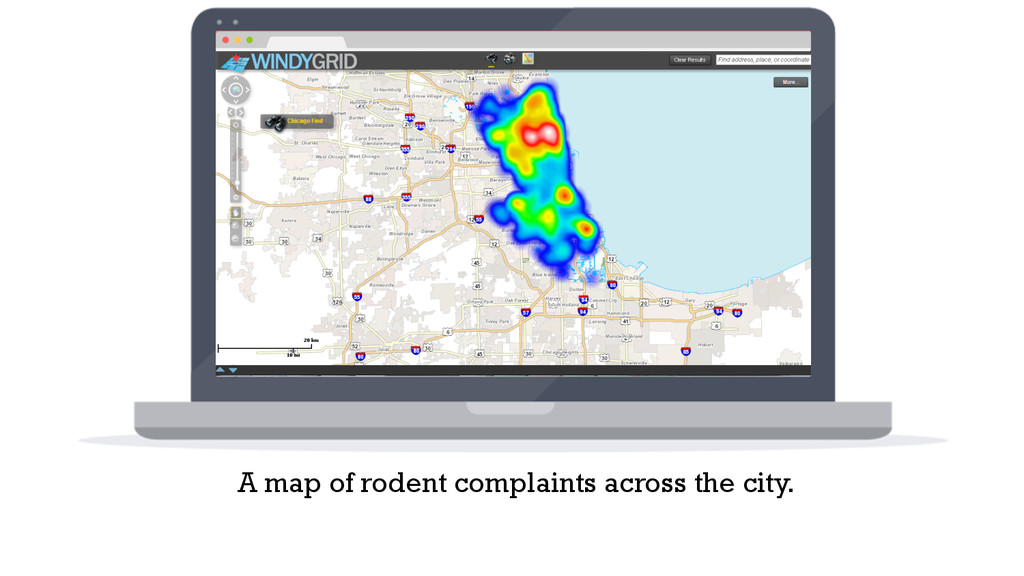
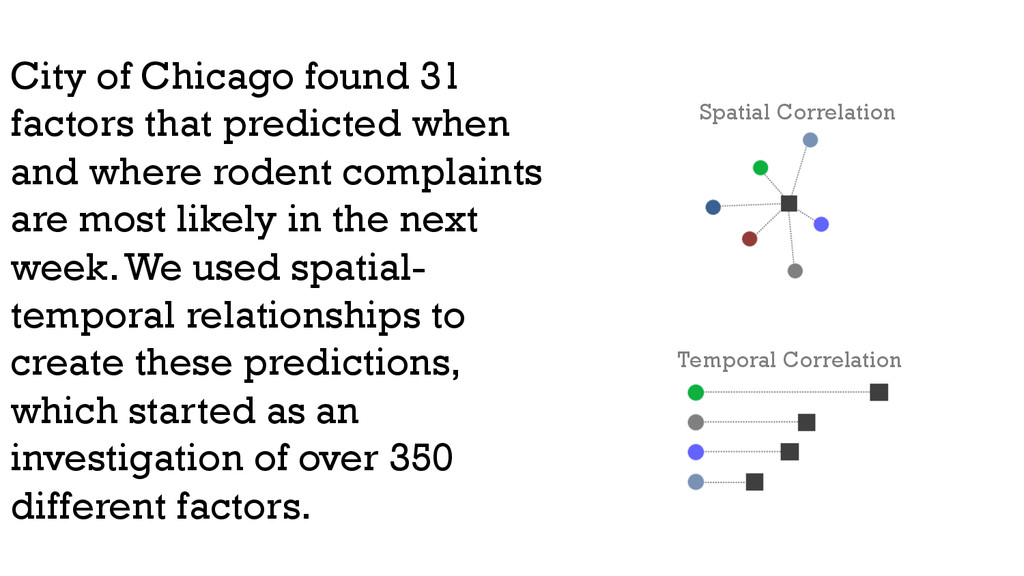
where rodent complaints are most likely in the next week. We used spatial- temporal relationships to create these predictions, which started as an investigation of over 350 different factors. Spatial Correlation Temporal Correlation
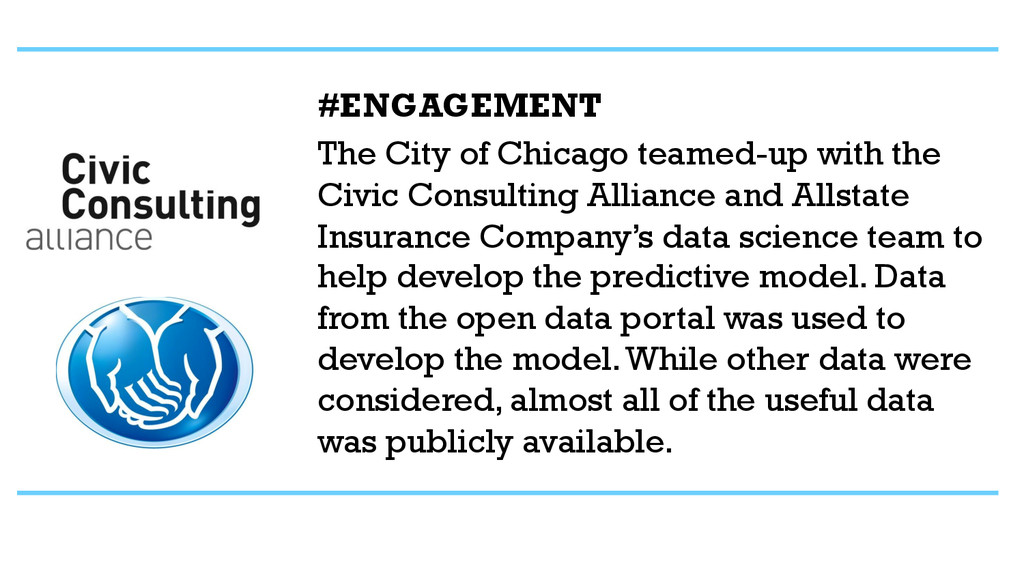
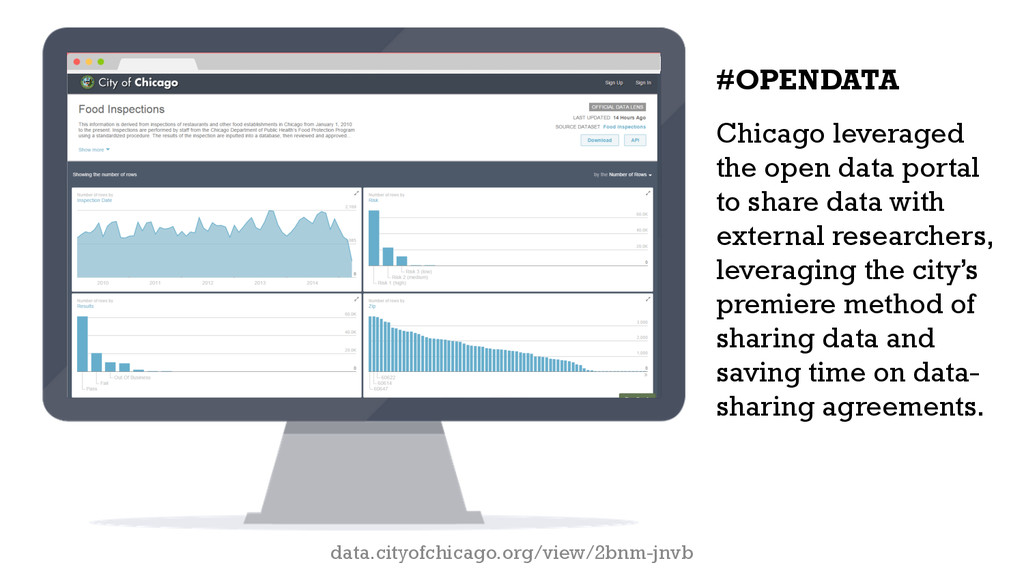
Alliance and Allstate Insurance Company’s data science team to help develop the predictive model. Data from the open data portal was used to develop the model. While other data were considered, almost all of the useful data was publicly available.
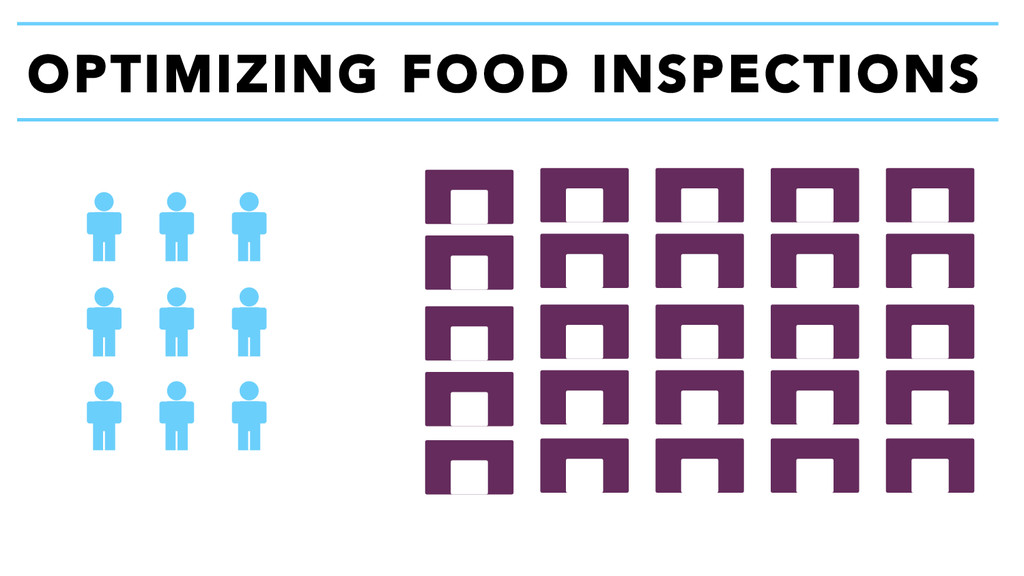
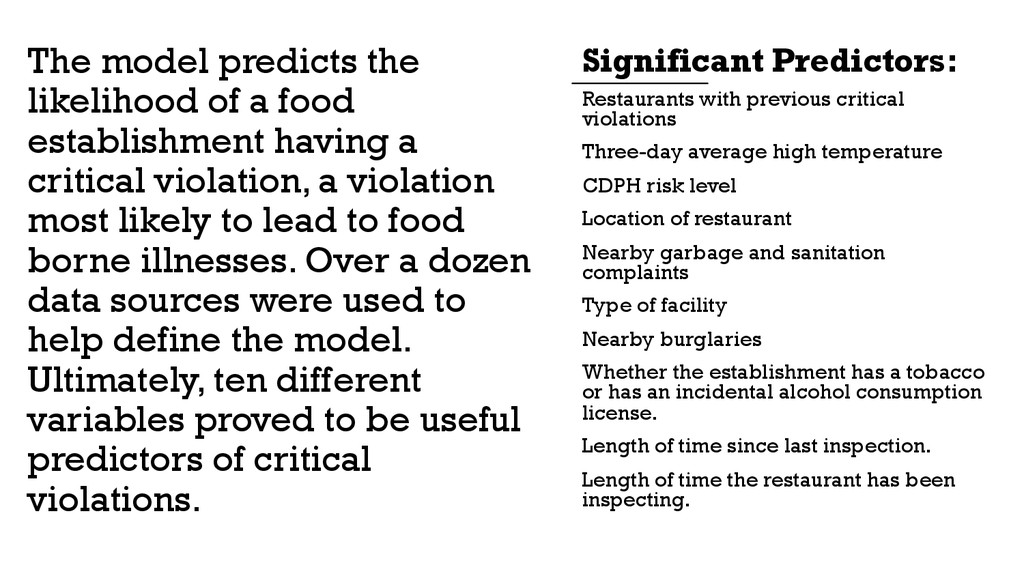
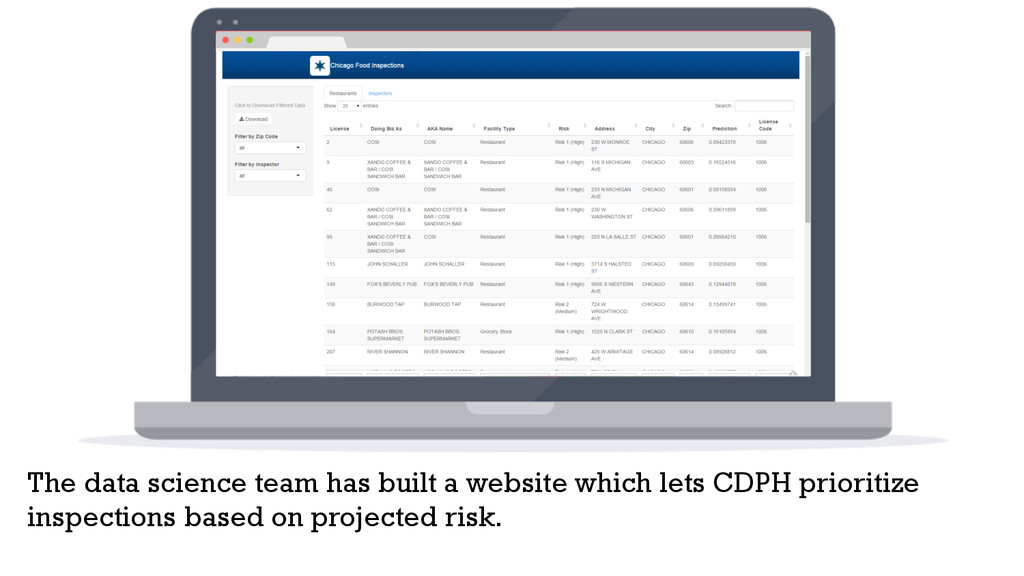
risk level Location of restaurant Nearby garbage and sanitation complaints Type of facility Nearby burglaries Whether the establishment has a tobacco or has an incidental alcohol consumption license. Length of time since last inspection. Length of time the restaurant has been inspecting. The model predicts the likelihood of a food establishment having a critical violation, a violation most likely to lead to food borne illnesses. Over a dozen data sources were used to help define the model. Ultimately, ten different variables proved to be useful predictors of critical violations. Significant Predictors:
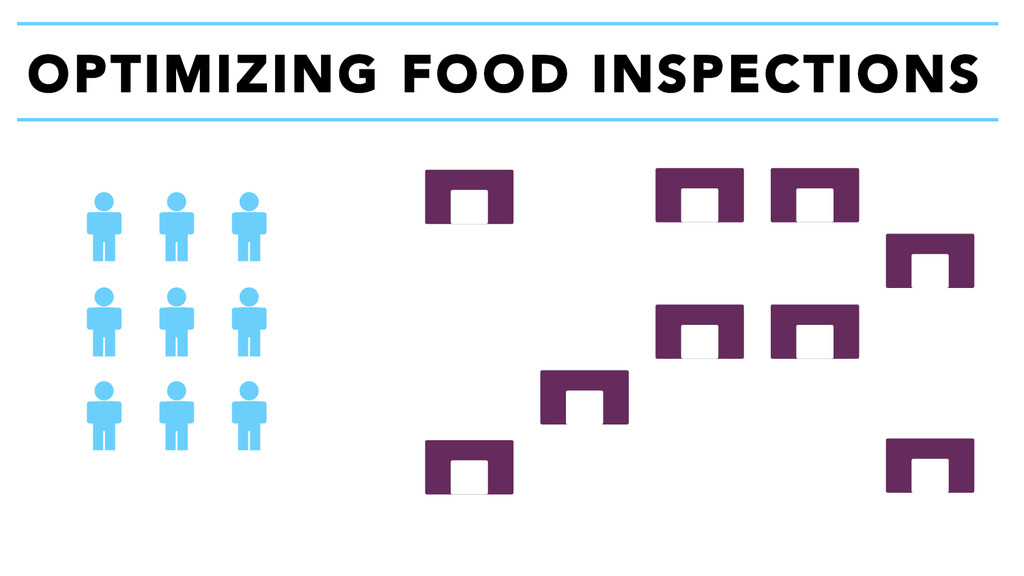
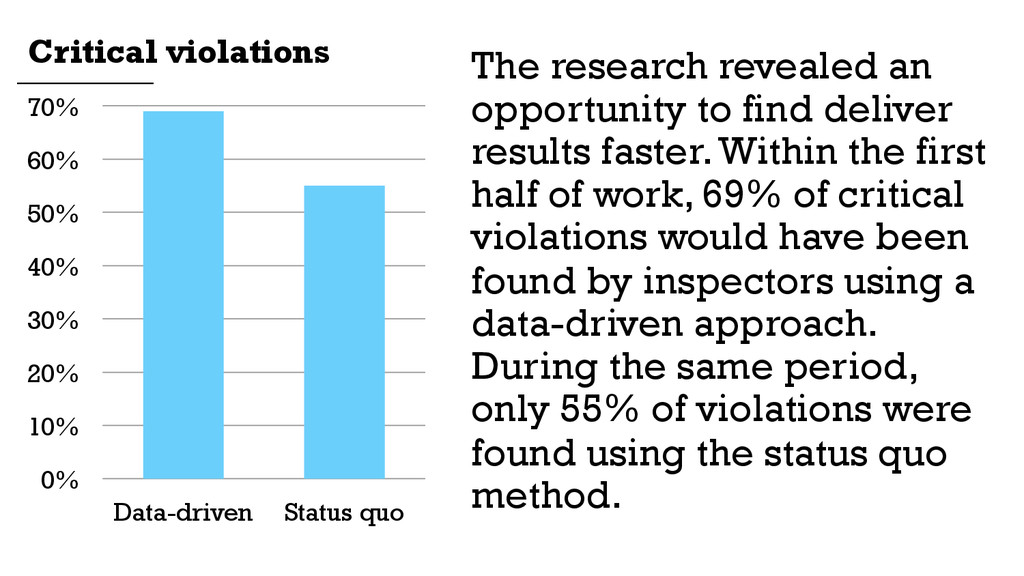
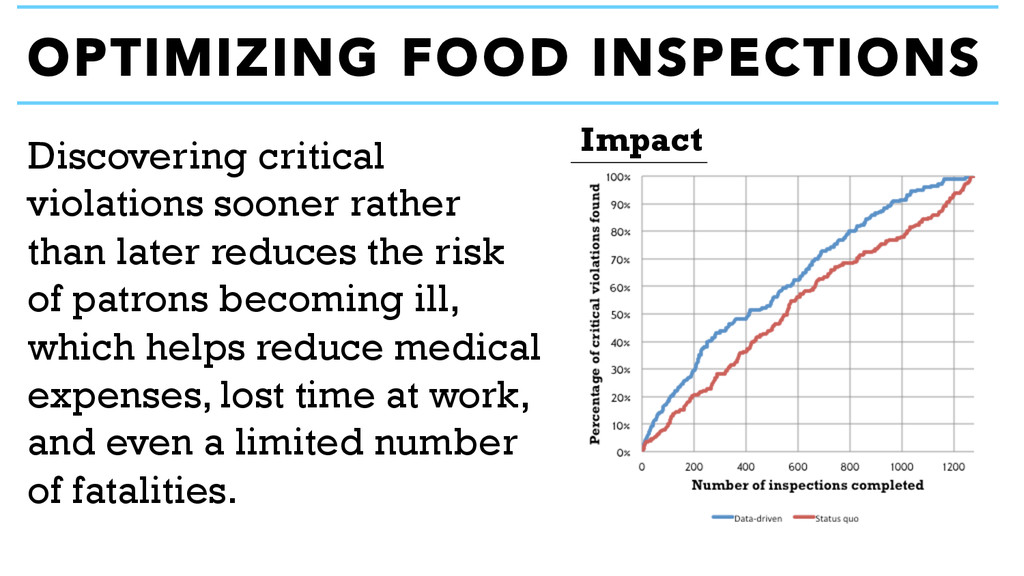
70% The research revealed an opportunity to find deliver results faster. Within the first half of work, 69% of critical violations would have been found by inspectors using a data-driven approach. During the same period, only 55% of violations were found using the status quo method. Critical violations
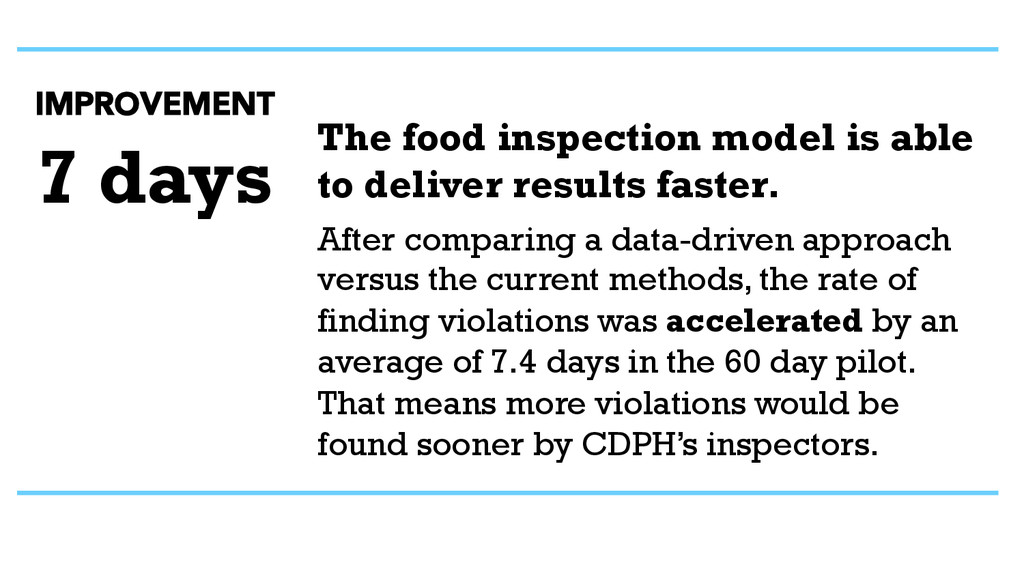
rate of finding violations was accelerated by an average of 7.4 days in the 60 day pilot. That means more violations would be found sooner by CDPH’s inspectors. 7 days IMPROVEMENT The food inspection model is able to deliver results faster.
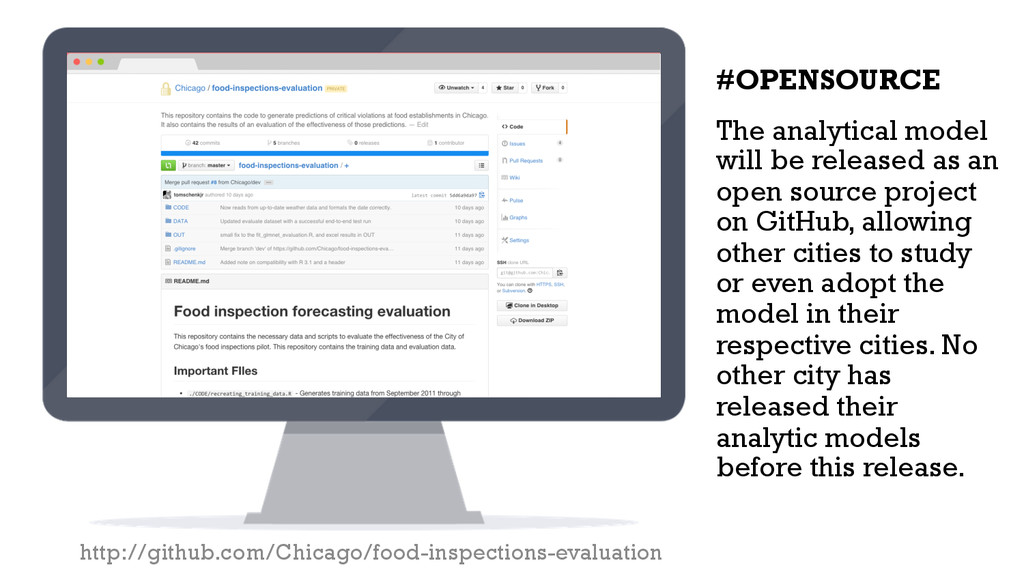
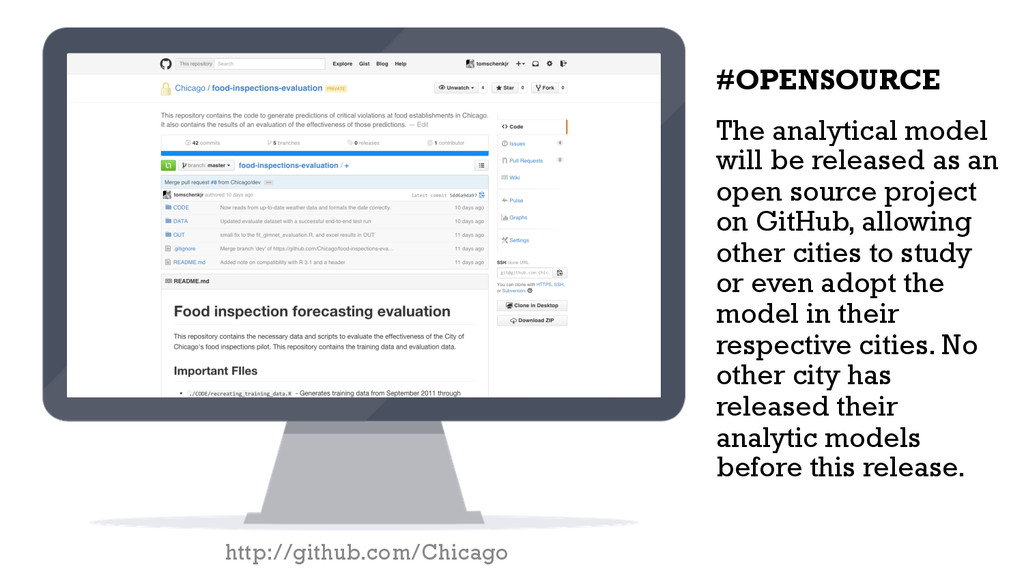
source project on GitHub, allowing other cities to study or even adopt the model in their respective cities. No other city has released their analytic models before this release. #OPENSOURCE
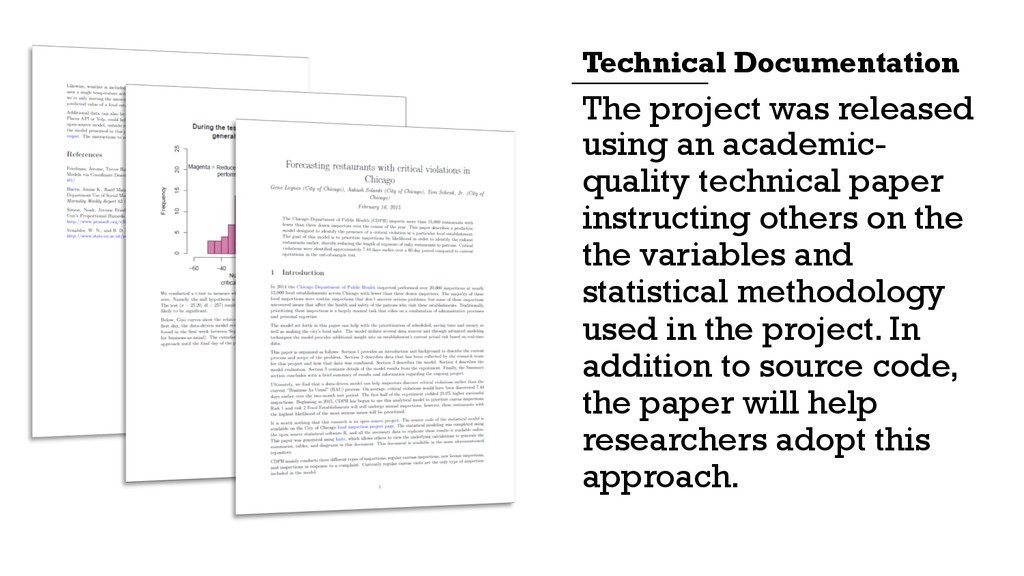
instructing others on the the variables and statistical methodology used in the project. In addition to source code, the paper will help researchers adopt this approach. Technical Documentation
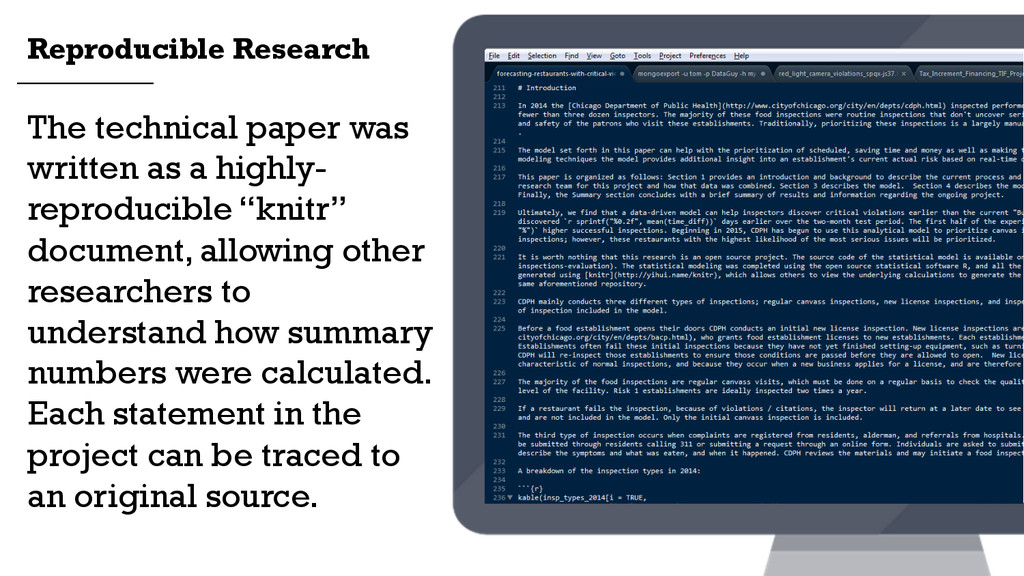
document, allowing other researchers to understand how summary numbers were calculated. Each statement in the project can be traced to an original source. Reproducible Research
source project on GitHub, allowing other cities to study or even adopt the model in their respective cities. No other city has released their analytic models before this release. #OPENSOURCE
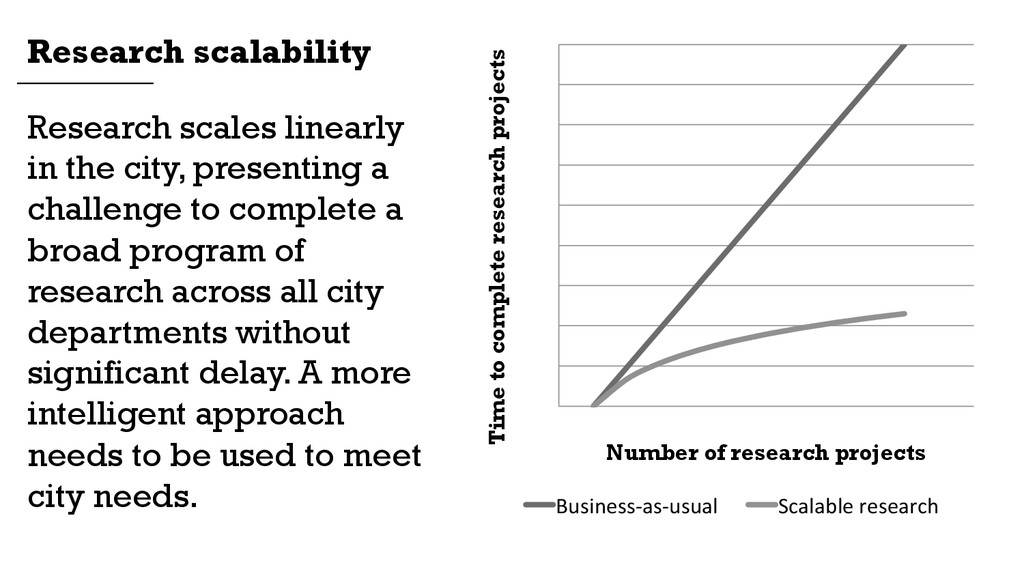
complete a broad program of research across all city departments without significant delay. A more intelligent approach needs to be used to meet city needs. Research scalability 1 2 3 4 5 6 7 8 9 10 0" 2" 4" 6" 8" 10" 12" Time to complete research projects Number of research projects Business.as.usual" Scalable"research"
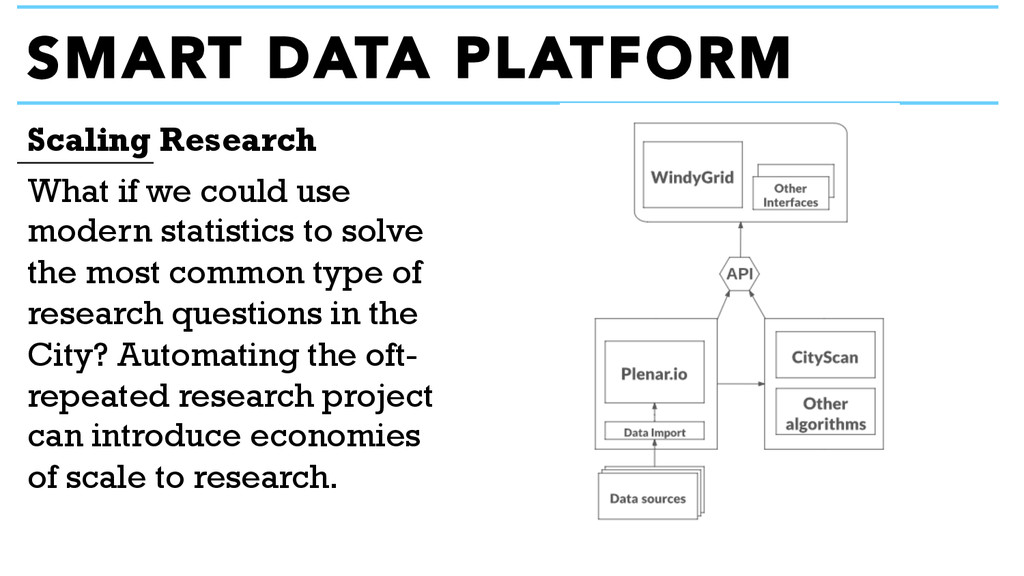
to solve the most common type of research questions in the City? Automating the oft- repeated research project can introduce economies of scale to research. Scaling Research
Officer City of Chicago @ChicagoCDO [email protected] data.cityofchicago.org github.com/Chicago techplan.cityofchicago.org report.cityofchicago.org opengovhacknight.org arrayofthings.github.io datadictionary.cityofchicago.org digital.cityofchicago.org