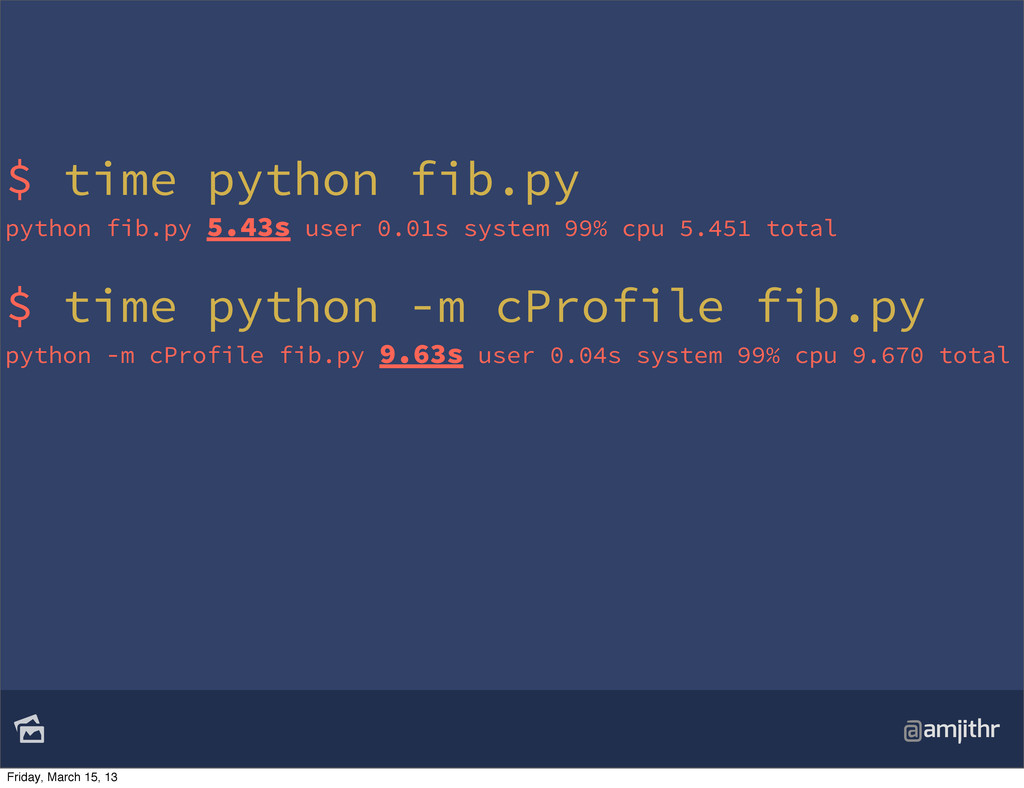
system 99% cpu 5.451 total $ time python -m cProfile fib.py python -m cProfile fib.py 9.63s user 0.04s system 99% cpu 9.670 total ~ x OVERHEAD Friday, March 15, 13
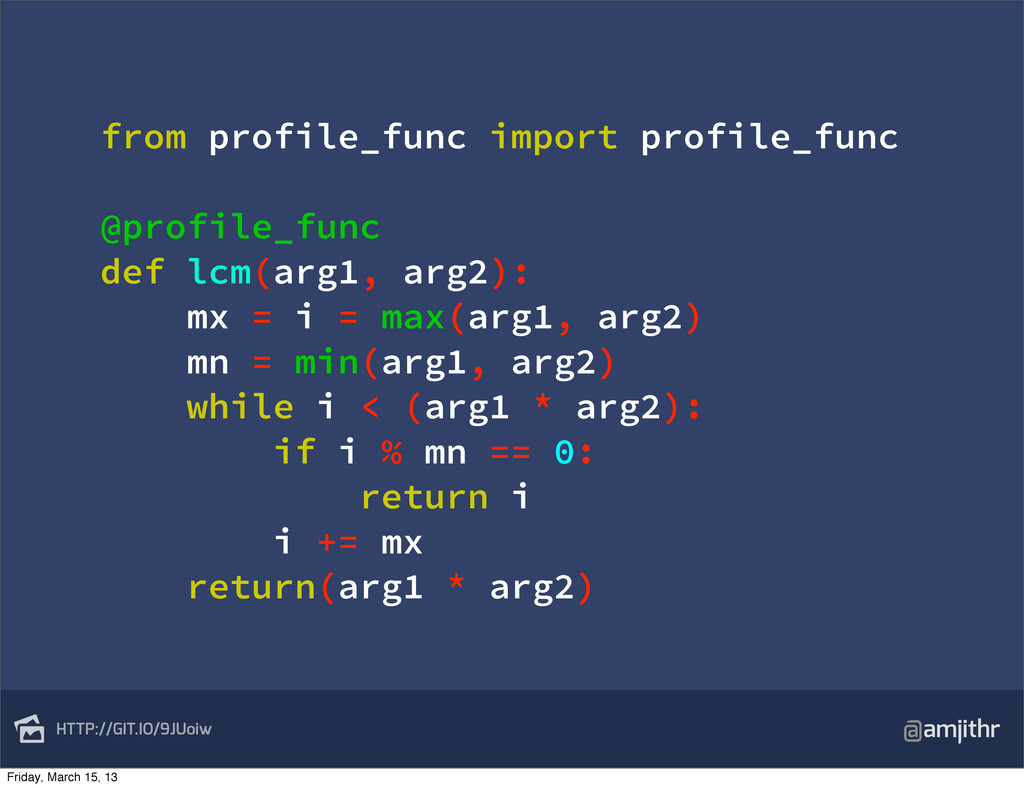
arg2): mx = i = max(arg1, arg2) mn = min(arg1, arg2) while i < (arg1 * arg2): if i % mn == 0: return i i += mx return(arg1 * arg2) Friday, March 15, 13