Upgrade to Pro — share decks privately, control downloads, hide ads and more …

Apps for Ghent 2012 - Datavisualization

Apps for Ghent 2012 - Datavisualization

A short presentation during Apps for Ghent 2012.
I wanted to talk about stories & facts in visualization projects.

Andries De Reyghere

March 27, 2012
Tweet

Other Decks in Technology

Transcript

  1. Hi, ik ben Andries - @dretio This is my 10-minute

    presentation during Apps for Ghent 2012 (dutch) www.appsforghent.be
  2. Co-founder “Bits of Love”, een digitale studio. I started showing

    some visualisations from our www.bitsoflove.be studio
  3. ... en “Small Town Heroes”. Wij maken 2nd screens apps

    voor TV. Some more visualisations from www.smalltownheroes.be, a second screen for TV company.
  4. Connecting the dots, my first love. Play “connecting the dots”

    with your children if you want them to become dataviz people ;)
  5. Reading the stats, my second. Strategy games are the perfect

    blend of Project Management, Statistics and Visualisations with a strategy sauce on top. That’s why I love them all.
  6. Stories, my third. These days we forget about the importance

    of stories and storytelling. Not the marketing lingo, but the real everyday stuff.
  7. Niet over ... vorm With my limited time, I skipped

    some important topics like : crappy infographics...
  8. Niet over ... the future of dataviz .. and the

    future of dataviz. This example is located on the airport of Zürich and is awesome. Observation Deck B
  9. But.. about using the force wisely I really want to

    talk about powerful visualisations by means of storytelling & knowledge of the subject.
  10. De basis van een goeie visualisatie is een verhaal &

    kennis van het onderwerp In my opinion this visualisation won gold at Malofiej12 because it uses great story mechanics.
  11. Wat doe je met 1000 pagina’s confidentiële documenten? How do

    journalists react to this “open data/ sources” thing?
  12. Fastcompany Wikileaks visualisation Some make a Wordle out of 1000

    pages with great information, to conclude the word “REPORTS” has a lot of occurences...
  13. Data without context has no meaning. Data needs a background,

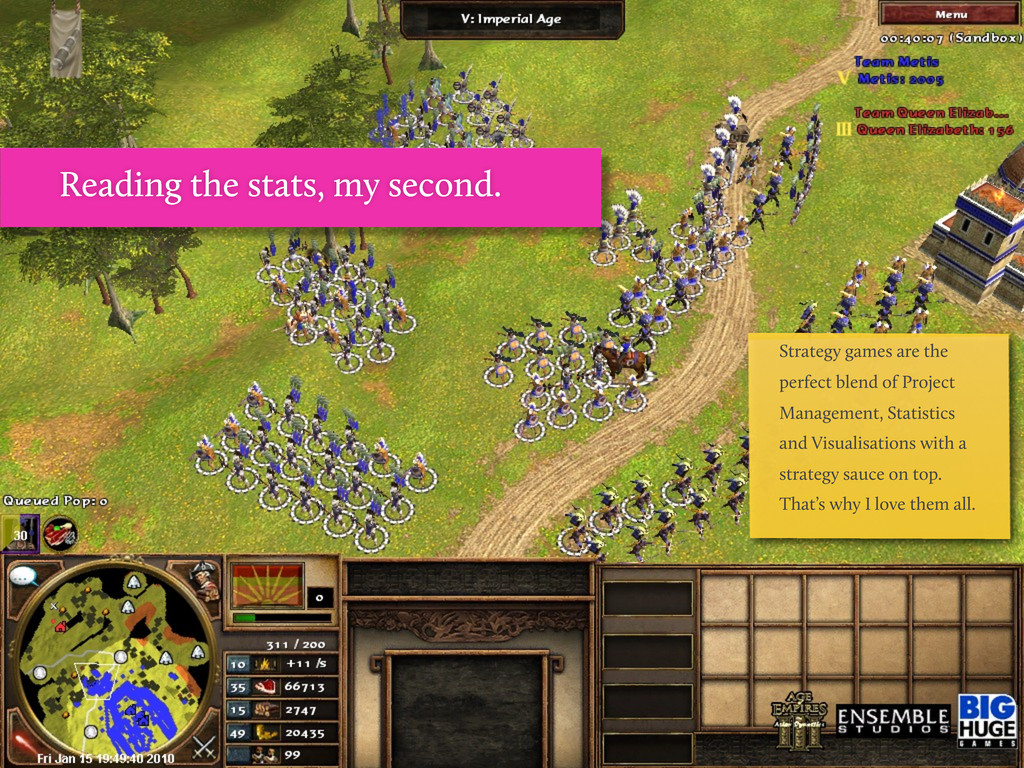
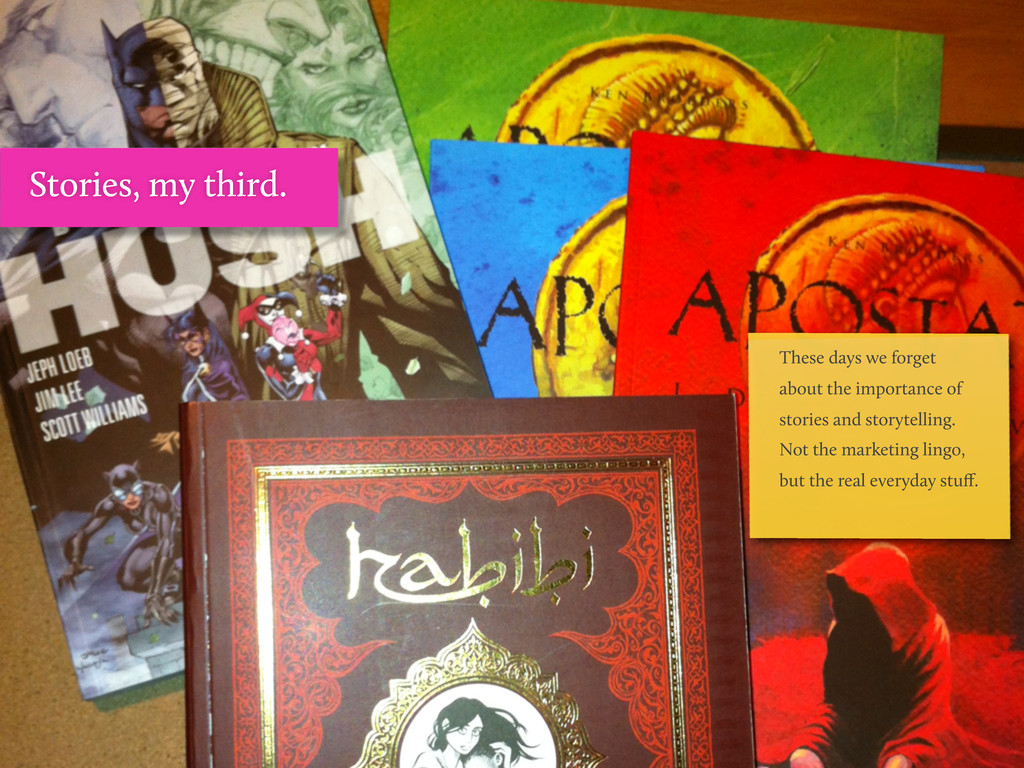
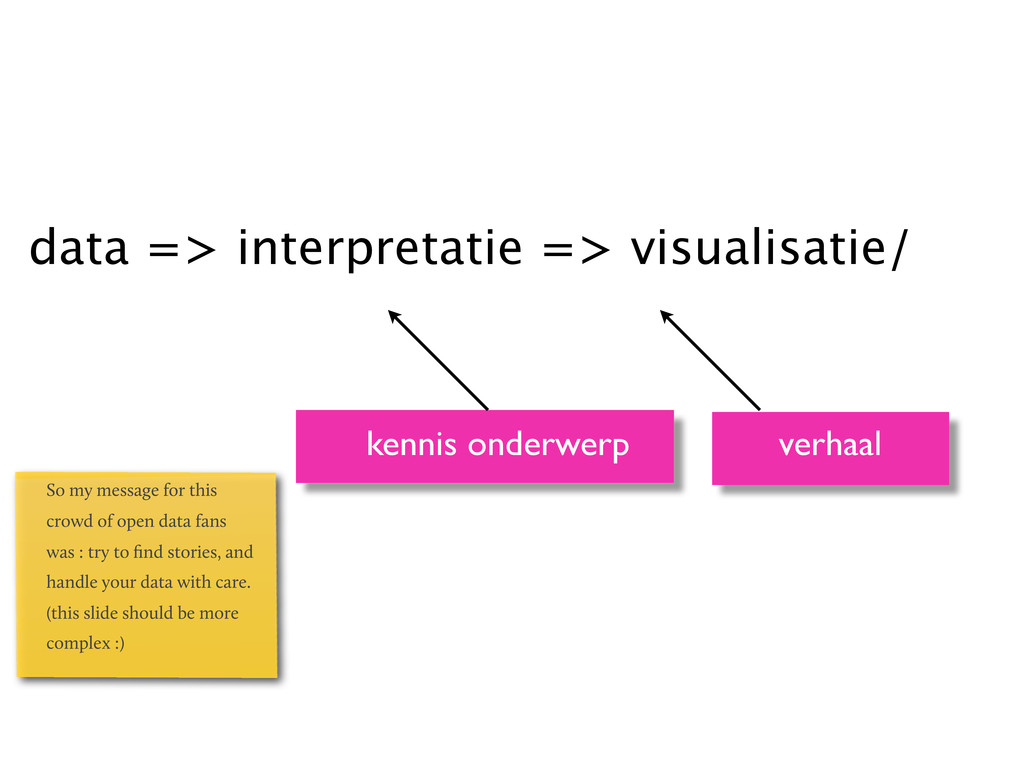
    a narrative that sucks the user mentally into the world of the data. Narratives are fundamental in human reasoning and give humans the ability to assign meaning to their experiences (Laurillard 1998; Dickey 2006). Applications, whether games or data visualizations, have to incorporate a narrative in order to reach its full potential. According to Brown and Cairns (2004), it is the narrative that separates an engagement-application from an immersion-application. The more immersion the higher amounts of time, effort and attention an user will invest in the application. By integrating a narrative, or letting the data make up a story, the user will be much more invested, emotionally and mentally. The narrative functions as the motor. Here I make the link between games & data visualisations, and the necessity of a narrative to reach “full potential”
  14. Inspiratie : comics These are very special visualisations you can

    find in the book “Zachte Atlas van Nederland”. It’s awesome & full of stories.
  15. Inspiratie : ads Even when they are fake, movies &

    ads & arts can help us to create great visualisation stories.
  16. Vertrouw niet altijd designers :) Warning : do not always

    trust designers. This article in Smashing Magazine was a bloody shame. Basic charts are good!
  17. Heatmap : zee of land ? It’s a dog in

    a park - I had some fun here with the audience :)
  18. Vertrouw je ogen niet Warning : do not always trust

    designers. These guys multiplied the wrong variables in their circles..
  19. Vertrouw je ogen niet .. with this result. I think

    we should learn to see these mistakes.
  20. De basis van een goeie visualisatie is een verhaal &

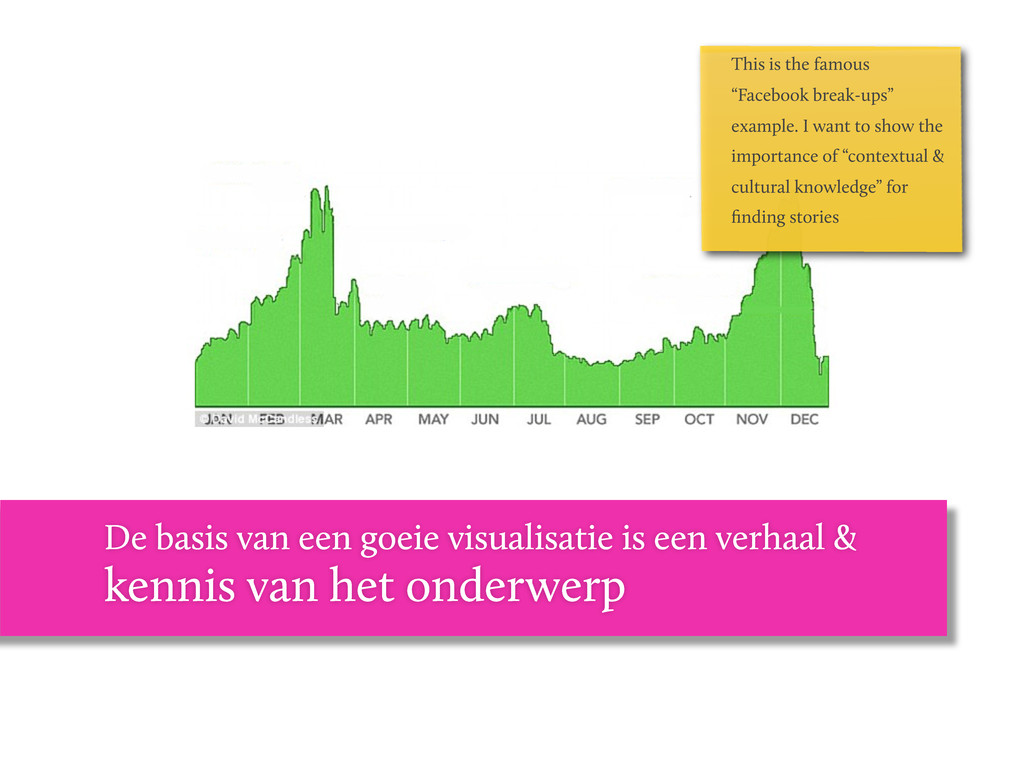
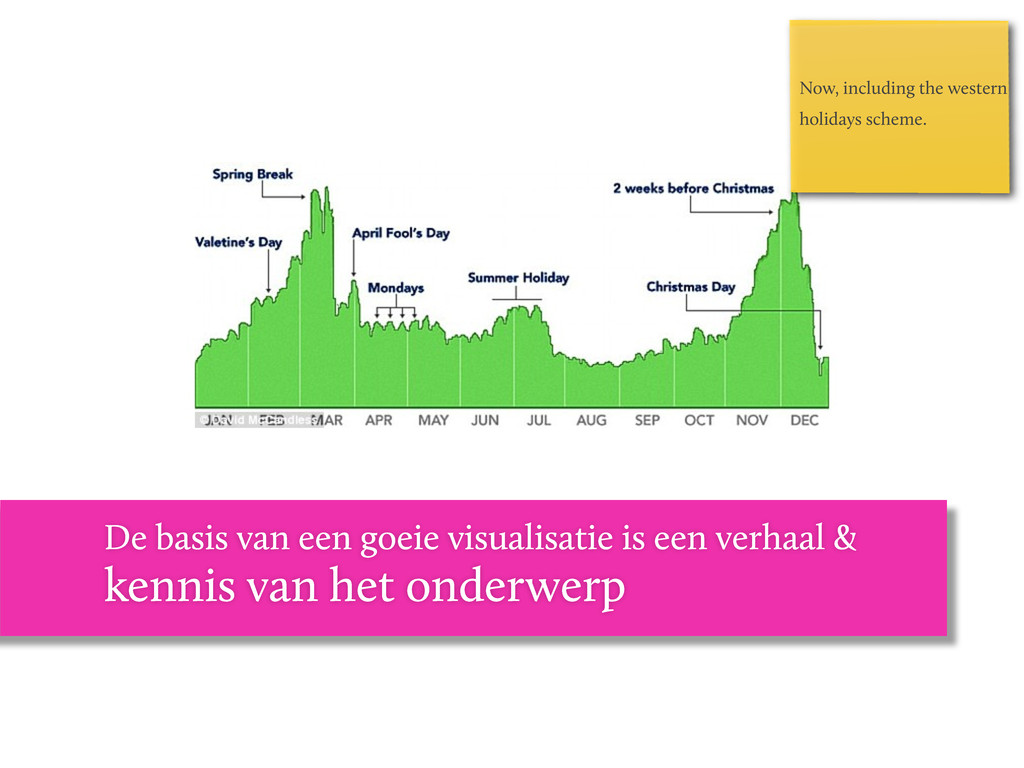
    kennis van het onderwerp This is the famous “Facebook break-ups” example. I want to show the importance of “contextual & cultural knowledge” for finding stories
  21. De basis van een goeie visualisatie is een verhaal &

    kennis van het onderwerp Now, including the western holidays scheme.
  22. 10% werklozen met een uitkering 30% werklozen met een uitkering

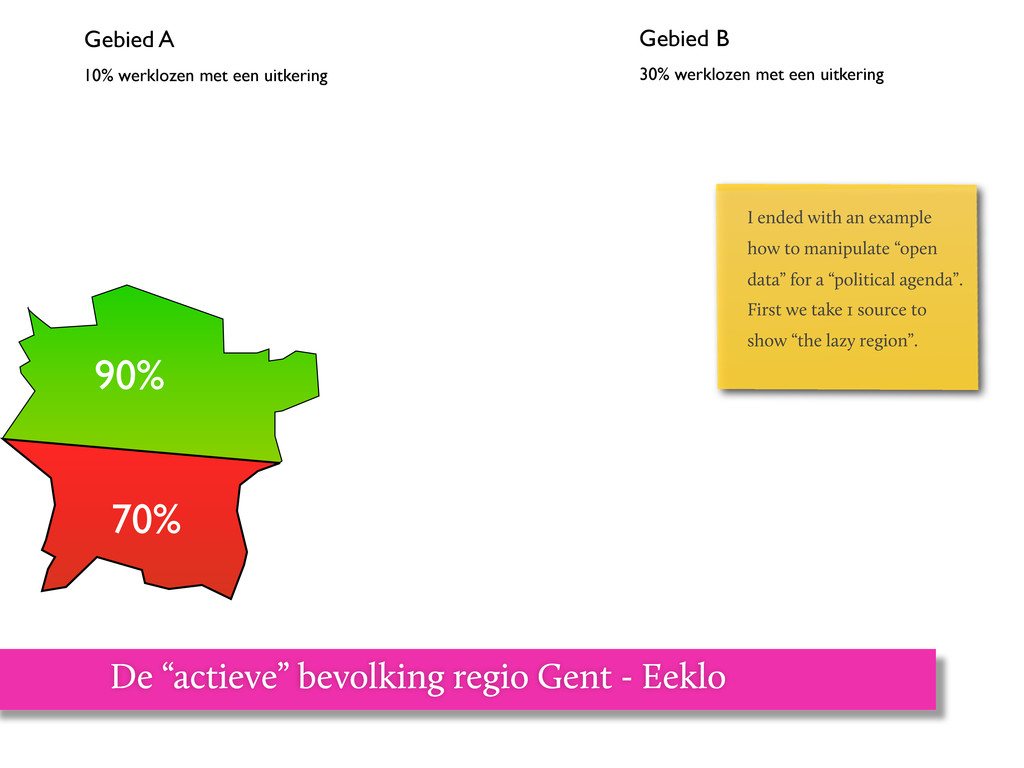
    Gebied A Gebied B 90% 70% De “actieve” bevolking regio Gent - Eeklo I ended with an example how to manipulate “open data” for a “political agenda”. First we take 1 source to show “the lazy region”.
  23. 10% werklozen met een uitkering 30% werklozen met een uitkering

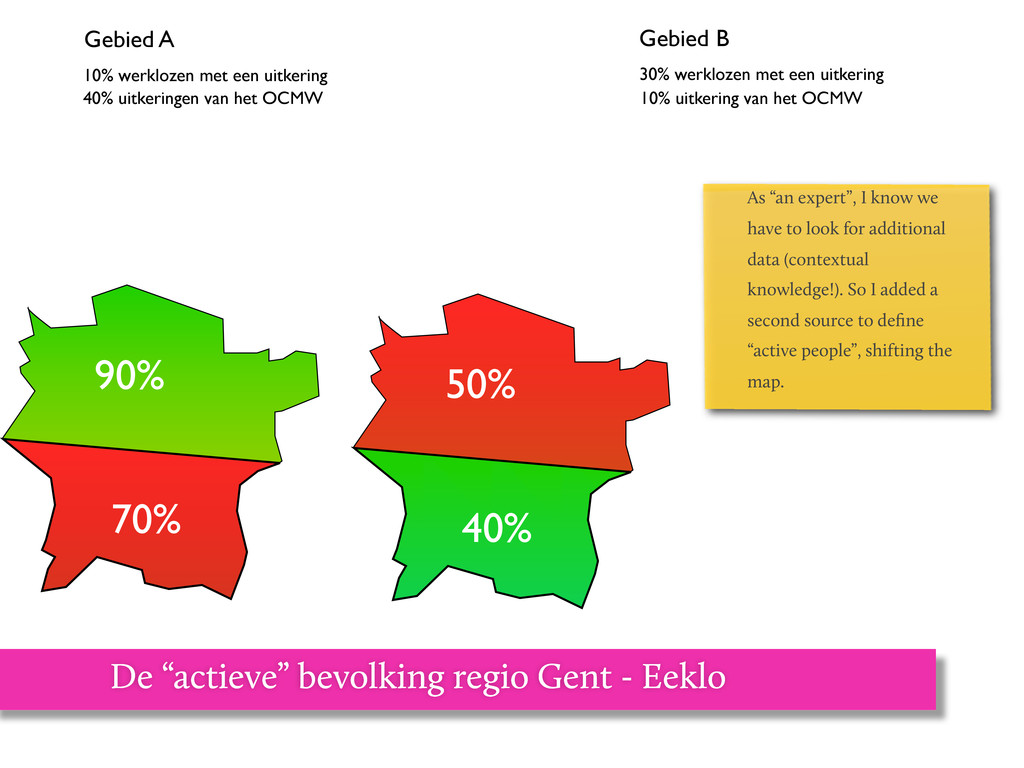
    Gebied A Gebied B 90% 70% 50% 40% 40% uitkeringen van het OCMW 10% uitkering van het OCMW De “actieve” bevolking regio Gent - Eeklo As “an expert”, I know we have to look for additional data (contextual knowledge!). So I added a second source to define “active people”, shifting the map.
  24. 10% werklozen met een uitkering 30% werklozen met een uitkering

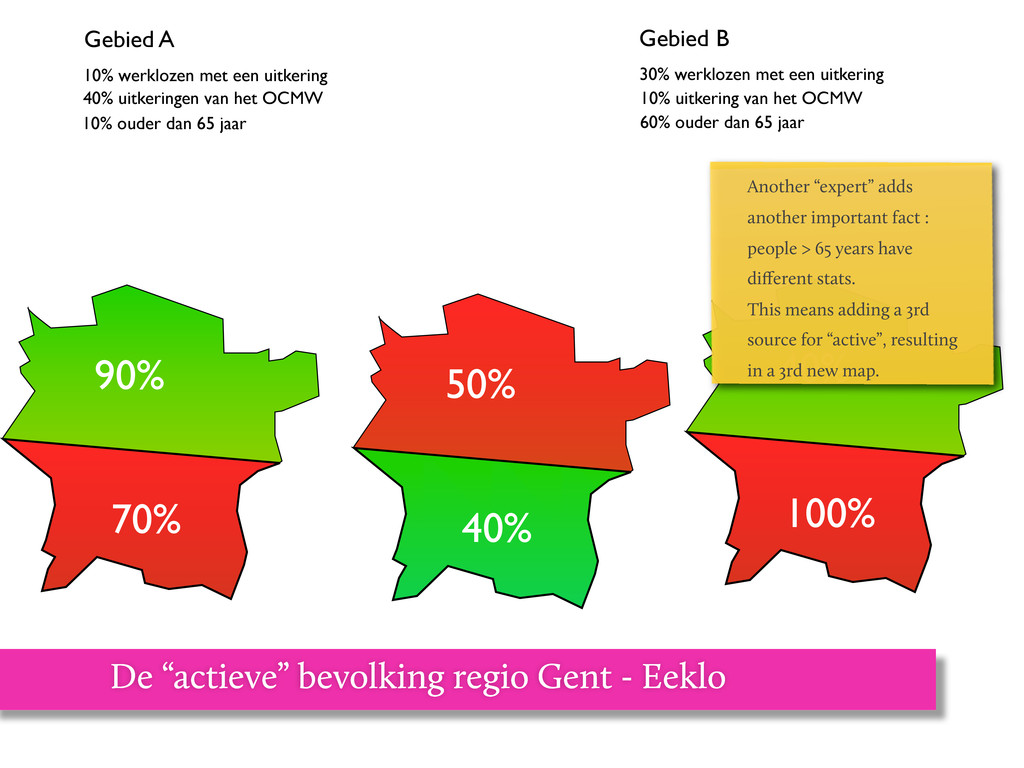
    Gebied A Gebied B 90% 70% 50% 40% 40% uitkeringen van het OCMW 10% uitkering van het OCMW 40% 100% 10% ouder dan 65 jaar 60% ouder dan 65 jaar De “actieve” bevolking regio Gent - Eeklo Another “expert” adds another important fact : people > 65 years have different stats. This means adding a 3rd source for “active”, resulting in a 3rd new map.
  25. data => interpretatie => visualisatie/ kennis onderwerp verhaal So my

    message for this crowd of open data fans was : try to find stories, and handle your data with care. (this slide should be more complex :)
  26. Laat ons dus zoeken naar : Journalisten Producers Experts in

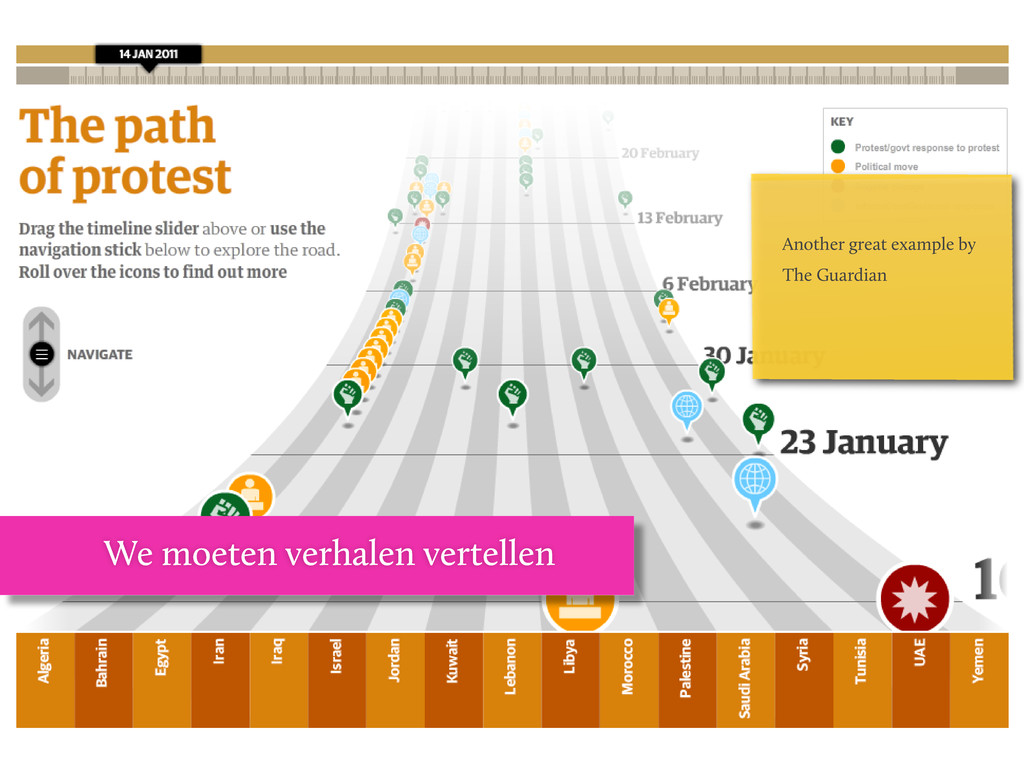
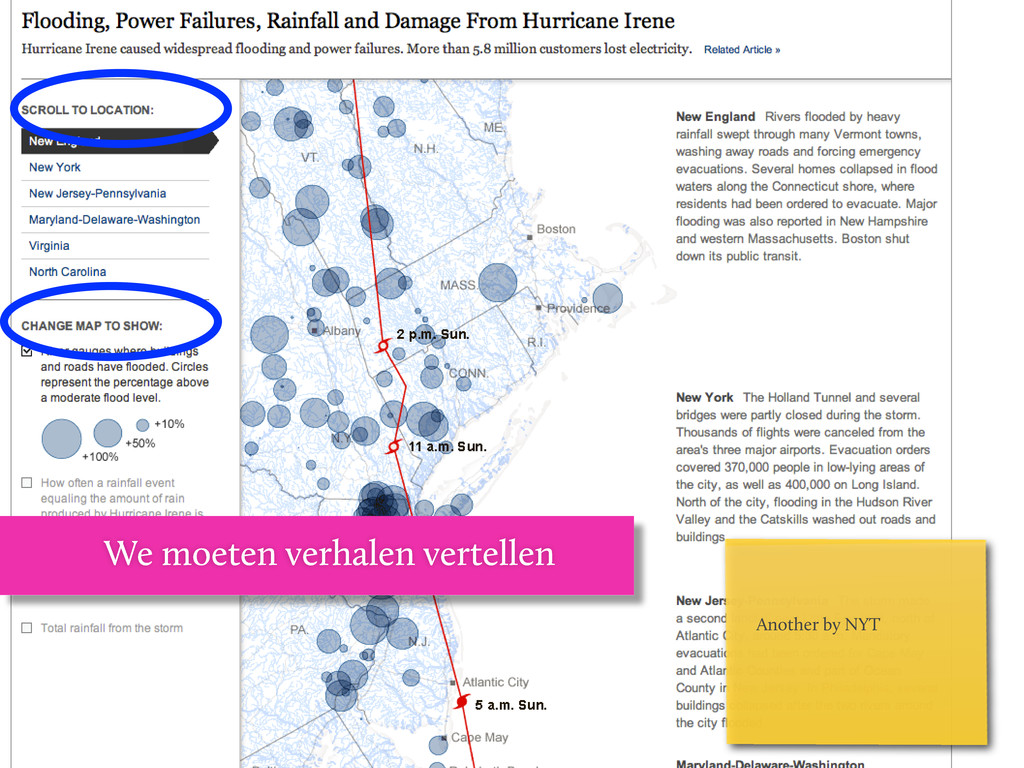
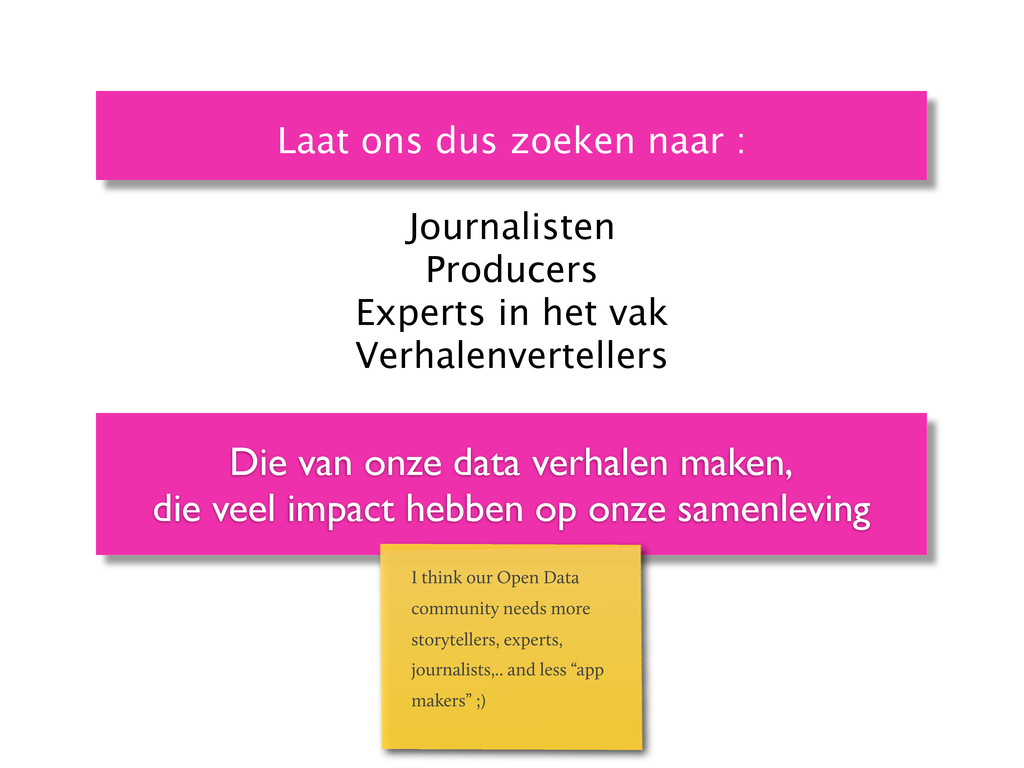
    het vak Verhalenvertellers Die van onze data verhalen maken, die veel impact hebben op onze samenleving I think our Open Data community needs more storytellers, experts, journalists,.. and less “app makers” ;)
  27. References http://www.niemanlab.org/2011/10/word-clouds-considered-harmful/ http://www.albertoantoniazzi.com/ Belgische voorbeelden : Deredactie.be & DS -

    Bart De Neve http://www.guardian.co.uk/world/interactive/2011/mar/22/middle-east-protest-interactive-timeline http://www.nytimes.com/interactive/2011/08/27/us/preparations-for-hurricane-irene-and-reports-of- damage.html http://projects.nytimes.com/guantanamo/ http://www.appsforghent.be