Talk given at RailsConf 2012
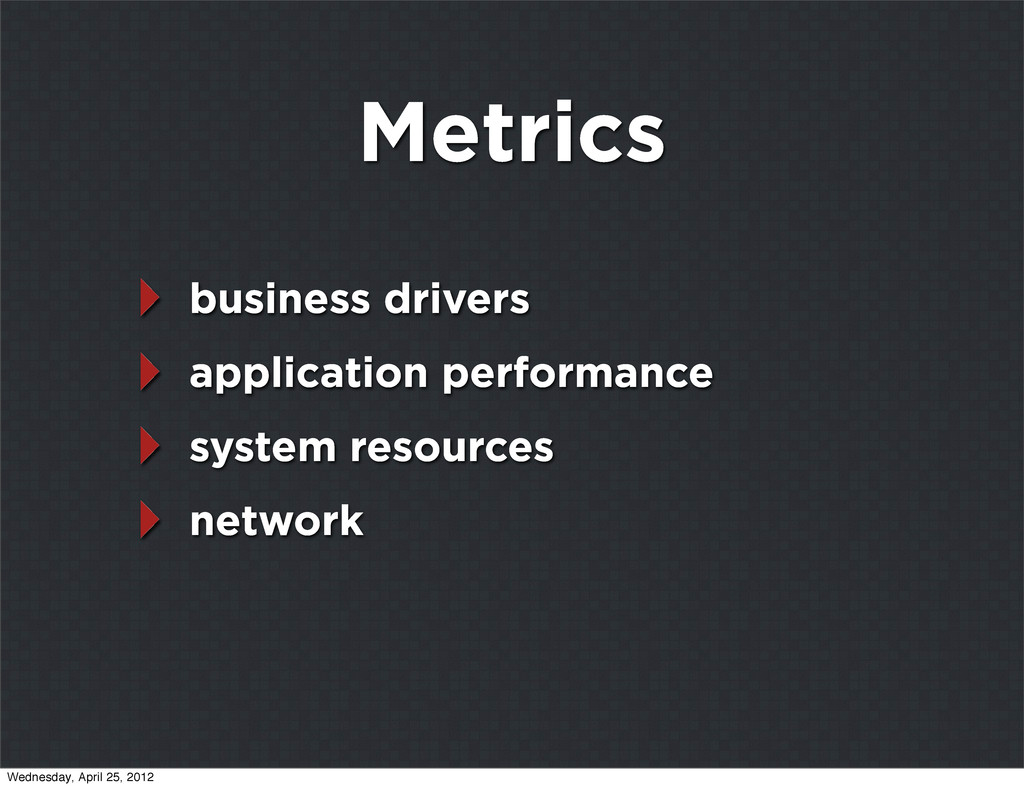
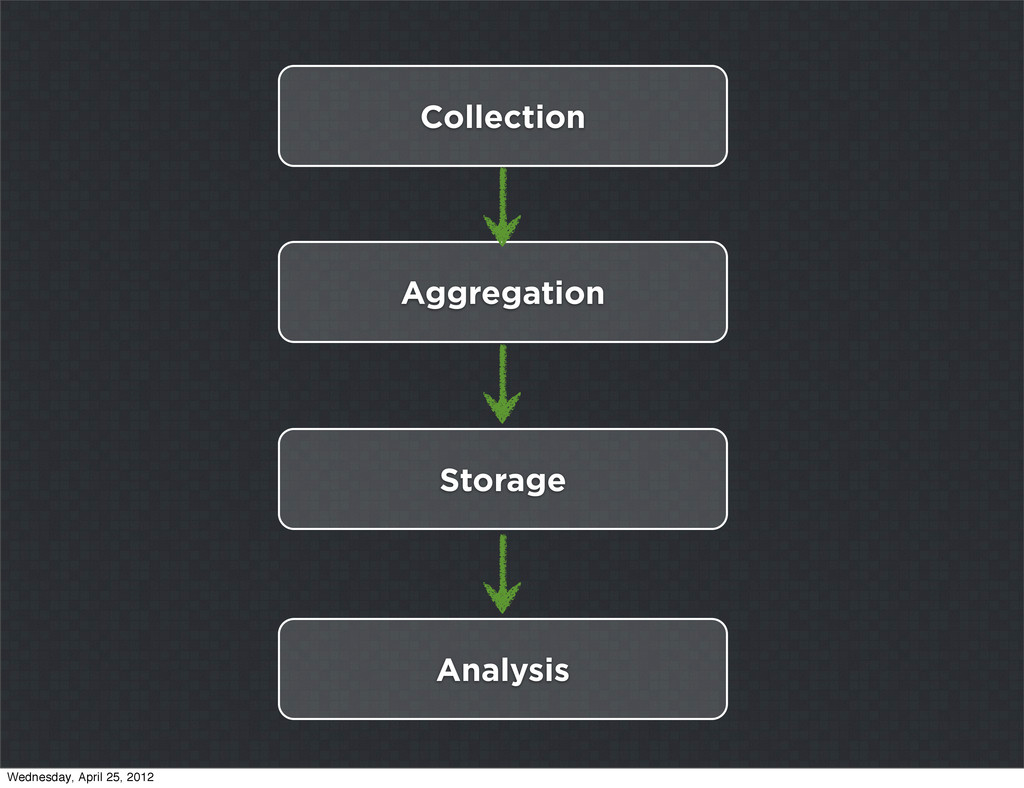
In the 21st century successful teams are data-driven. We’ll present a complete introduction to everything you need to start monitoring your service at every level from business drivers to per-request metrics in Rails/Rack, down to server memory/cpu. Provides a high-level overview of the fundamental components that comprise a holistic monitoring system and then drills into real-world examples with tools like ActiveSupport::Notifications, statsd/rack-statsd, and CollectD. Also covers best practices for active alerting on custom monitoring data.