Upgrade to Pro — share decks privately, control downloads, hide ads and more …

Introspecting Running Python Processes

Introspecting Running Python Processes

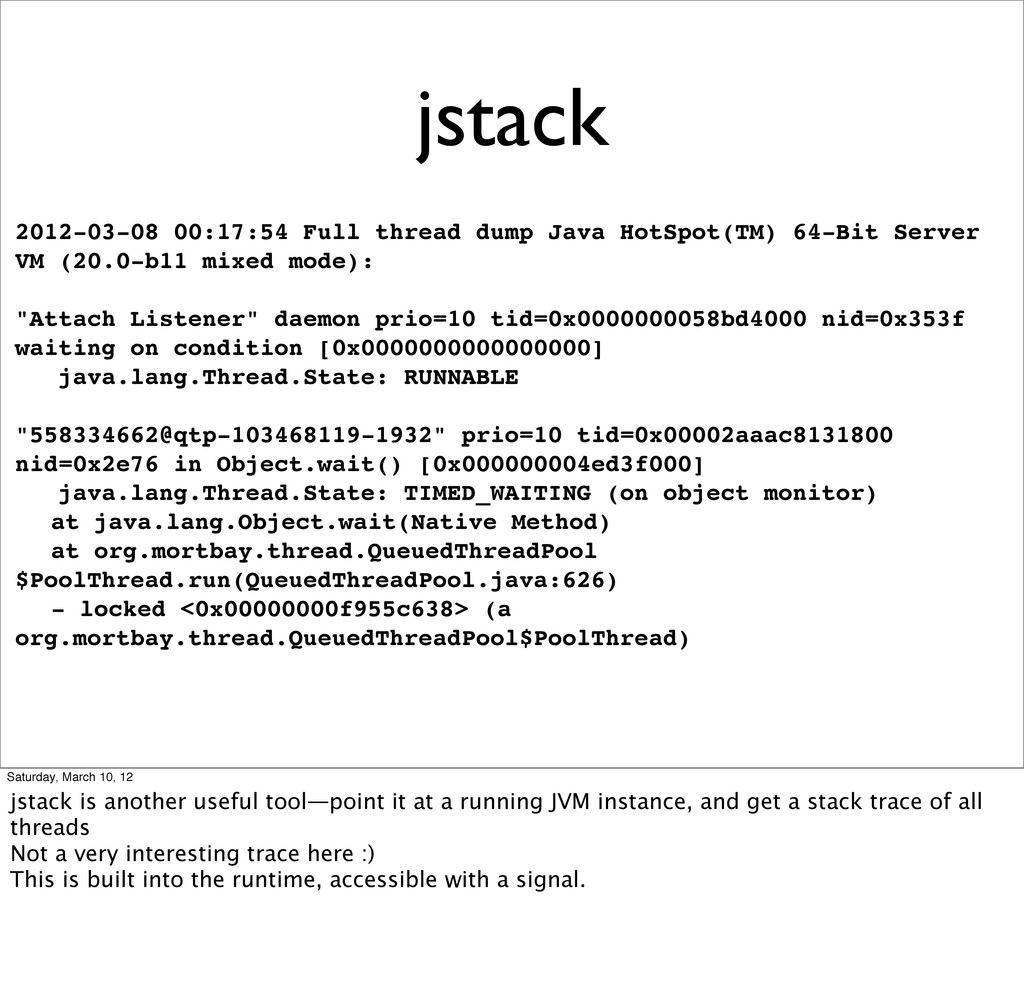
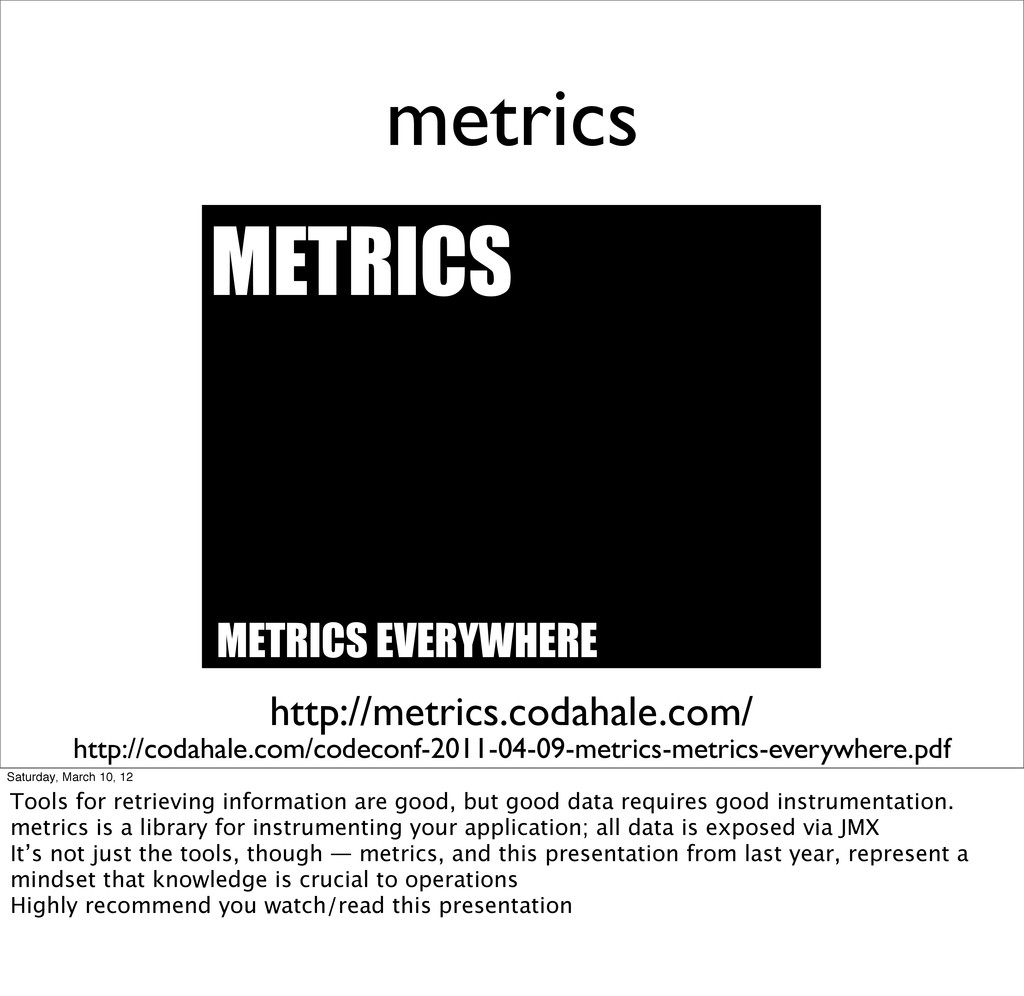
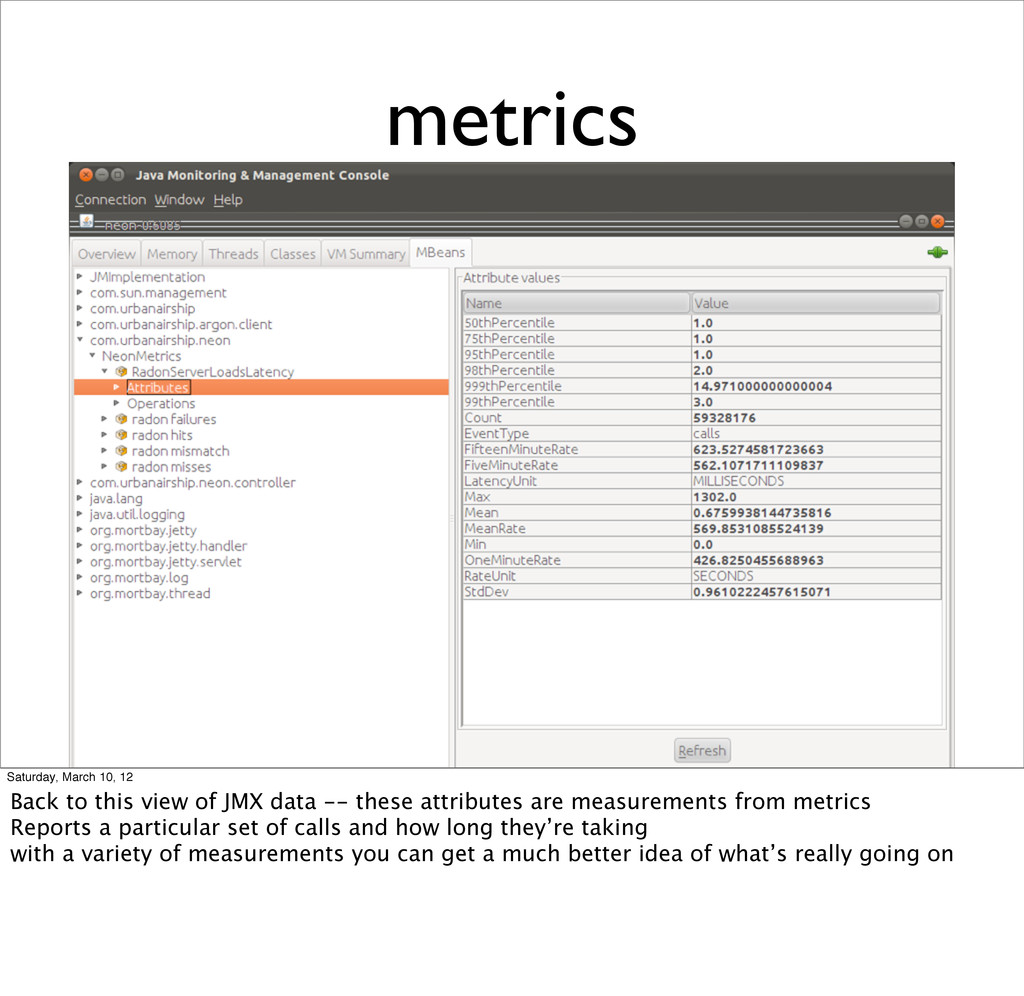
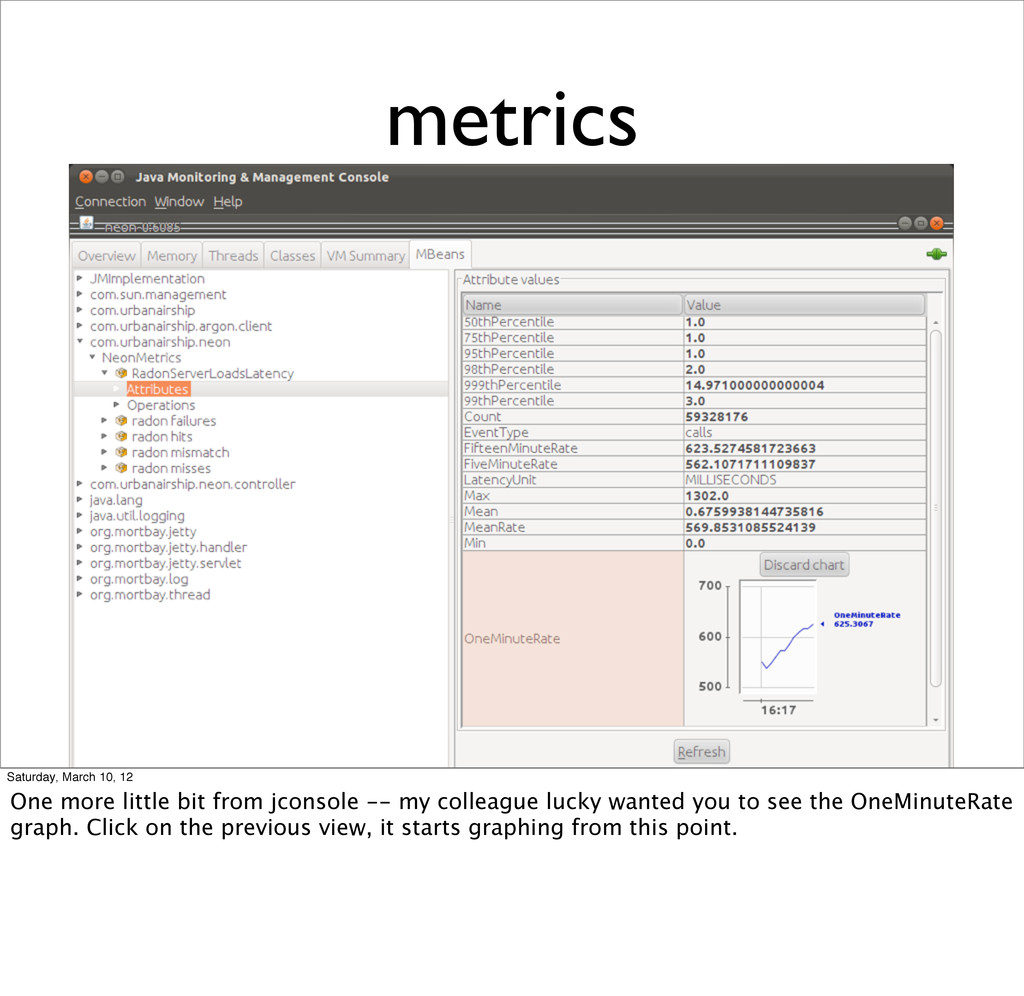
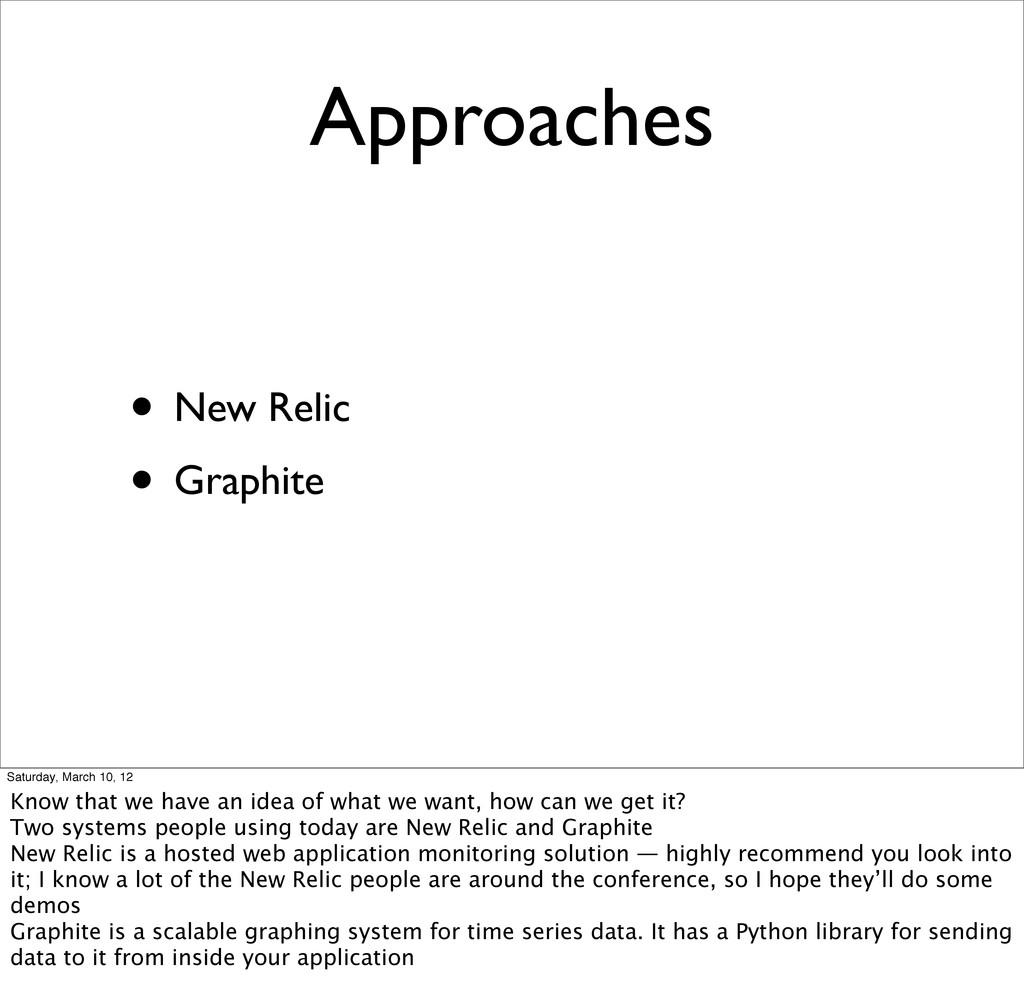
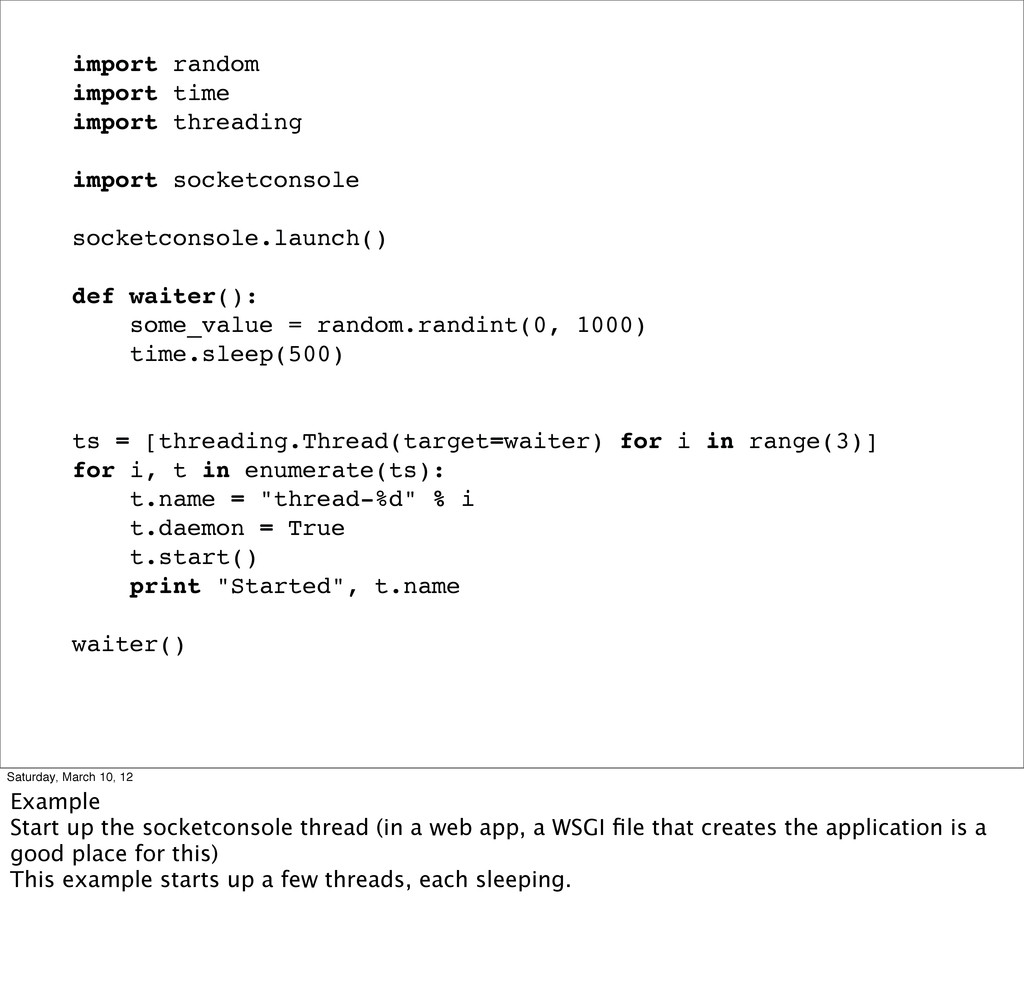
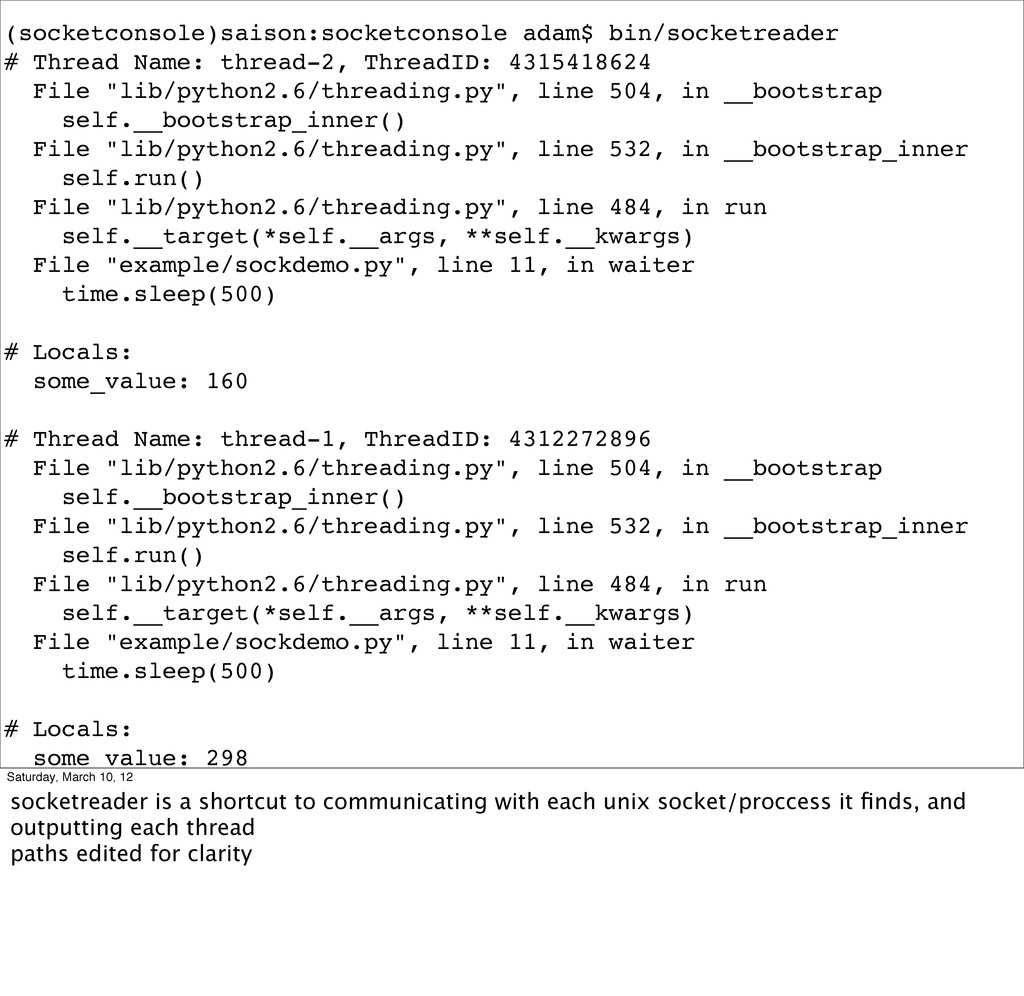
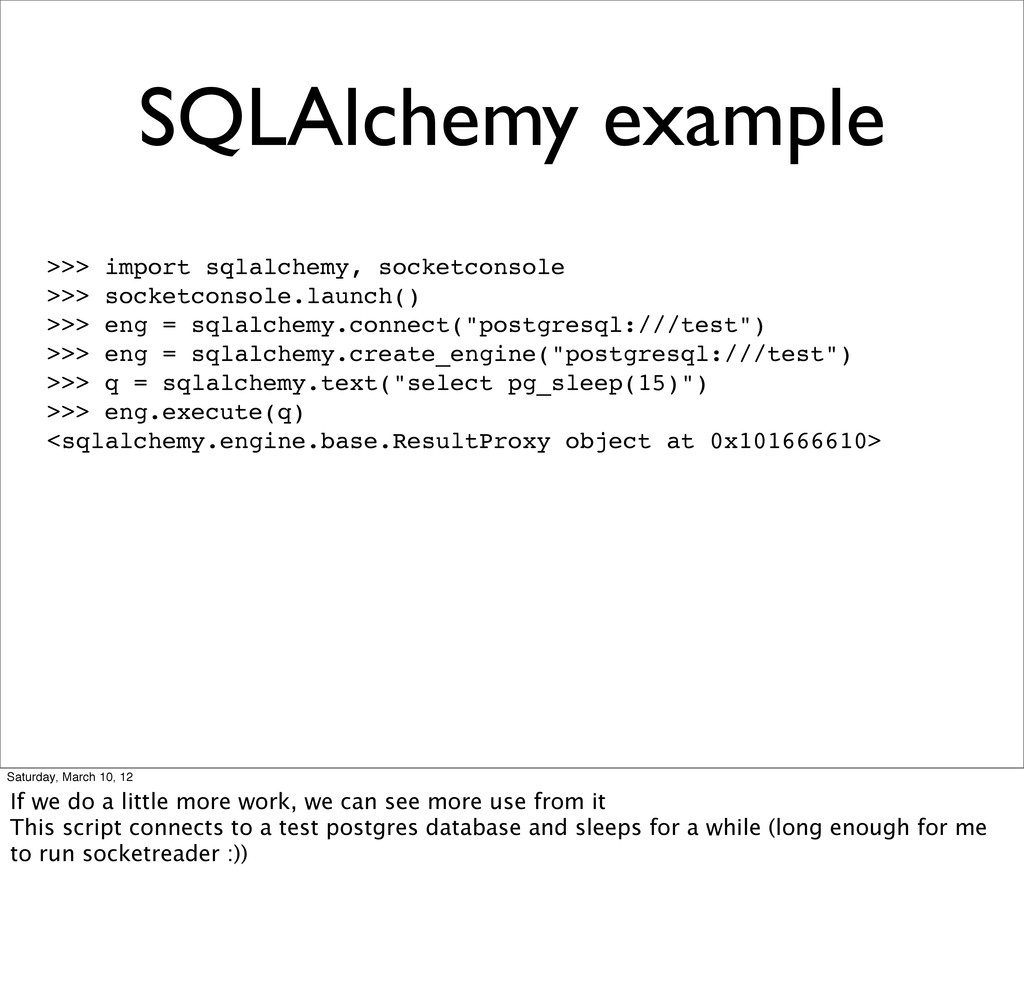
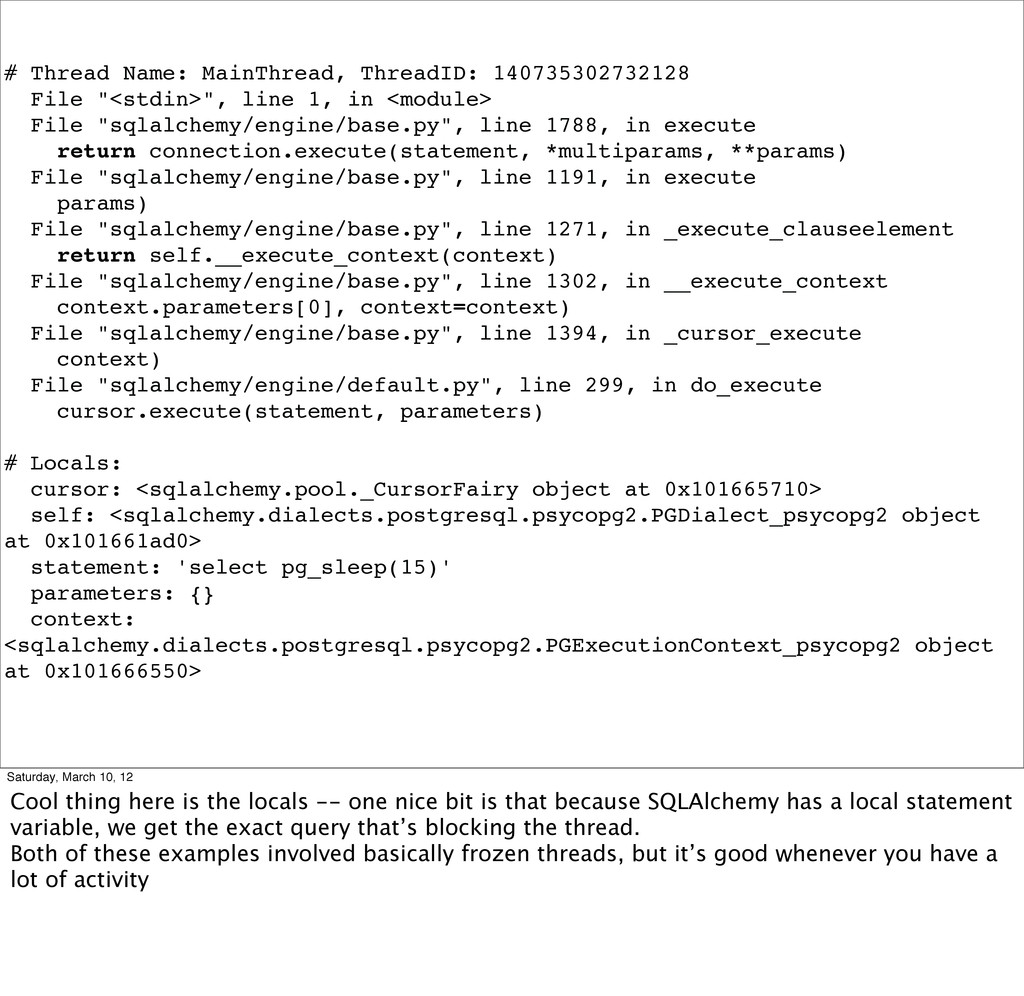
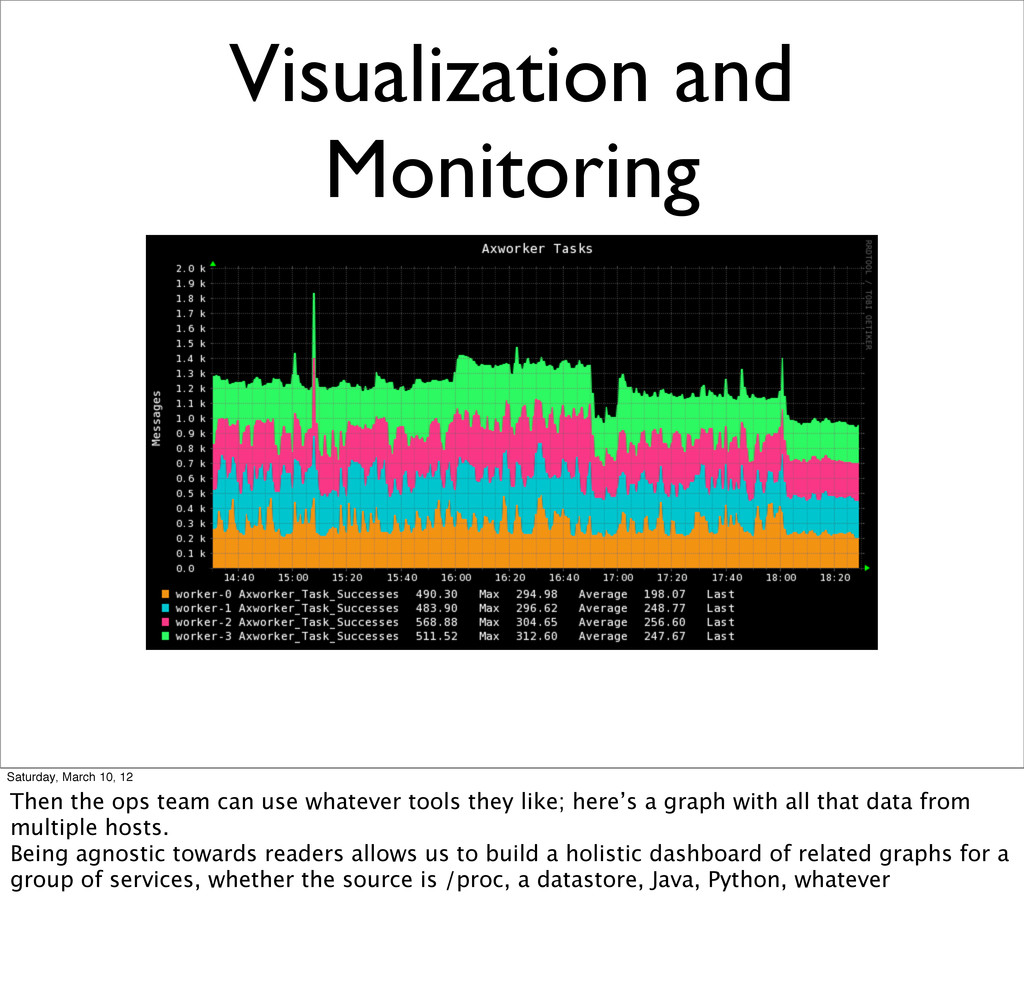
Understanding the internal state of a running system can be vital to maintaining a high performance, stable system, but conventional approaches such as logging and error handling only expose so much. This talk will touch on how to instrument Python programs in order to observe the state of the system, measure performance, and identify ongoing problems.

Adam Lowry

March 10, 2012
Tweet

More Decks by Adam Lowry

Other Decks in Programming

Transcript

  1. Saturday, March 10, 12 My name is Adam Lowry; I’m

    a co-founder and developer at Urban Airship. We provide services for mobile application developers.
  2. Saturday, March 10, 12 My colleague Michael Schurter (schmichael) unfortunately

    couldn’t be here with me, but he worked on this talk with me. You can trust him — look at that beard.
  3. Saturday, March 10, 12 Here’s a picture of Michael in

    a Columbian drug runner’s submarine.
  4. What is your application doing? Saturday, March 10, 12 With

    any application, but especially with high performance applications, you need to know what is going on. Tell me this: how do you know that your web application, say, is behaving as you expect? You have a monitor that hits it once a minute, you have logs and error email, but you don’t actually know. If everything ground to a halt without any change you made, could you identify the problem? It’s difficult, unless you instrument and expose internal data. All you can do is guess about the causes of “The Event”
  5. Logging • A stream of expected events • everything is

    persisted • process and search as needed Your application’s diary Saturday, March 10, 12
  6. Logging, but • Operational burden—storage, aggregation, searching • Records event,

    but can’t inspect related state • Difficult to predict what you need • Performance tradeoff with verbosity Saturday, March 10, 12 Slow request -- why was it slow? 500 -- did you store enough local vars to reproduce it Still vital for auditing, reference
  7. Breaking in through the back door • gdb-heap • eventlet’s

    backdoor module • Werkzeug debugger Spelunking the uncharted territory of your application’s process Saturday, March 10, 12 gdb-heap - dig into memory itself backdoor: a greenthread exposes REPL over telnet - interpreter at the state it was spawned Werkzeug debugger - useful only for development, gives you a detailed view (& repl!) of a single request/ exception Not for production use.
  8. JMX Saturday, March 10, 12 Java Management Extensions Any library

    or application can expose a set of interfaces Reading is not language agnostic, but adapter libraries can expose via HTTP and JSON Communication can be two way Traditionally used for resource consumption/system monitoring, but any application can make use of it
  9. jconsole Saturday, March 10, 12 jconsole is a GUI tool

    for visualizing & interacting JMX data Incredibly useful to point this at a production machine you’re concerned about This one’s doing pretty well
  10. jstack 2012-03-08 00:17:54 Full thread dump Java HotSpot(TM) 64-Bit Server

    VM (20.0-b11 mixed mode): "Attach Listener" daemon prio=10 tid=0x0000000058bd4000 nid=0x353f waiting on condition [0x0000000000000000] java.lang.Thread.State: RUNNABLE "558334662@qtp-103468119-1932" prio=10 tid=0x00002aaac8131800 nid=0x2e76 in Object.wait() [0x000000004ed3f000] java.lang.Thread.State: TIMED_WAITING (on object monitor) ! at java.lang.Object.wait(Native Method) ! at org.mortbay.thread.QueuedThreadPool $PoolThread.run(QueuedThreadPool.java:626) ! - locked <0x00000000f955c638> (a org.mortbay.thread.QueuedThreadPool$PoolThread) Saturday, March 10, 12 jstack is another useful tool—point it at a running JVM instance, and get a stack trace of all threads Not a very interesting trace here :) This is built into the runtime, accessible with a signal.
  11. metrics http://metrics.codahale.com/ METRICS METRICS EVERYWHERE Saturday, April 9, 2011 http://codahale.com/codeconf-2011-04-09-metrics-metrics-everywhere.pdf

    Saturday, March 10, 12 Tools for retrieving information are good, but good data requires good instrumentation. metrics is a library for instrumenting your application; all data is exposed via JMX It’s not just the tools, though — metrics, and this presentation from last year, represent a mindset that knowledge is crucial to operations Highly recommend you watch/read this presentation
  12. metrics Saturday, March 10, 12 Back to this view of

    JMX data -- these attributes are measurements from metrics Reports a particular set of calls and how long they’re taking with a variety of measurements you can get a much better idea of what’s really going on
  13. metrics Saturday, March 10, 12 One more little bit from

    jconsole -- my colleague lucky wanted you to see the OneMinuteRate graph. Click on the previous view, it starts graphing from this point.
  14. Approaches • New Relic • Graphite Saturday, March 10, 12

    Know that we have an idea of what we want, how can we get it? Two systems people using today are New Relic and Graphite New Relic is a hosted web application monitoring solution — highly recommend you look into it; I know a lot of the New Relic people are around the conference, so I hope they’ll do some demos Graphite is a scalable graphing system for time series data. It has a Python library for sending data to it from inside your application
  15. New Approaches Saturday, March 10, 12 Now I’d like to

    talk about a few ways Michael and I have been working on to instrument our Python applications.
  16. socketconsole Stack trace dumps for Python processes Saturday, March 10,

    12 The first is socketconsole, which is a terrible name. My apologies. I wanted jstack for Python. After talking with people in the #pdxpython IRC channel, some of them had tried a few different approaches at this. We have a mix of web servers and non-web services, and I wanted something that’d work the same on any of them. communication with the process is done over a unix socket -- one filename per process, so no fighting over names/ports/etc
  17. socketconsole goals • For multi-process and multi-threaded apps • Easy

    or no configuration • No fighting over HTTP ports • No unix signals Saturday, March 10, 12 multi-proc/thread -- we use mod_wsgi for our most important application. One server has many processes, each process has many threads no unix signals -- don’t want to trust that every single app and library handles interruptions correctly.
  18. import random import time import threading import socketconsole socketconsole.launch() def

    waiter(): some_value = random.randint(0, 1000) time.sleep(500) ts = [threading.Thread(target=waiter) for i in range(3)] for i, t in enumerate(ts): t.name = "thread-%d" % i t.daemon = True t.start() print "Started", t.name waiter() Saturday, March 10, 12 Example Start up the socketconsole thread (in a web app, a WSGI file that creates the application is a good place for this) This example starts up a few threads, each sleeping.
  19. (socketconsole)saison:socketconsole adam$ bin/socketreader # Thread Name: thread-2, ThreadID: 4315418624 File

    "lib/python2.6/threading.py", line 504, in __bootstrap self.__bootstrap_inner() File "lib/python2.6/threading.py", line 532, in __bootstrap_inner self.run() File "lib/python2.6/threading.py", line 484, in run self.__target(*self.__args, **self.__kwargs) File "example/sockdemo.py", line 11, in waiter time.sleep(500) # Locals: some_value: 160 # Thread Name: thread-1, ThreadID: 4312272896 File "lib/python2.6/threading.py", line 504, in __bootstrap self.__bootstrap_inner() File "lib/python2.6/threading.py", line 532, in __bootstrap_inner self.run() File "lib/python2.6/threading.py", line 484, in run self.__target(*self.__args, **self.__kwargs) File "example/sockdemo.py", line 11, in waiter time.sleep(500) # Locals: some_value: 298 # Thread Name: MainThread, ThreadID: 140735302732128 File "example/sockdemo.py", line 21, in <module> waiter() File "example/sockdemo.py", line 11, in waiter time.sleep(500) Saturday, March 10, 12 socketreader is a shortcut to communicating with each unix socket/proccess it finds, and outputting each thread paths edited for clarity
  20. SQLAlchemy example >>> import sqlalchemy, socketconsole >>> socketconsole.launch() >>> eng

    = sqlalchemy.connect("postgresql:///test") >>> eng = sqlalchemy.create_engine("postgresql:///test") >>> q = sqlalchemy.text("select pg_sleep(15)") >>> eng.execute(q) <sqlalchemy.engine.base.ResultProxy object at 0x101666610> Saturday, March 10, 12 If we do a little more work, we can see more use from it This script connects to a test postgres database and sleeps for a while (long enough for me to run socketreader :))
  21. # Thread Name: MainThread, ThreadID: 140735302732128 File "<stdin>", line 1,

    in <module> File "sqlalchemy/engine/base.py", line 1788, in execute return connection.execute(statement, *multiparams, **params) File "sqlalchemy/engine/base.py", line 1191, in execute params) File "sqlalchemy/engine/base.py", line 1271, in _execute_clauseelement return self.__execute_context(context) File "sqlalchemy/engine/base.py", line 1302, in __execute_context context.parameters[0], context=context) File "sqlalchemy/engine/base.py", line 1394, in _cursor_execute context) File "sqlalchemy/engine/default.py", line 299, in do_execute cursor.execute(statement, parameters) # Locals: cursor: <sqlalchemy.pool._CursorFairy object at 0x101665710> self: <sqlalchemy.dialects.postgresql.psycopg2.PGDialect_psycopg2 object at 0x101661ad0> statement: 'select pg_sleep(15)' parameters: {} context: <sqlalchemy.dialects.postgresql.psycopg2.PGExecutionContext_psycopg2 object at 0x101666550> Saturday, March 10, 12 Cool thing here is the locals -- one nice bit is that because SQLAlchemy has a local statement variable, we get the exact query that’s blocking the thread. Both of these examples involved basically frozen threads, but it’s good whenever you have a lot of activity
  22. mmstats A simple way to expose metrics, statistics, and arbitrary

    data in an easy to consume format. Writing is framework agnostic Reading is language agnostic “The /proc filesystem for your application.” Saturday, March 10, 12 mmstats is a library written by Michael Schurter/schmichael, to provide a subset of what JMX might be used for.
  23. What • mmap allows sharing memory between processes • Language

    independent data structure: • Series of fields (structs) • Fields have label, type, and values • Exposed in Python app as a model class Saturday, March 10, 12 mmstats exposes a memory mapped file for each process, and provides a reader that can pull it out.
  24. Goals • Simple API • Minimal & predictable performance impact

    • Separate reading & writing Saturday, March 10, 12 separating reading & writing is most useful in a heterogeneous environment
  25. Details • Single writer, multi-reader • No locks • No

    syscalls (write, read, send, recv, etc.)* • All in userspace for readers & writers* • Reading has no impact on writers • Fixed field sizes Saturday, March 10, 12 single writer/no locks, means a mmap file per thread instrumentation should not cost too much application performance You are doing more work, but you need to be reasonable
  26. import random import time import mmstats class ProgressStats(mmstats.BaseMmStats): count =

    mmstats.UIntField(label="counter.count") errors = mmstats.UIntField(label="counter.errors") last_sleep = mmstats.FloatField(label="counter.last_sleep") status = mmstats.StringField(label="counter.status") stats = ProgressStats(path=".", filename="progress-stats") for i in range(0, 1000): stats.count += 1 stats.status = "Up to %d, %d more to go" % (i, 1000 - i) stats.last_sleep = random.random() time.sleep(stats.last_sleep) Saturday, March 10, 12
  27. saison:mms adam$ bin/slurpstats progress-stats ==> progress-stats counter.count 144 counter.status Up

    to 143, 857 more to go counter.last_sleep 0.294649809599 counter.errors 0 saison:mms adam$ bin/pollstats "counter.count,counter.errors" progress-stats counter.count | counter.errors 50 | 0 2 | 0 2 | 0 2 | 0 1 | 0 1 | 0 5 | 0 1 | 0 1 | 0 2 | 0 2 | 0 Saturday, March 10, 12 pollstats shows the difference between counters once a second Both of these are pretty useful for one-offs, as well. Next time you write a data munging script that might take a few hours to run, take a few minutes and expose some metrics. It’s much better than hoping you got your periodic print statements right.
  28. mmash Saturday, March 10, 12 mmash -- web server; give

    it a settings file with locations of mmstats files exposes all found metrics There are also some built in aggregations for multiple processes
  29. Visualization and Monitoring Saturday, March 10, 12 We use Icinga/Nagios

    for monitoring and pnp4nagios to graph a lot of that data This check pulls that aggregated sum from the previous slide
  30. Visualization and Monitoring Saturday, March 10, 12 Then the ops

    team can use whatever tools they like; here’s a graph with all that data from multiple hosts. Being agnostic towards readers allows us to build a holistic dashboard of related graphs for a group of services, whether the source is /proc, a datastore, Java, Python, whatever
  31. What’s next? • More fields • More measurement styles •

    More readers • Examples and plugins for common libraries • Unified web interface Saturday, March 10, 12 What’s next for mmstats? expansion along the current lines, exposing more kinds of data Unified web interface with a simple configuration so you could drop it on a server and point it at your mmstats and socketconsole locations
  32. Parallel effort Scales: https://github.com/Greplin/scales/ pystuck: https://github.com/alonho/pystuck Your internal tools? Saturday,

    March 10, 12 Scales is a parallel effort by the Greplin team, and it’s come a long way. It supports a variety of metrics, and data is exported either by an in-process web server or by periodically pushing to Graphite Primary difference in philosophy is that it does require more locking and a thread/port per process Lots to learn from here, highly recommend checking it out pystuck -- just learned about this today!
  33. Call to Action http://groups.google.com/group/python- introspection Sprinting on Monday and Tuesday

    https://github.com/robotadam/socketconsole https://github.com/schmichael/mmstats Saturday, March 10, 12 This is a practical problem, and many of us have solved portions of it in different ways. We want to learn from each other and build a set of tools and practices to make these solutions straightforward, and easy to integrate. This should be the default. We need this It’s within our reach Take a minute to join this mailing list and consider coming by to the sprints on Monday and Tuesday. I’ll be there, and schmichael will be sprinting remotely on Monday.
  34. Thanks! Adam Lowry [email protected] [email protected] @robotadam Michael Schurter [email protected] [email protected]

    @schmichael http://urbanairship.com/jobs http://groups.google.com/group/python-introspection Saturday, March 10, 12