Upgrade to Pro — share decks privately, control downloads, hide ads and more …

The Recommendation Conundrum - Spree Conference

sailthru
February 21, 2012

The Recommendation Conundrum - Spree Conference

sailthru

February 21, 2012
Tweet

More Decks by sailthru

Other Decks in Technology

Transcript

  1. Why Recommendations? Email Response Rates Customer Acquisition Average Order Value

    Purchase Frequency Customer Lifetime Value Revenue Bottom Line: Boost ROI
  2. How they’re built? Collaborative - User Based. “People like you

    like…” Content - Feature Based. “Other music like this…” Contextual - Action Based. “You viewed x, you might also want to view a similar item.” Most choose one of three frameworks – or a hybrid
  3. Data Collection Explicit (actively given) - Purchase history - Likes/Reviews

    - Preferences indicated (e.g. wish lists) Implicit (behavioral) - Clickstream - Abandoned cart - Geolocation - Frequency of visits They define the data set they wish to collect
  4. Algorithms They build a model to predict behavioral outcomes Define

    the variables and desired outcome Assign a weight to the variables Develop a propensity score (likelihood to buy X or click on Y) Test
  5. Best Case Example Customer A’s Data: - Items purchased: The

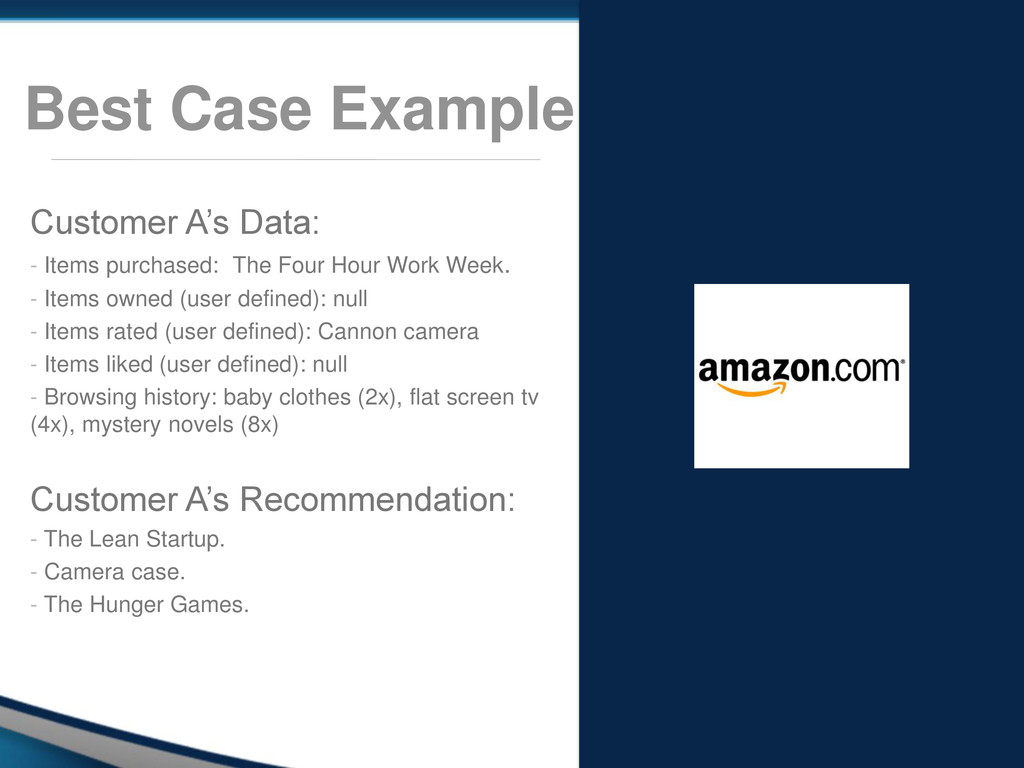
    Four Hour Work Week. - Items owned (user defined): null - Items rated (user defined): Cannon camera - Items liked (user defined): null - Browsing history: baby clothes (2x), flat screen tv (4x), mystery novels (8x) Customer A’s Recommendation: - The Lean Startup. - Camera case. - The Hunger Games.
  6. Why? Garbage in, Garbage out. Imperfect Data - Linking customer

    behavior across channels is a challenge. - Lack of scalable data to create valid propensity scores. - Expiring cookies causing gaps in information - 3rd party cookies don’t provide all data
  7. The Result Segments based on Look-Alikes Reliance on: • 3rd

    Party Demographic Data (Age, Gender, Location, Income level, etc) • Explicit Data • Merchandising strategy
  8. The Interest Graph Focus on Their Behavior Psychographic data -

    Frequency of clicks/opens/ site visits - Time of day/year they purchase vs. look - Device used - Items viewed/clicked - Frequency of items viewed - Purchases made - Abandoned purchases
  9. How? Build for the Individual Create a Unique Identifier -

    email address Primary Cookies - appended to email address for security Develop a Behavioral propensity model - reduce reliance on demographic variables
  10. Leverage Data Across All Channels TREAT customers holistically by talking

    with them across email, website, mobile and social. GIVE them a reason to come back to you How?
  11. How? Respect Your Users LISTEN to where and when they

    respond to you TRANSLATE it into meaningful actions RESPOND to each individual appropriately