“What should I work on next?” Code metrics can help you answer that question. They can single out sections of your code that are likely to contain bugs. They can help you get a toehold on a legacy system that’s poorly covered by tests.
group of us—me, plus two major contributors to the Cucumber test framework—are working on a new book of specific testing techniques. Ruby and its various test frameworks were my gateway drug to code metrics, though for this talk we’ll be concentrating on other languages.
changes slowly. Software needs to last, and it tends to last whether we wish for a rewrite or not. Our team’s exploration of this mix of old and new code led to our interest in code metrics.
❥ Apathy drags us down There are a lot of forces that push on us and our teams. Today, I want to talk about two very different forces that have surprisingly similar effects: the entropy that drags our code down over time, and the apathy that drags us down personally over time.
How do we keep our interest after our tenth straight hour wading into the weeds of an incomprehensible legacy routine? How do we prevent the code we write today from being someone’s nightmare tomorrow?
have more fun We have many tools in our chest; one is a good set of metrics—information about our code base. My hope is that you’ll consider code metrics at least as an intriguing, low-cost possibility for making the day go by a little better.
or lead us to cause harm The risk with doing this—and there’s always a risk—is that we might waste our time making changes we don’t need, or worse, end up trashing our code in the name of blindly satisfying some target number.
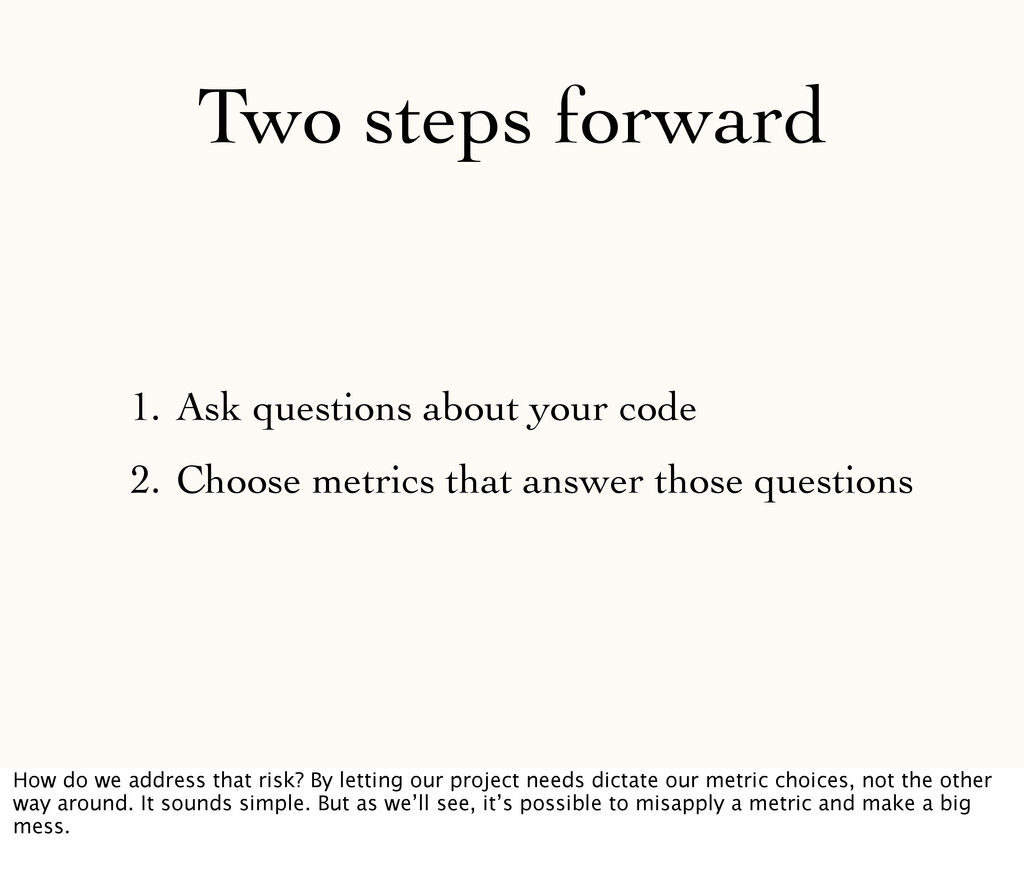
Choose metrics that answer those questions How do we address that risk? By letting our project needs dictate our metric choices, not the other way around. It sounds simple. But as we’ll see, it’s possible to misapply a metric and make a big mess.
of any metric should be to help you answer a question. Since we’re developers who maybe also do a little testing, let’s ask a few example questions now.
your brain Something else may be giving us guidance on what part of the code to work in—like the product backlog. But you may be in a situation where you’ve got a little more leeway, like an explicit charter to pay down technical debt.
expose existing ones) That said, when you do wander off the map, you do risk creating a bug. With legacy code, you may also uncover an existing bug and get the blame nonetheless. One way to address this risk is to improve your test coverage, and make small changes at a time. Another is to choose the right metrics; fixing static analysis warnings has anecdotally been one of the lowest-risk change activities I’ve ever seen.
Here’s another question we might ask. Where are the bugs? Where are the old bugs we haven’t found yet? Where are the new ones we might have created recently?
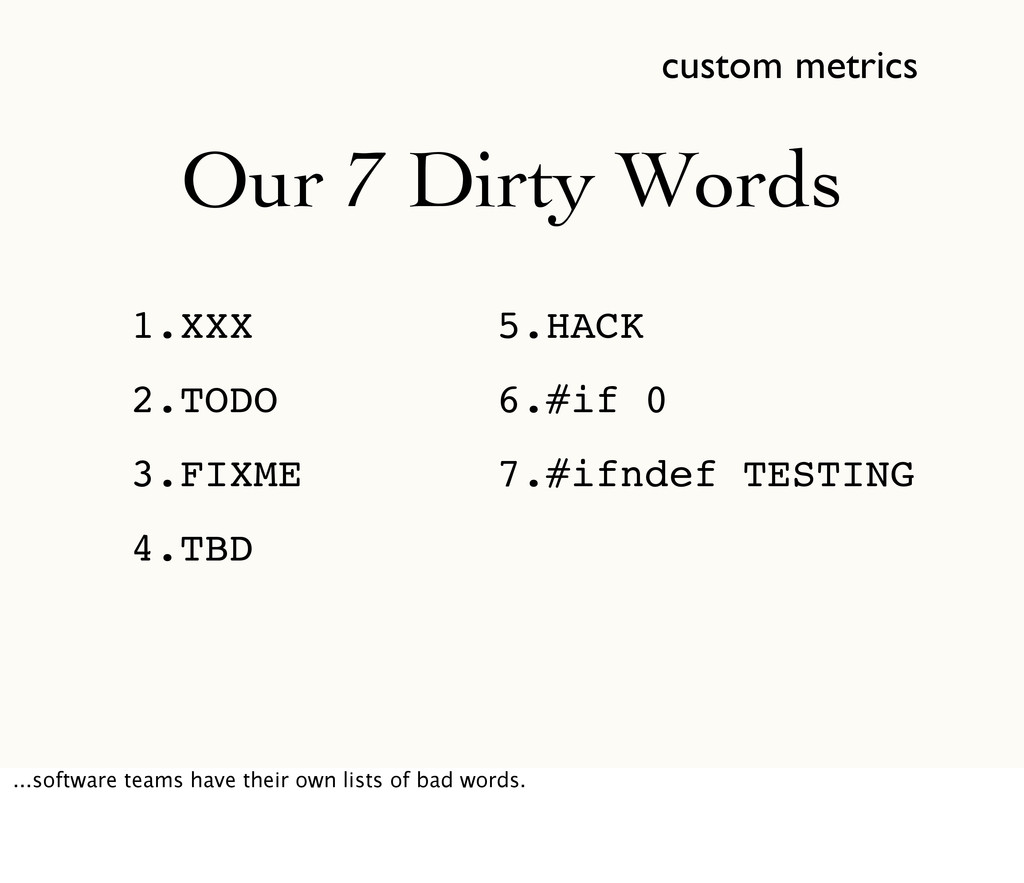
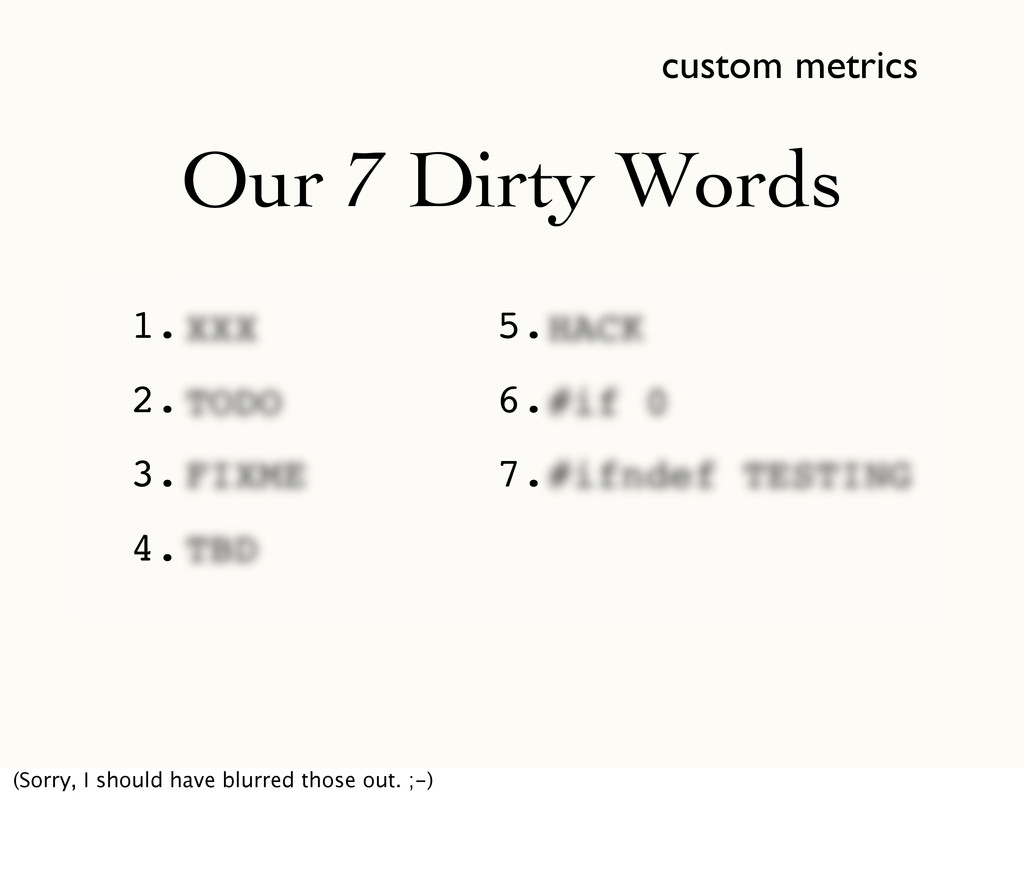
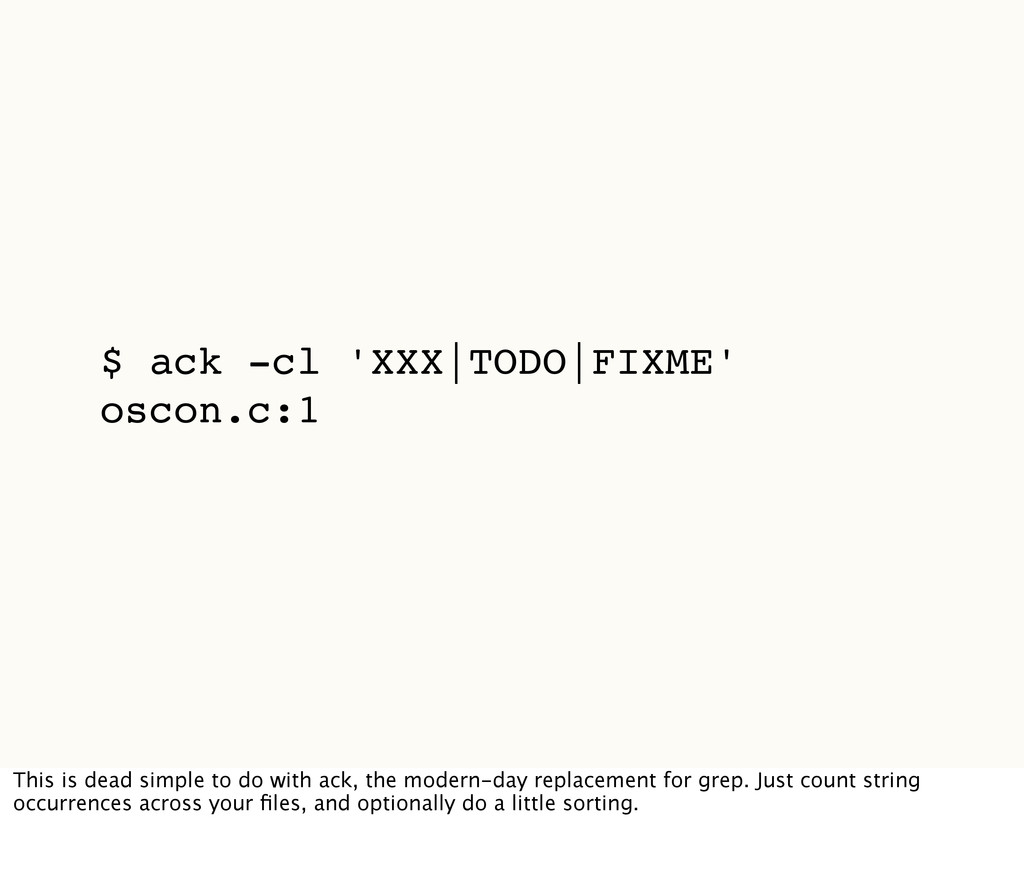
WE SHIP! */ We can also turn to our code for ideas of what questions to ask. Has anyone seen something like this comment in production code? The number of these red flags in your code is a kind of code metric you can measure and reduce.
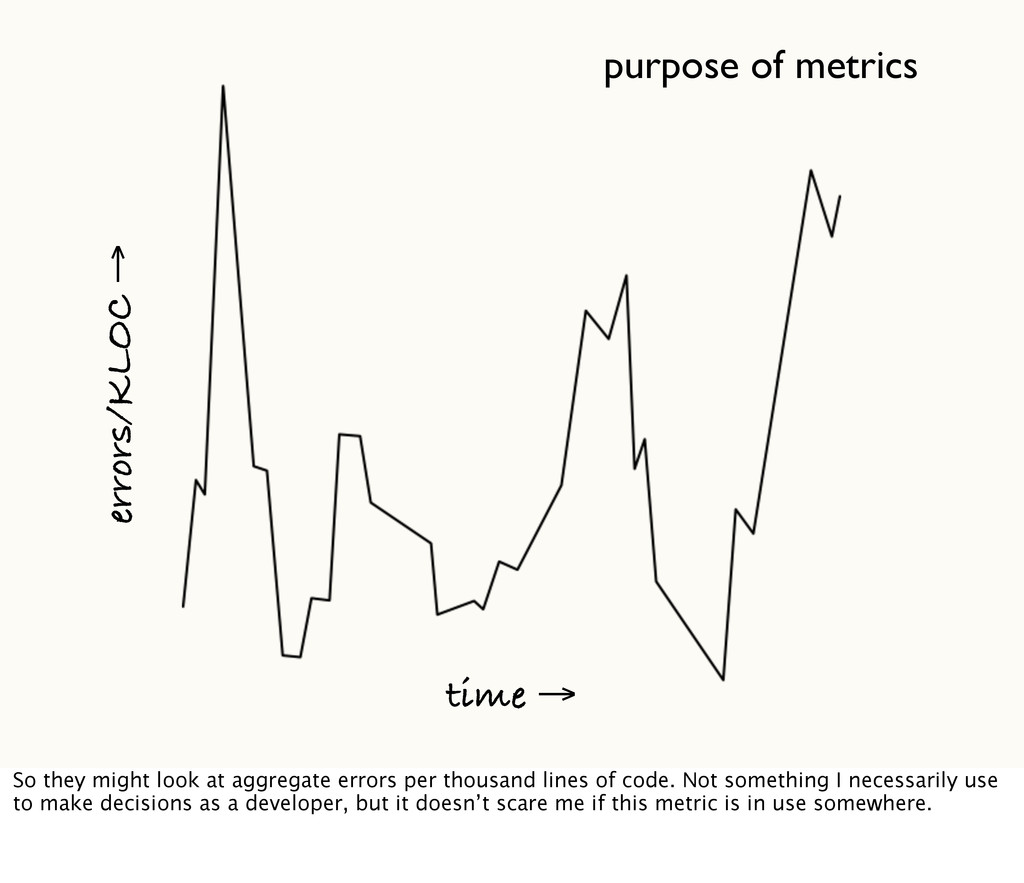
look at aggregate errors per thousand lines of code. Not something I necessarily use to make decisions as a developer, but it doesn’t scare me if this metric is in use somewhere.
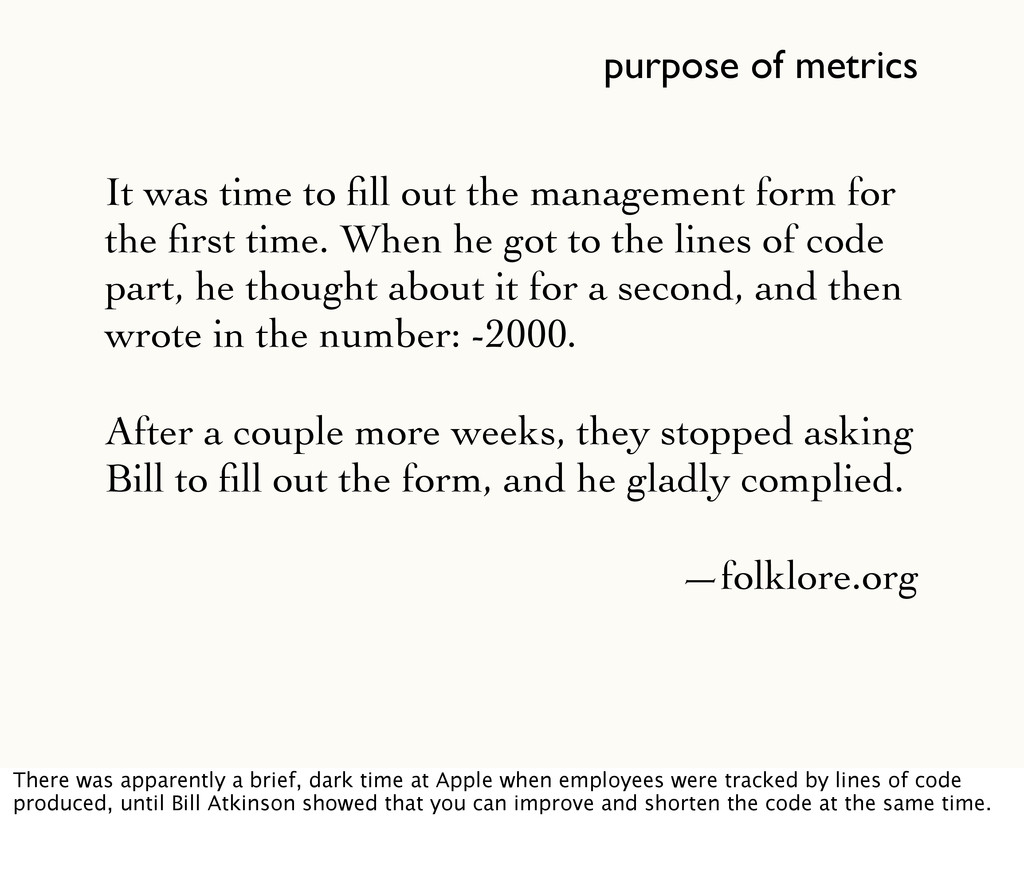
management form for the first time. When he got to the lines of code part, he thought about it for a second, and then wrote in the number: -2000. After a couple more weeks, they stopped asking Bill to fill out the form, and he gladly complied. —folklore.org There was apparently a brief, dark time at Apple when employees were tracked by lines of code produced, until Bill Atkinson showed that you can improve and shorten the code at the same time.
addition to answering specific questions about our projects, they can make coding seem a little bit like a game where the side effect is to produce better code...
We have to be careful not to spend all day writing fancier shell scripts and slapping our stats onto elaborate dashboards (though there are quick-and-cheap dashboards I like; see the Tranquil project).
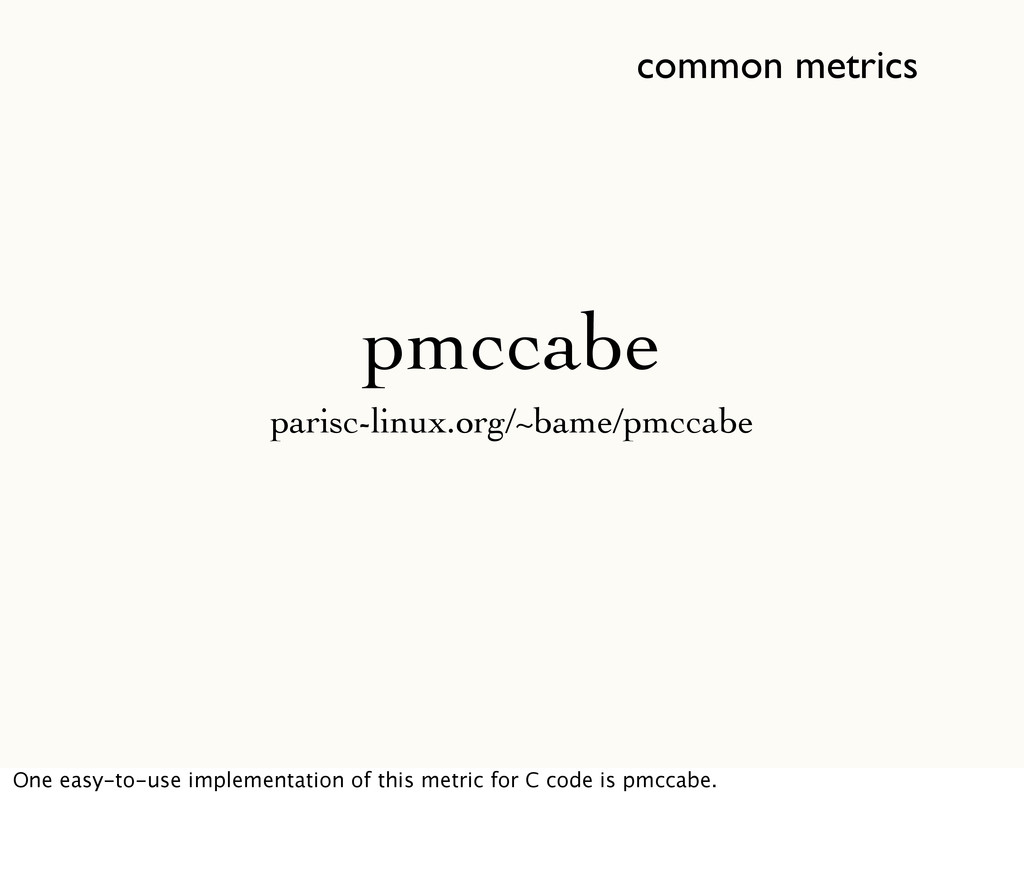
mind about our code base, let’s look at some metrics commonly used by many projects. (Later, we’ll look at writing our own.) The nice thing about prefab metrics is that we can find open source implementations and supporting research.
the beginner’s experience ❥ <your lang> just ask! Rather than present you with a laundry list, I’m going to stick to a few targeted examples in C and Perl. But similar tools likely exist for your language; catch me in the hall afterwards if you’d like to explore that together.
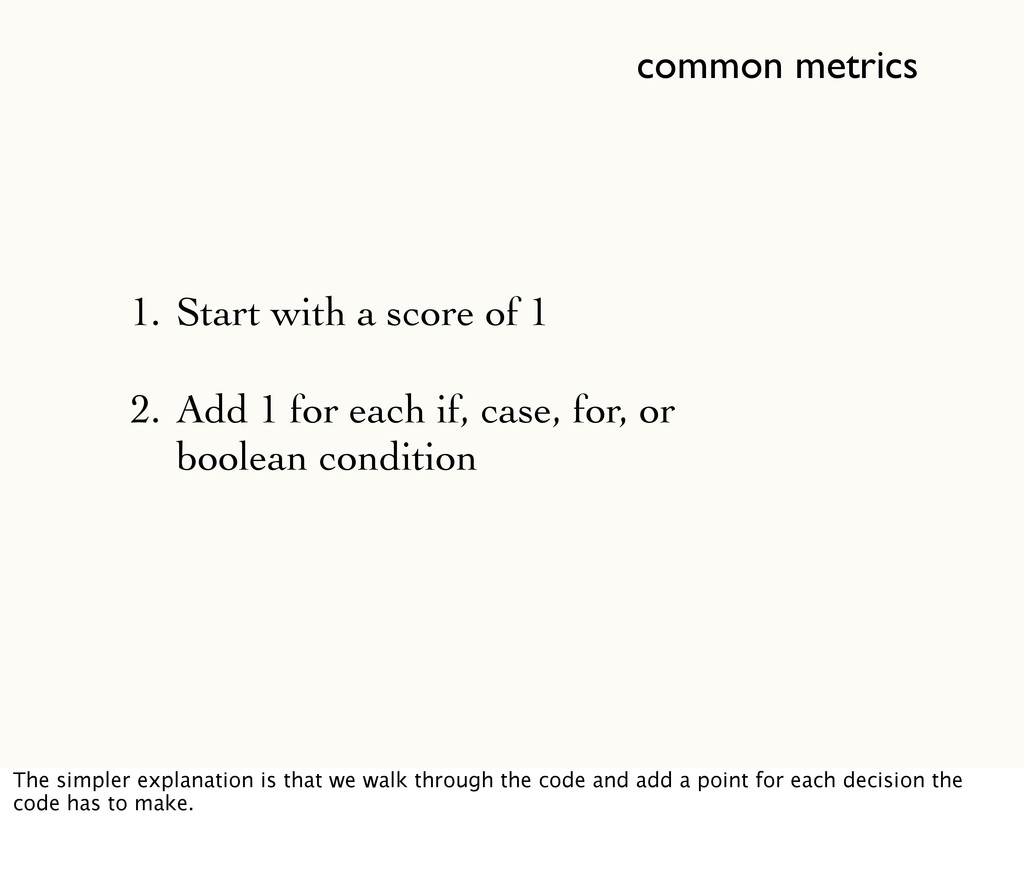
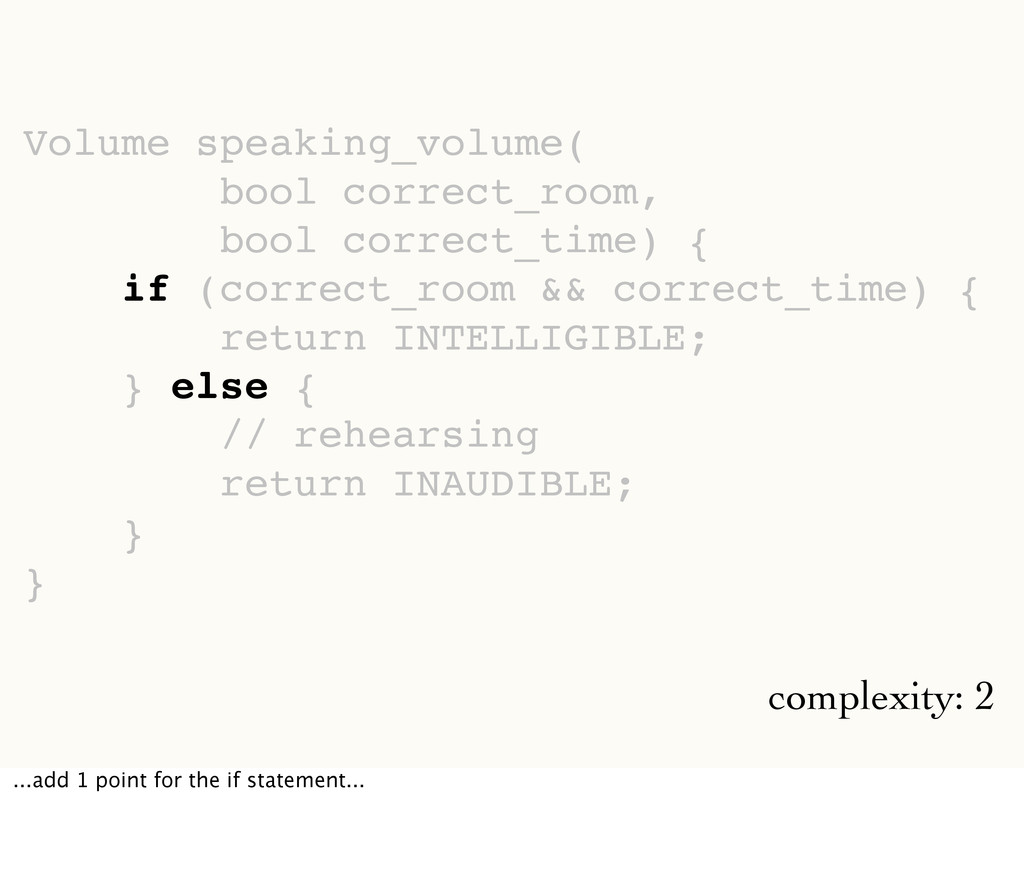
Add 1 for each if, case, for, or boolean condition The simpler explanation is that we walk through the code and add a point for each decision the code has to make.
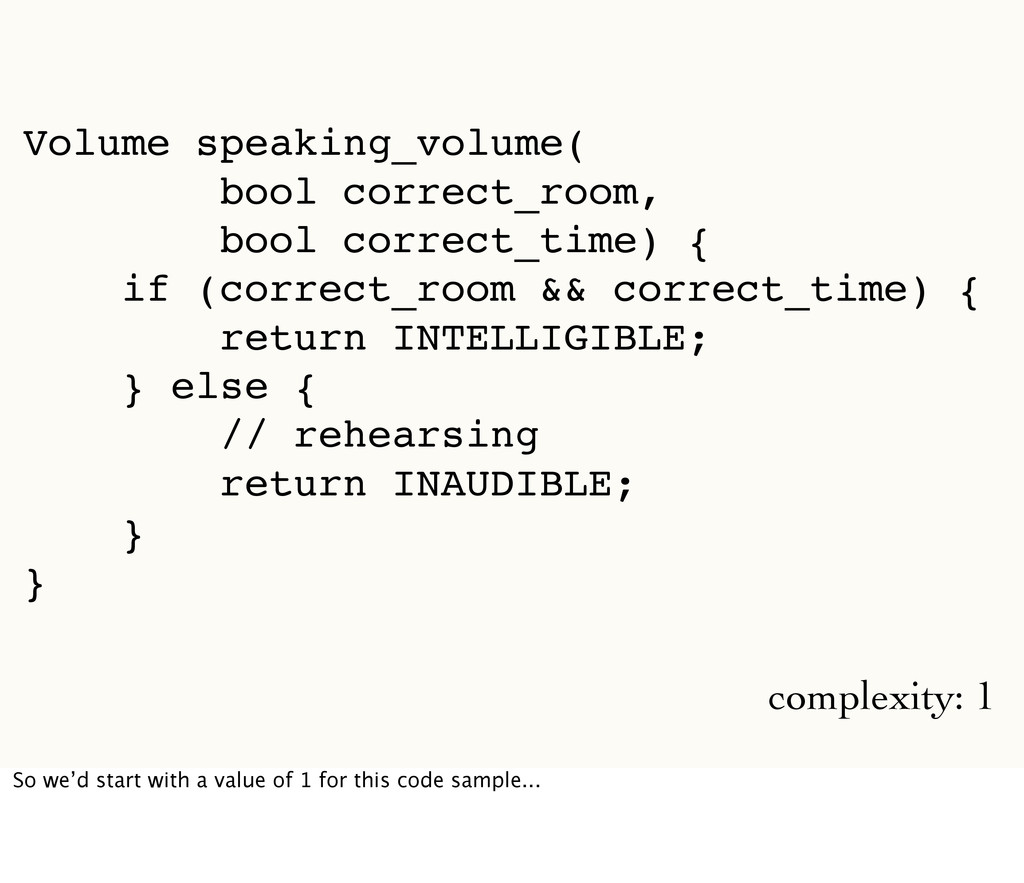
correct_time) { return INTELLIGIBLE; } else { // rehearsing return INAUDIBLE; } } complexity: 1 So we’d start with a value of 1 for this code sample...
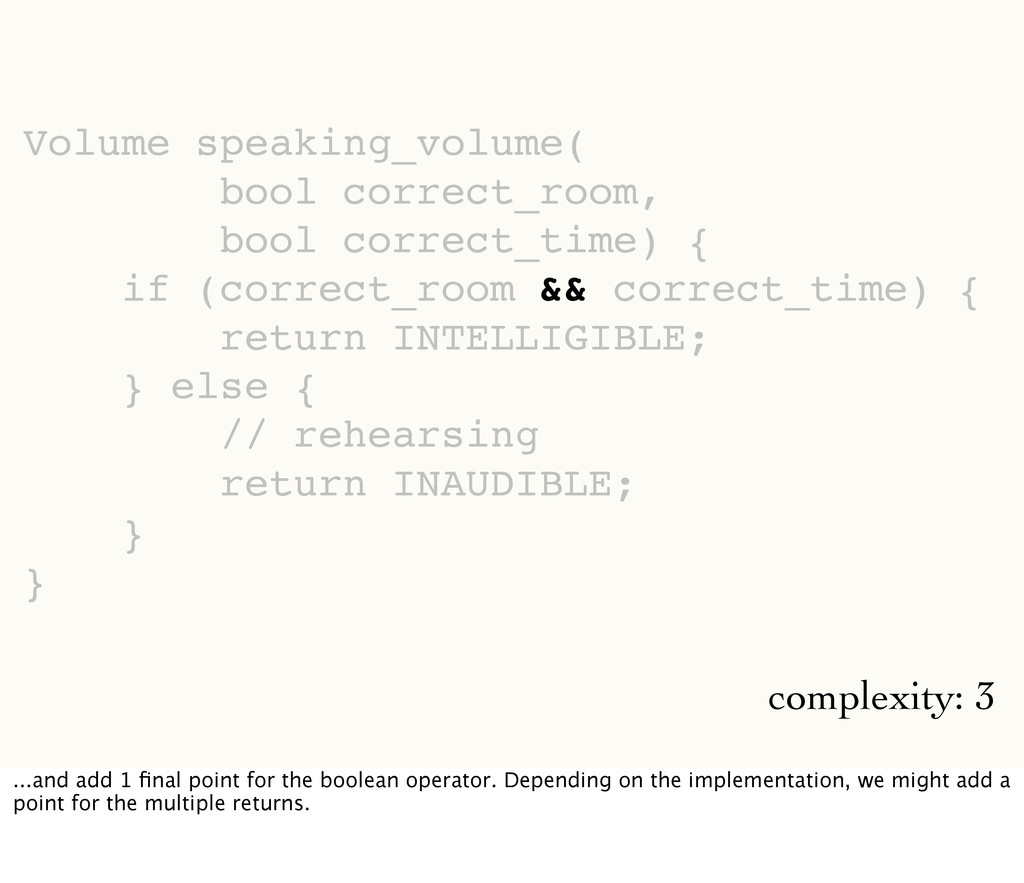
correct_time) { return INTELLIGIBLE; } else { // rehearsing return INAUDIBLE; } } complexity: 3 ...and add 1 final point for the boolean operator. Depending on the implementation, we might add a point for the multiple returns.
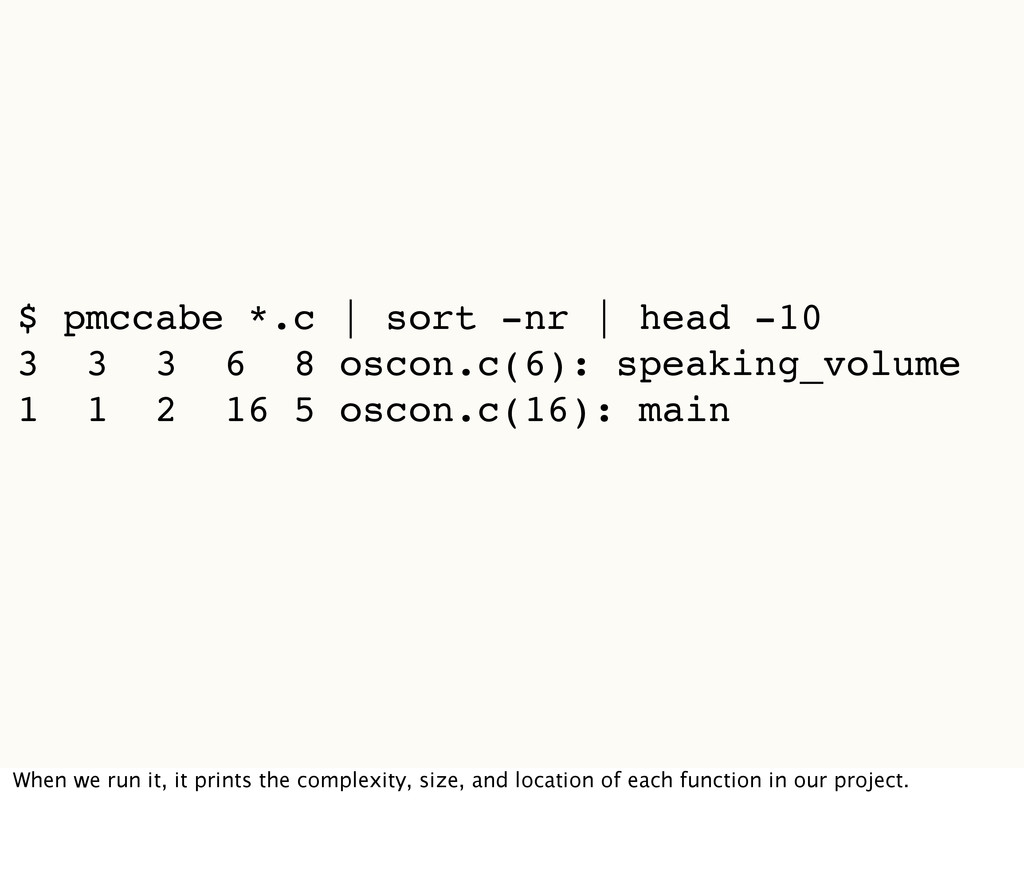
3 3 6 8!oscon.c(6): speaking_volume 1 1 2 16 5!oscon.c(16): main When we run it, it prints the complexity, size, and location of each function in our project.
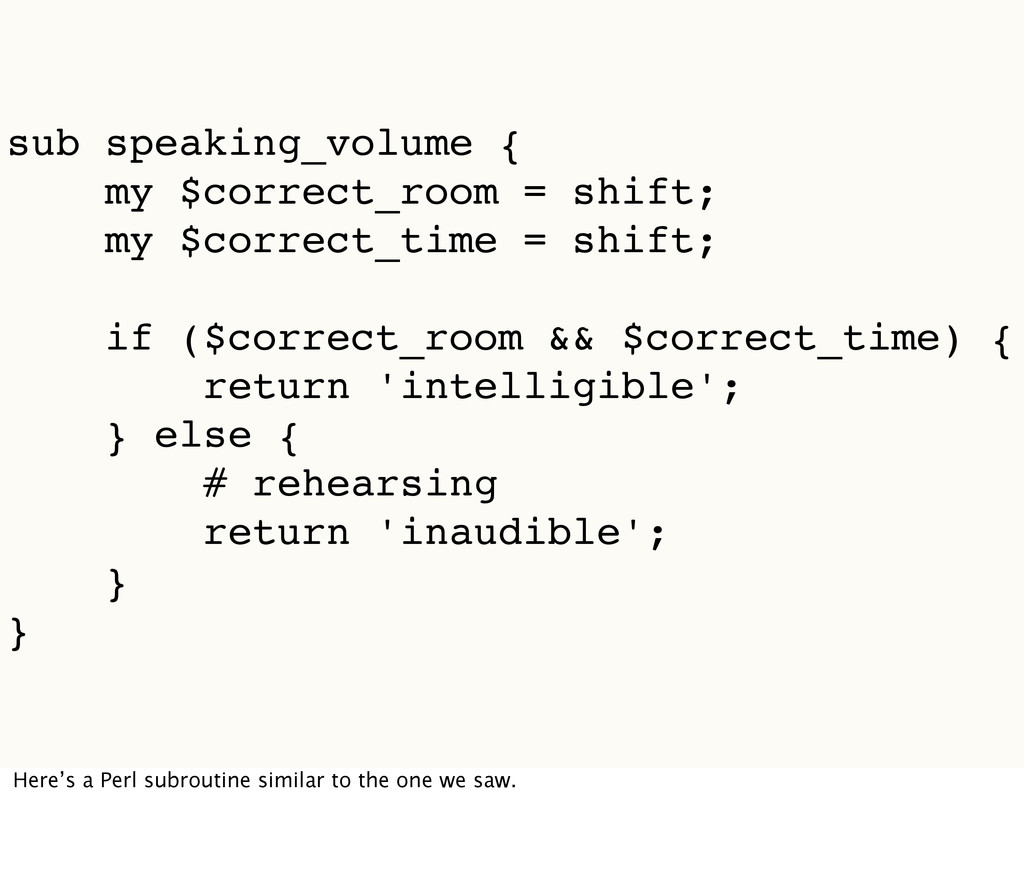
shift; if ($correct_room && $correct_time) { return 'intelligible'; } else { # rehearsing return 'inaudible'; } } Here’s a Perl subroutine similar to the one we saw.
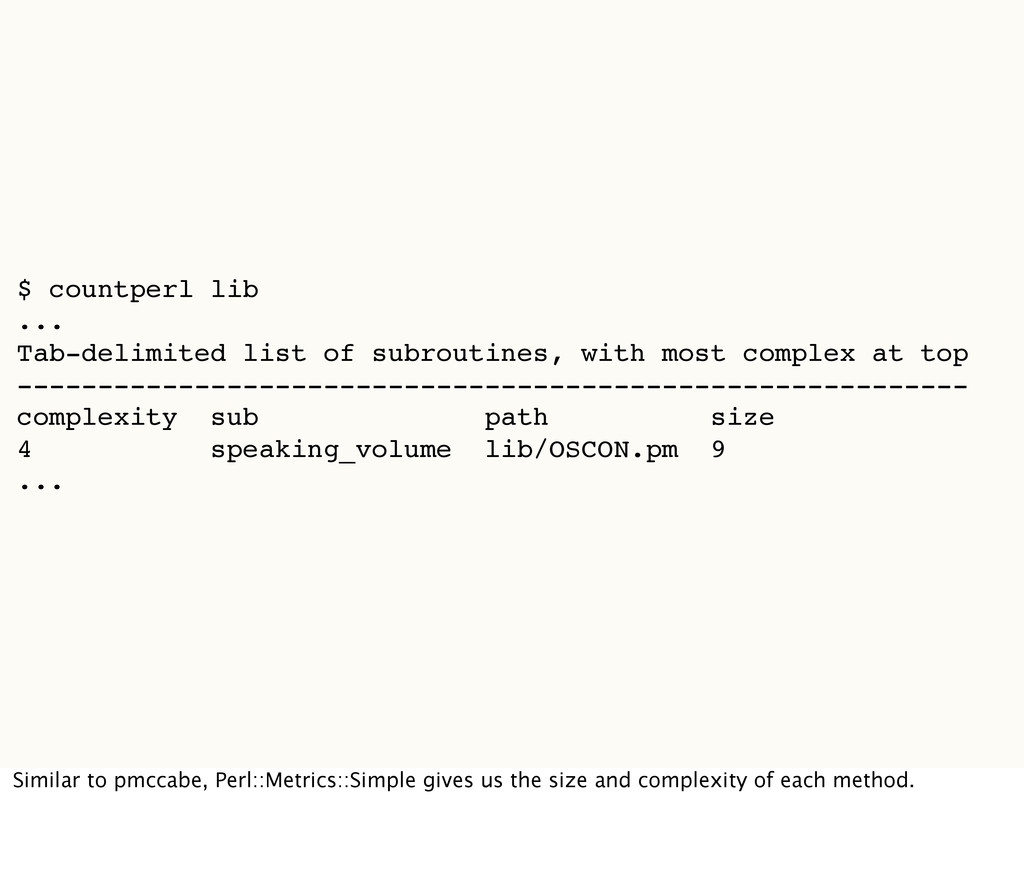
complex at top ----------------------------------------------------------- complexity sub path size 4 speaking_volume lib/OSCON.pm 9 ... Similar to pmccabe, Perl::Metrics::Simple gives us the size and complexity of each method.
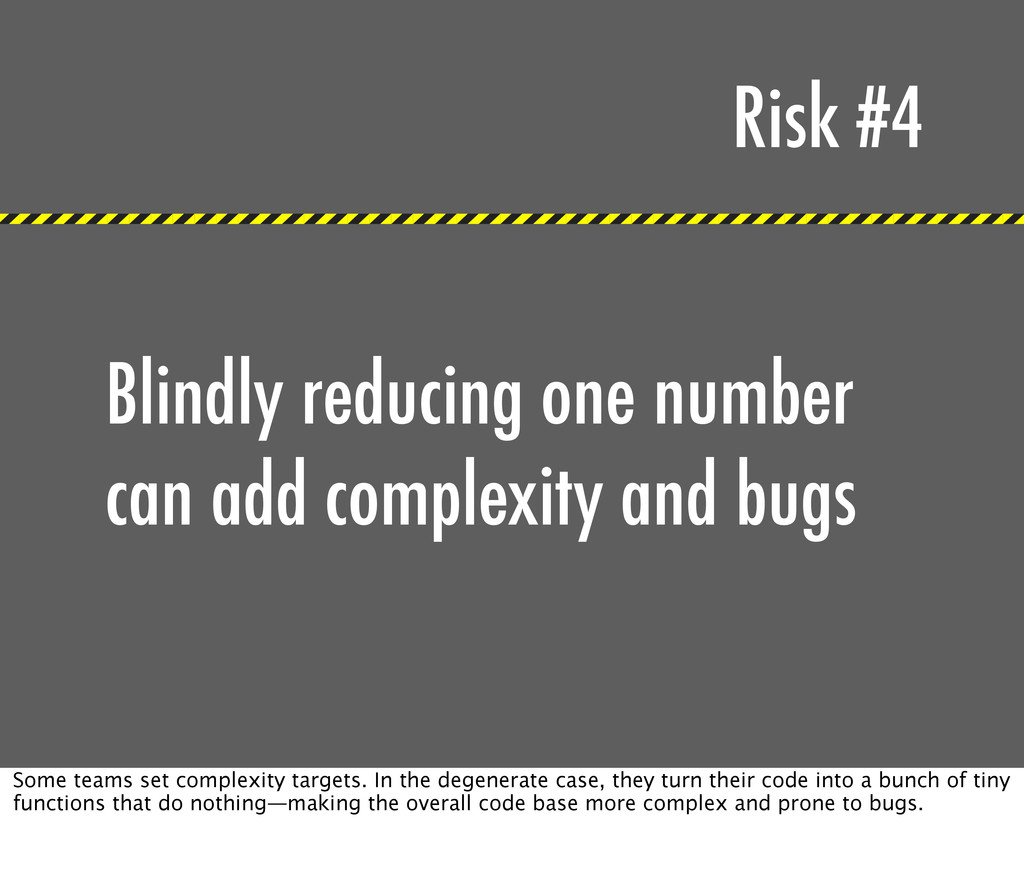
consider cyclomatic complexity alone (and there were other issues dealt with in subsequent papers by other authors), but we should always be skeptical of our own metrics. Fortunately, most tools give us both a line count and a complexity metric; we can decide for ourselves.
bugs Some teams set complexity targets. In the degenerate case, they turn their code into a bunch of tiny functions that do nothing—making the overall code base more complex and prone to bugs.
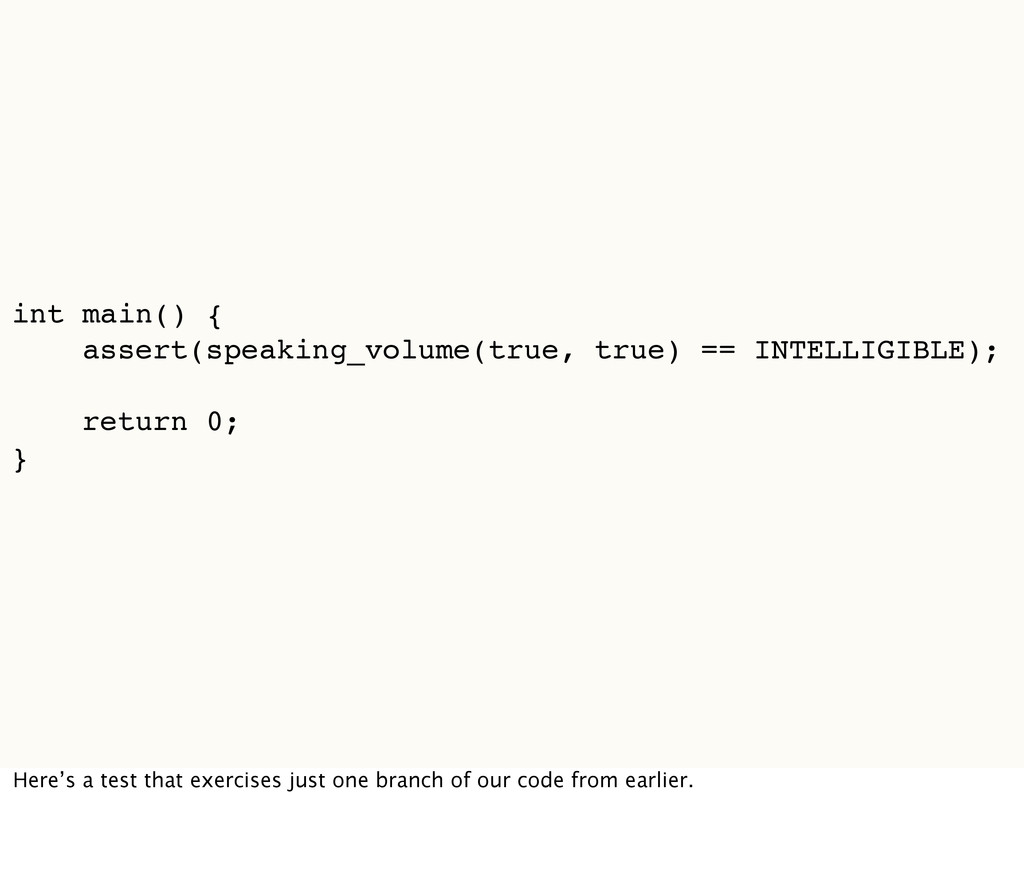
coverage helps address the “epic confidence” problem that Laura Thomson described in her Open Source Bridge talk, “How Not To Release Software.” Teams afflicted by this bug assert without evidence that their tests are great.
combating hubris, measuring coverage helps us make our code more testable. Testability is not an end in itself, but a property with beneficial side effects.
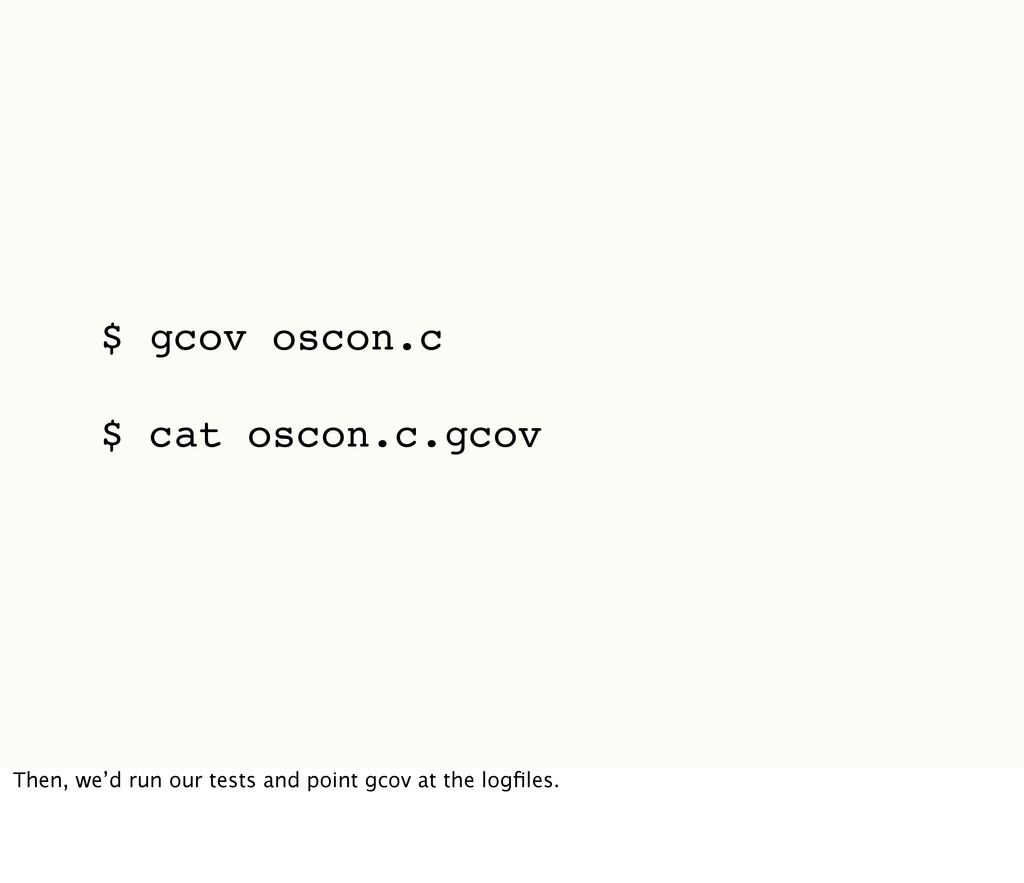
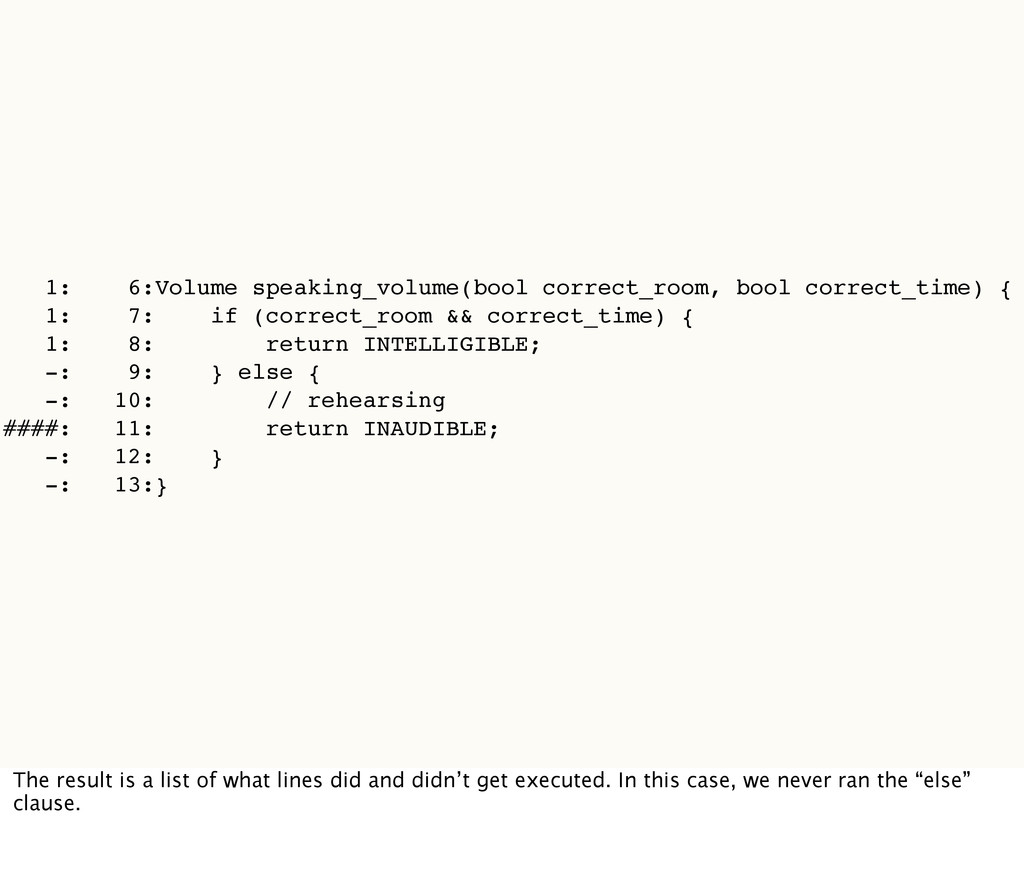
(correct_room && correct_time) { 1: 8: return INTELLIGIBLE; -: 9: } else { -: 10: // rehearsing ####: 11: return INAUDIBLE; -: 12: } -: 13:} The result is a list of what lines did and didn’t get executed. In this case, we never ran the “else” clause.
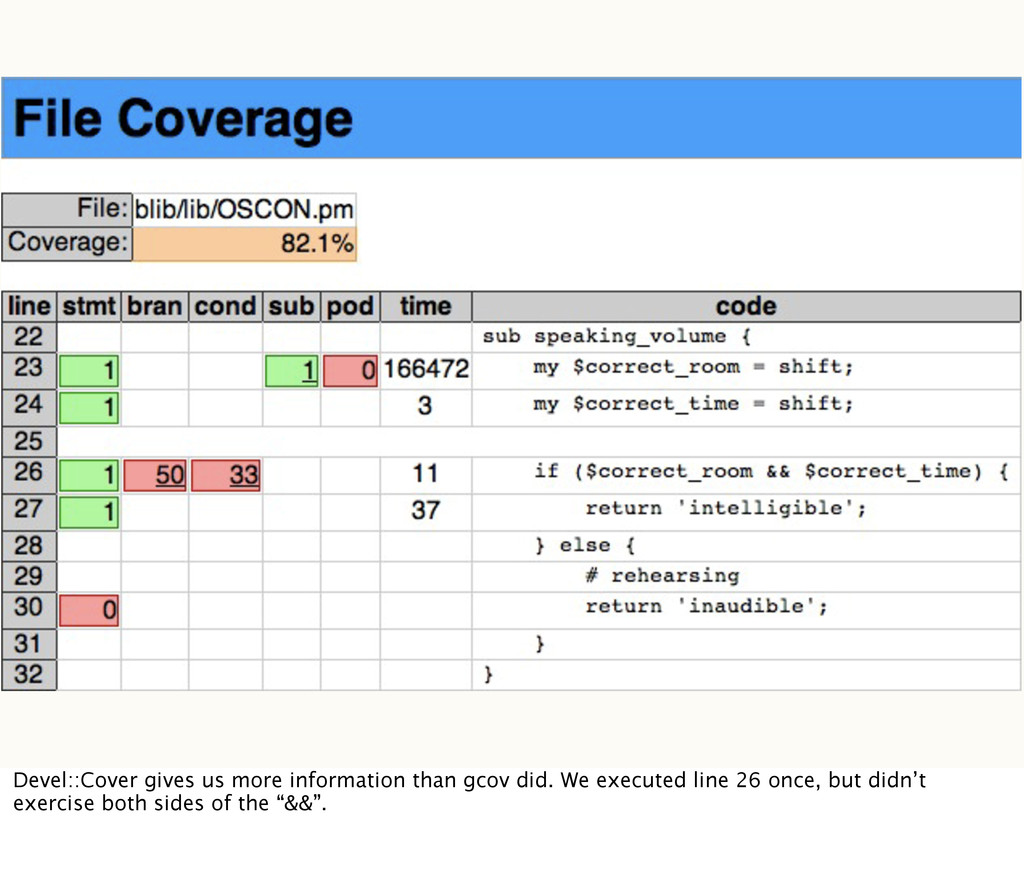
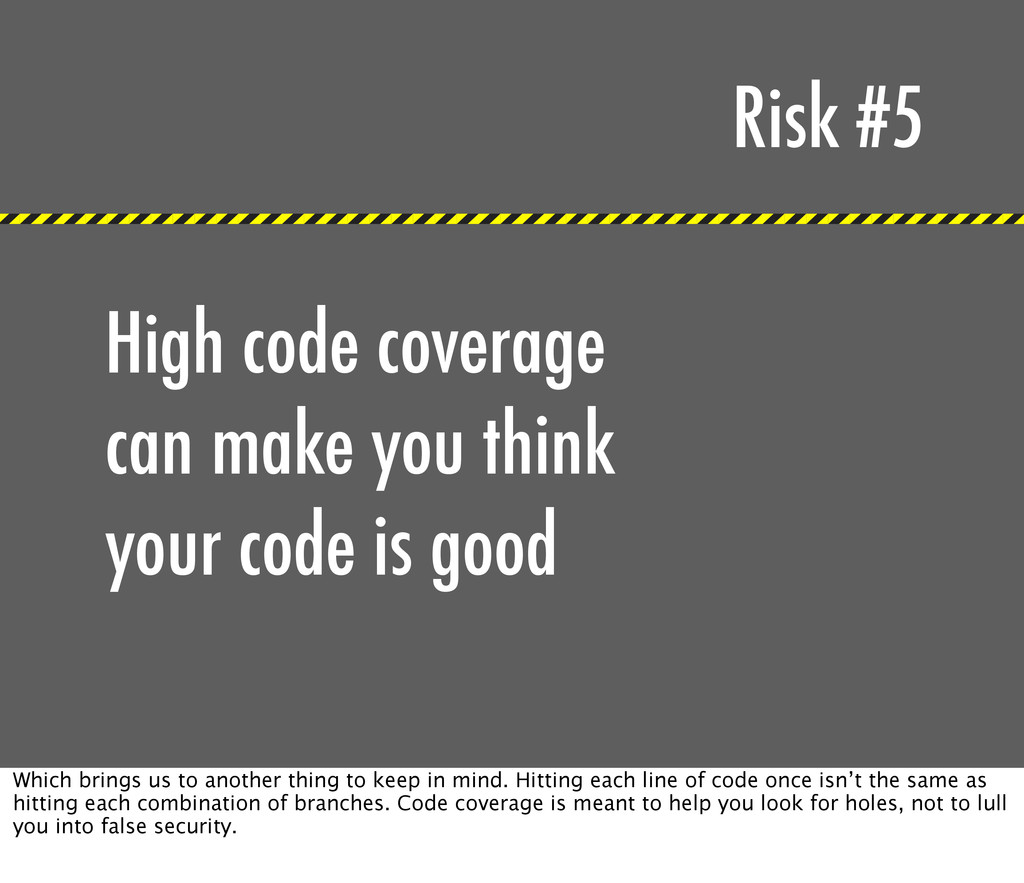
code is good Which brings us to another thing to keep in mind. Hitting each line of code once isn’t the same as hitting each combination of branches. Code coverage is meant to help you look for holes, not to lull you into false security.
good support. The downside is lack of context; the creators of those metrics have nowhere near the knowledge of your project that you do. So you may want to supplement common metrics with a few of your own. I can’t tell you what those metrics are, but I can tell you a couple of the ones I’ve seen used.
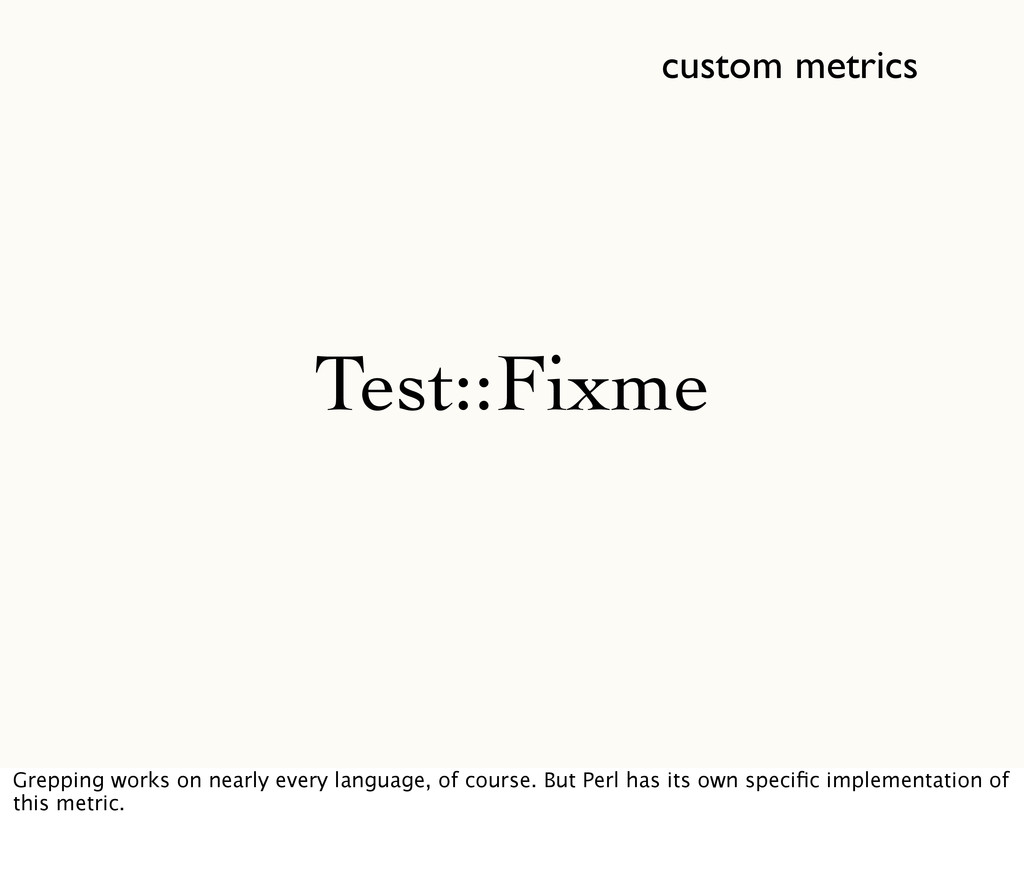
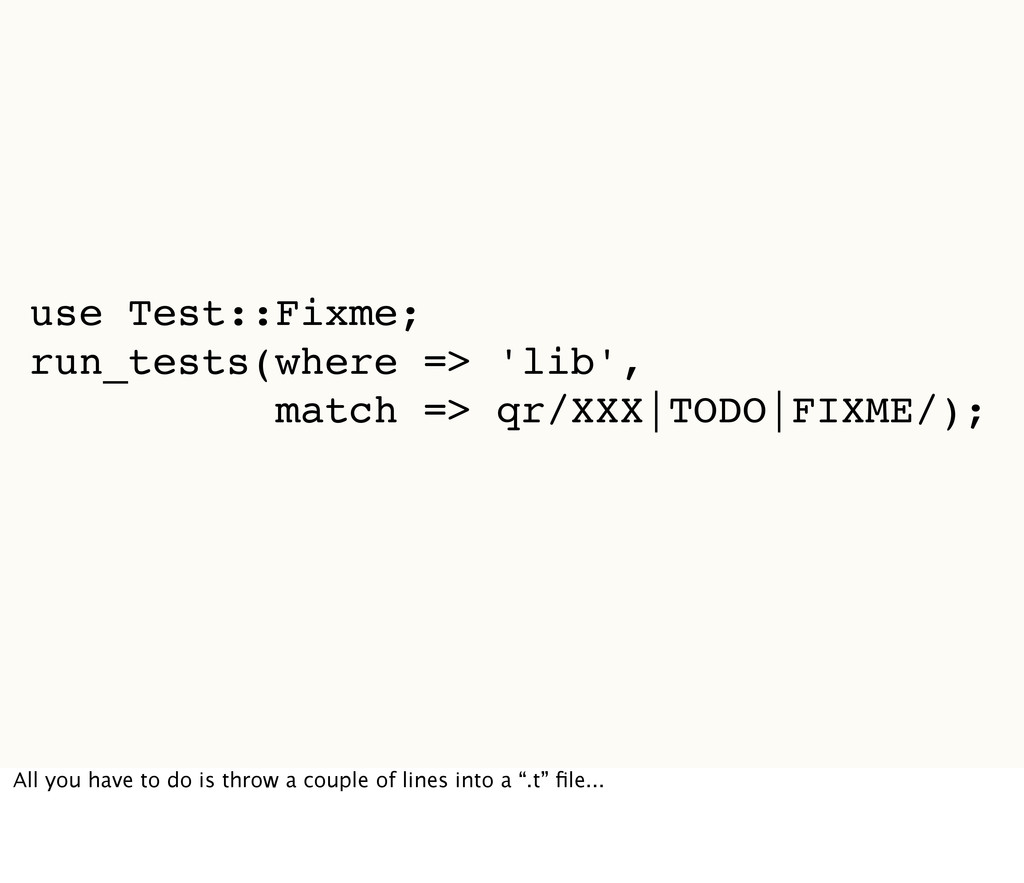
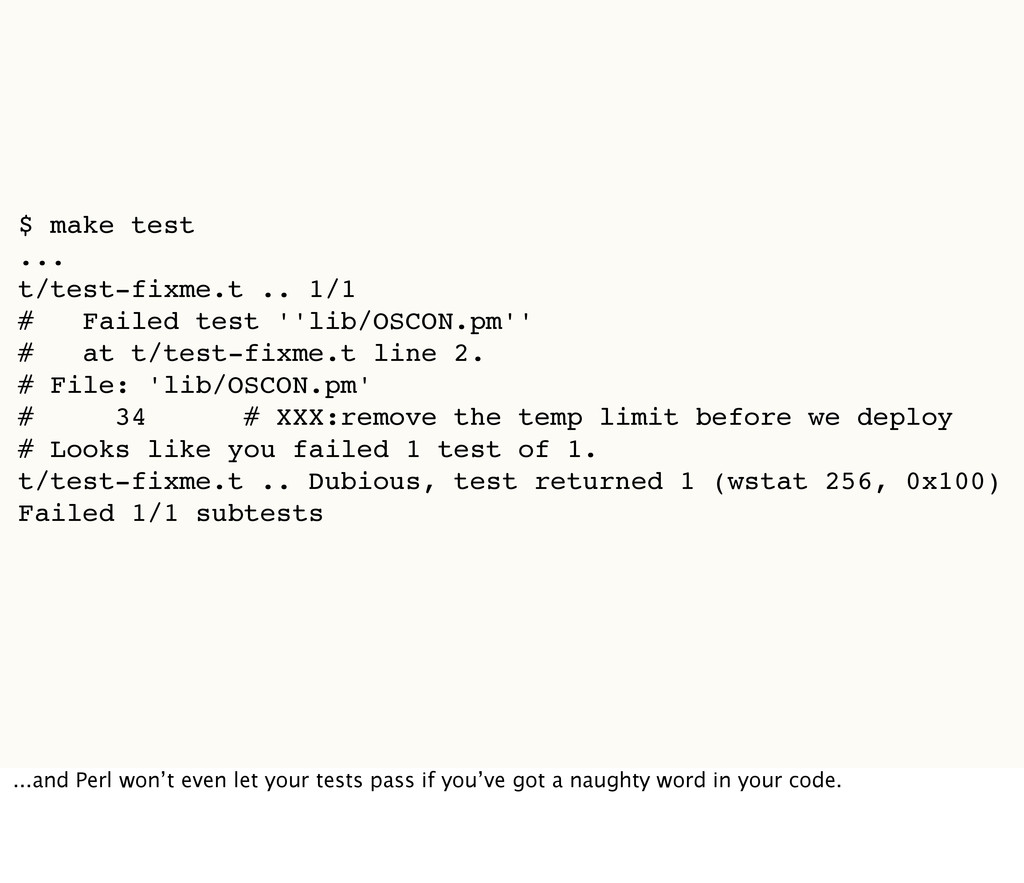
''lib/OSCON.pm'' # at t/test-fixme.t line 2. # File: 'lib/OSCON.pm' # 34 # XXX:remove the temp limit before we deploy # Looks like you failed 1 test of 1. t/test-fixme.t .. Dubious, test returned 1 (wstat 256, 0x100) Failed 1/1 subtests ...and Perl won’t even let your tests pass if you’ve got a naughty word in your code.
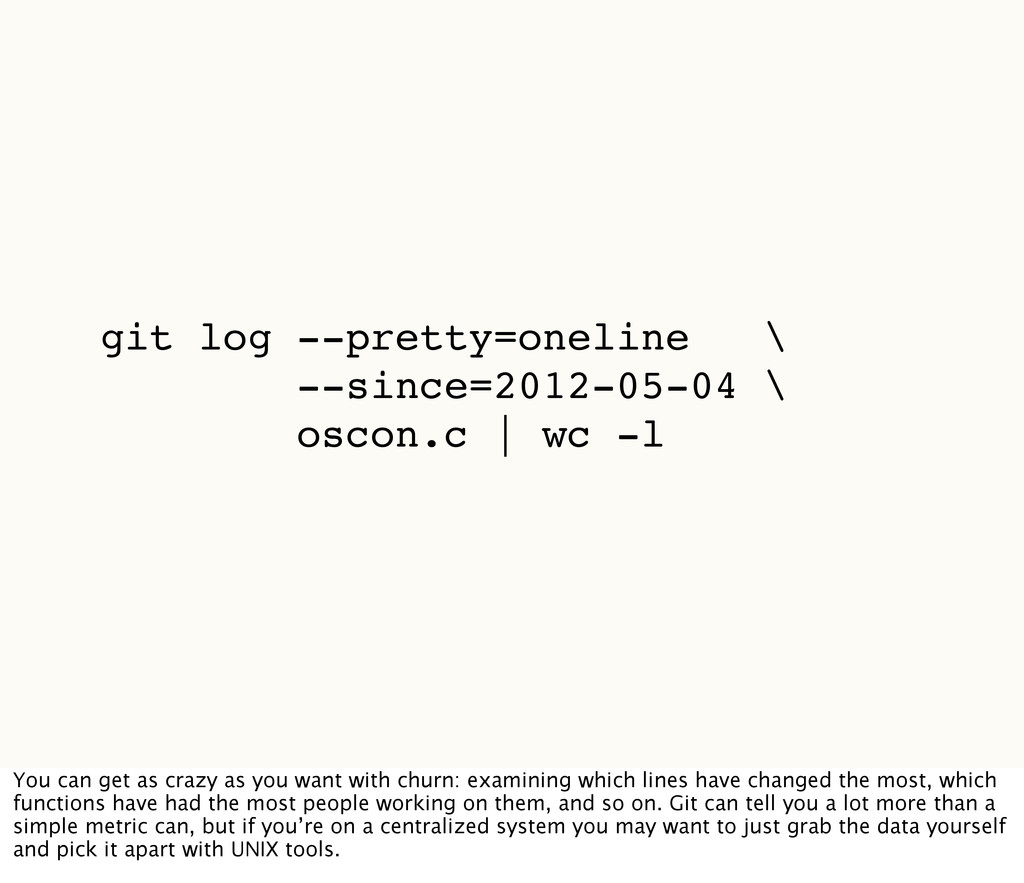
You can get as crazy as you want with churn: examining which lines have changed the most, which functions have had the most people working on them, and so on. Git can tell you a lot more than a simple metric can, but if you’re on a centralized system you may want to just grab the data yourself and pick it apart with UNIX tools.
to get used by developers outside of your team, you might use a metric like documentation coverage to identify the parts of the code that most badly need docs.
metrics we’ve seen so far have been one-shot numbers. But it’s also possible to track things over time, like occurrences of compiler errors or test failures.
the kinds of questions we want to ask about our code, and the metrics that can help us answer those questions. Now for the bigger question: what’s the effect on our software? Well, here are some of the things that happened with my team.
a surprisingly high complexity number in what was supposed to be a simple math routine. Somebody had snuck in an unwanted dependency on an unrelated system.
come at a time when our understanding of the domain is imperfect. As our understanding improves, we refactor the code. Complexity metrics can be handy for prioritizing.
this session with a couple of ideas for metrics you’d like to try, and with the well-founded belief that you can get started with very little time investment.