Upgrade to Pro — share decks privately, control downloads, hide ads and more …

Integrated single cell and spatial transcriptomic analysis defines molecular anatomy of the human DLPFC

Integrated single cell and spatial transcriptomic analysis defines molecular anatomy of the human DLPFC

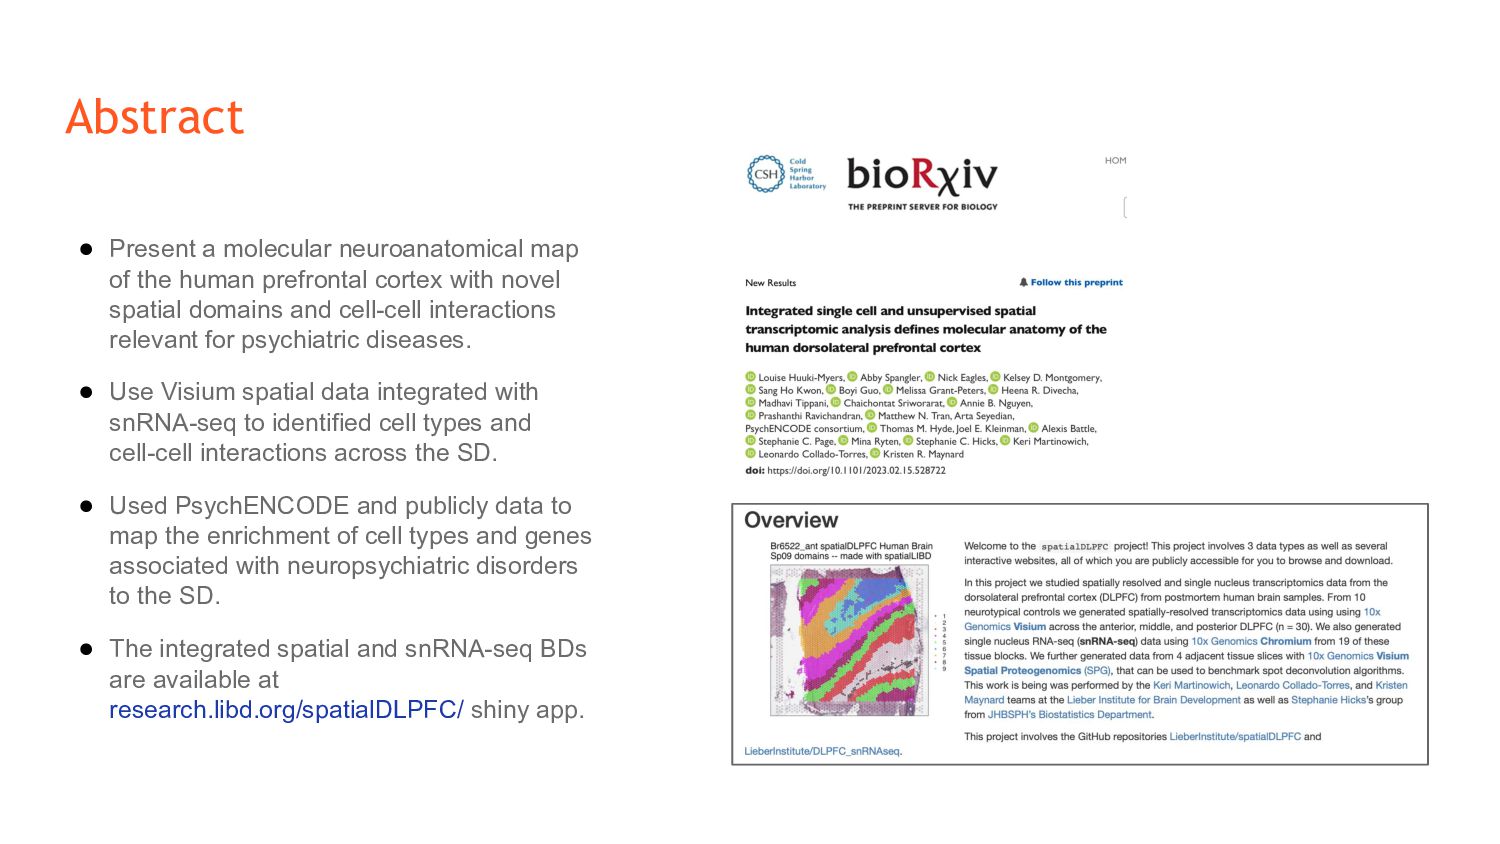
The molecular organization of the human neocortex has been historically studied in the context of its histological layers. However, emerging spatial transcriptomic technologies have enabled unbiased identification of transcriptionally-defined spatial domains that move beyond classic cytoarchitecture. Here we used the Visium spatial gene expression platform to generate a data-driven molecular neuroanatomical atlas across the anterior-posterior axis of the human dorsolateral prefrontal cortex (DLPFC). Integration with paired single nucleus RNA-sequencing data revealed distinct cell type compositions and cell-cell interactions across spatial domains. Using PsychENCODE and publicly available data, we map the enrichment of cell types and genes associated with neuropsychiatric disorders to discrete spatial domains. Finally, we provide resources for the scientific community to explore these integrated spatial and single cell datasets at research.libd.org/spatialDLPFC/

Cynthia SC

May 16, 2024
Tweet

More Decks by Cynthia SC

Other Decks in Science

Transcript

  1. Integrated single cell and unsupervised spatial transcriptomic analysis defines molecular

    anatomy of the human dorsolateral prefrontal cortex Cynthia S. Cardinault & Daianna Gonzalez-Padilla May 15, 2024 doi: https://doi.org/10.1101/2023.02.15.528722
  2. Abstract • Present a molecular neuroanatomical map of the human

    prefrontal cortex with novel spatial domains and cell-cell interactions relevant for psychiatric diseases. • Use Visium spatial data integrated with snRNA-seq to identified cell types and cell-cell interactions across the SD. • Used PsychENCODE and publicly data to map the enrichment of cell types and genes associated with neuropsychiatric disorders to the SD. • The integrated spatial and snRNA-seq BDs are available at research.libd.org/spatialDLPFC/ shiny app.
  3. 1. Study design to generate snRNA-seq and spatially-resolved transcriptomic data

    across DLPFC Brodmann Area 46 to capture L1-6 and the WM snRNA-seq and Visium data used to identify data-driven spatial domains and cell types. C) t-SNE summarizing layer resolution cell types identified by snRNA-seq D) Tissue block orientation and morphology was confirmed by H&E staining and smFISH with RNAscope. Neurons: SNAP25 WM: MBP GM: PCP4 E) Schematic of SpD identification and registration using BayesSpace SpDs at k=7. Enrichment t-statistics computed on BayesSpace SpDs correlating with manual histological layer annotations.
  4. 2. Unsupervised clustering at different resolutions identifies novel SD and

    defines molecular anatomy of DLPFC Cluster resolutions (k) tested: - k=2 → gray and white matter - k=9 “broad” resolution → almost recapitulated the 6 classical histological layers + WM - k=16 “fine” resolution → spatial domains were laminar with 2 or more associated with a given histological layer (molecularly-defined sublayers) - k=28 “super-fine” resolution → domains lacked laminar structure but spots mapped back to the “broad” and “fine” spatial domains Robust laminar features DGE analyses for the spatial-domains defined with these two resolutions revealed they are biologically meaningful (with DEGs in histological layers).
  5. 3. Spatial registration of fine resolution snRNA-seq clusters define laminar

    types Top 10 marker genes identified for each cell type at layer-level resolution Ex. snRNA-seq Excit_06 and Excit_08 spatially registered to histological L6. Ex. Inhib_05 uniquely registered to L2 (Inhibitory GABAergic). Ex. Endothelial cells to vascular spatial domains in L1. +56k nuclei across 29 cell type-annotated resolution (k=16) B) Correlation between snRNA-seq hclus and the manually annotated layers. BS clust at k=9 and k=16 *mean pseudo-bulked logcounts
  6. 4. Integration of snRNA-seq and Visium data to benchmark spot

    deconvolution algorithms and define cellular composition across SD Labeling and quantification of 4 broad cell types across the DLPFC (astrocytes, neurons, oligodendrocytes, and microglia) with Visium-SPG Algorithm performance evaluated by: 1) Examining the localization of laminar cell types to their corresponding layer x4 SPOTlight, Tangram, and Cell2location Cell type counts per layer (average of counts across all spots of a layer) Known VS Predicted 2) Comparing cell type counts in each sample vs those from IF images Benchmarked 3 spot deconvolution algorithms: “X” or “O” is placed on the layer with maximal proportion
  7. Average of the predicted cell type count proportions per spatial

    domain across the total 30 samples Cell type composition of each spot in one example sample Tangram and Cell2location
  8. 5. Integrative analysis of snRNA-seq and Visium data identified ligand-receptor

    interactions associated with SCZ A) Cell-Cell Communication identified interacting cell types. Identified 834 LR associated with SCZ. Prioritized 18 inter- and intra-cellular interactions, including 9 interactions involving FYN. Prediction of sender/receiver cross-talk pattern of LR between layer-level cell types L5/ligants -L6/receptor snRNA-seq characterizes FYN-EFNA5-EPHA5 signaling pathway. Showing genes highly enriched and co-expressed
  9. E) Across all the 30 tissue sections, EFNA5 and EPHA5

    are co-expressed in a higher proportion of spots in Sp9D7 H) Visium spots co-expressing EFNA5-EPHA5 with higher proportions of predicted Excit_L5/6 neurons and Excit_L6, consistent with snRNA-seq specificity analyses I) Ntw analysis of all 30 tissue sections, using top 3 dominant c2l cell types in each spot confirmed EFNA5 and EPHA5 co-expression occurs frequently in spots containing Excit_L6 neurons. Br8667_mid J) Schematic of a Visium spot depicting EFNA5-EPHA5 interactions between Excit_L5/6 neurons and Excit_L6. Oligodendrocytes also likely co-exist with Excit_L6 neurons
  10. 6. Spatial enrichment of cell types and genes associated with

    neurodevelopmental and neuropsychiatric disorders. 8 PsychENCODE (PEC) snRNA-seq datasets from human DLPFC of control donors Manually annotated histological layers Unsupervised BayesSpace spatial domains at k=9 and k=16 PEC study cell type annotation given by the highest correlation between the enrichment of the genes in the given cell type (x-axis) and in the histological layers/ BayesSpace spatial domains (y-axis) Excitatory neuron subtypes with a laminar annotation spatially register to the relevant histological layers and converge on the same unsupervised SpDs. Most inhibitory populations registered to multiple histological layers and unsupervised SpDs Other cell types had expected and biologically-supported registrations.
  11. Cell type populations in control samples from an ASD study

    Genes enriched in the BayesSpace spatial domins Cell type populations had expected annotations to the relevant spatial domains and novel laminar assignments to some populations. Cell type DEGs between ASD vs Ctrls Enrichment among genes enriched in the BayesSpace spatial domains MDD and PTSD DEGs in DLPFC and mPFC Unsupervised BayesSpace spatial domains at k=9
  12. Discussion • Implementing new unsupervised clustering and cell-cell communication tools,

    and expanding the donor pool higher resolution and novel spatial domains (cortical sublayers and non-laminar) were identified. • Unsupervised approaches are essential for the spatial profiling of brain regions lacking clear molecular or histological boundaries. • The missing single-cell resolution of Visium can be overcomed with spot-level deconvolution tools. • Spatial registration offers a rapid and easy method to spatially annotate snRNA-seq clusters and unsupervised spatial domains. • Enrichment analysis can further reveal disease-associated cell type-specific DEGs enriched in certain spatial domains and histological DLPFC layers. • A large-scale, transcriptome-wide, spatially-resolved molecular atlas of the human DLPFC gene expression architecture from 10 NTC donors at the single-cell resolution was generated and publicly shared → valuable source to study brain diseases and development, and the neuroanatomy of the human DLPFC.