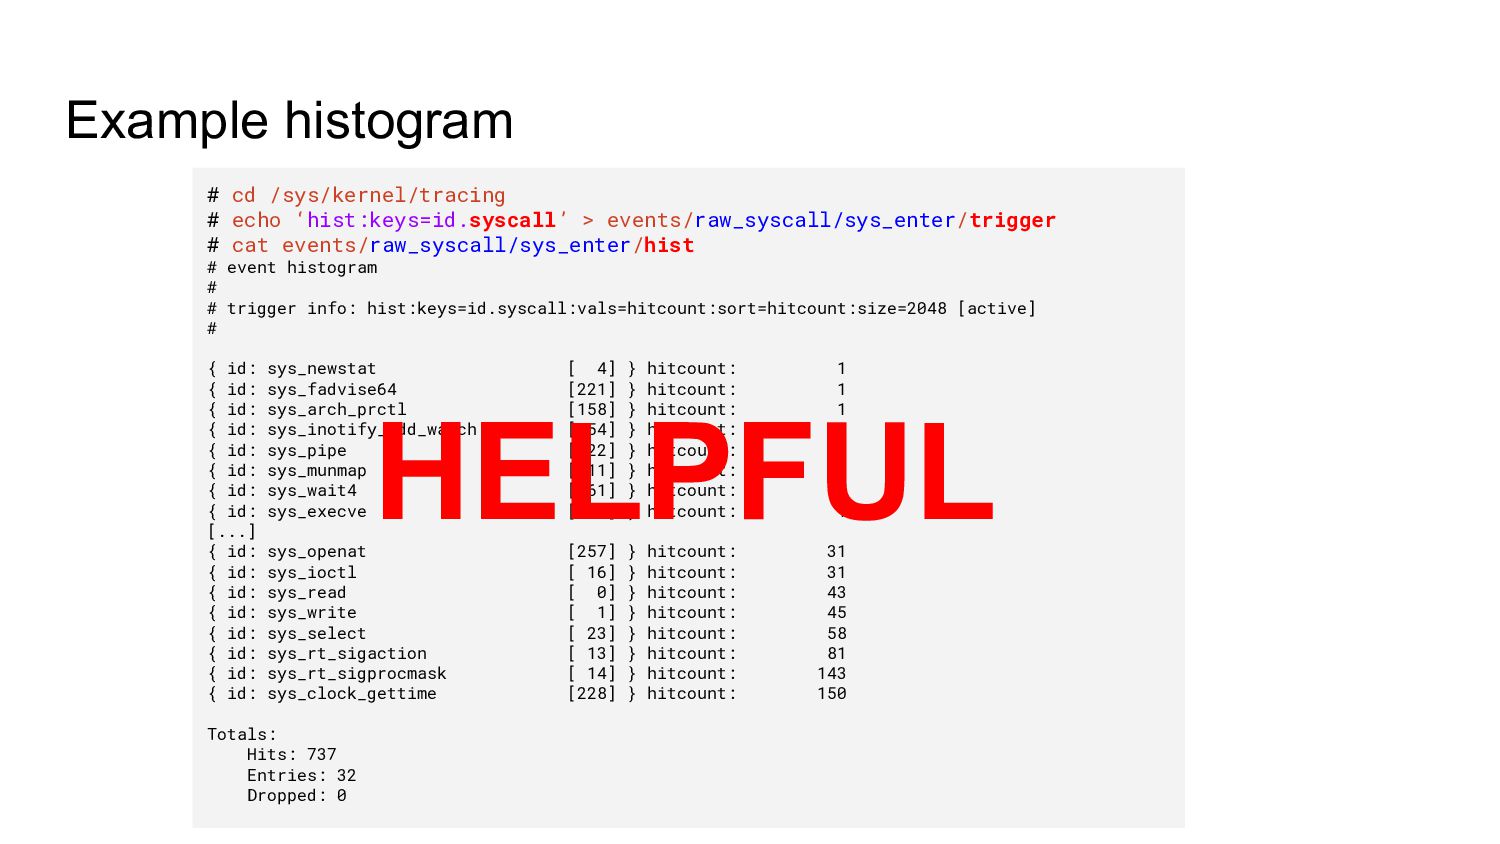
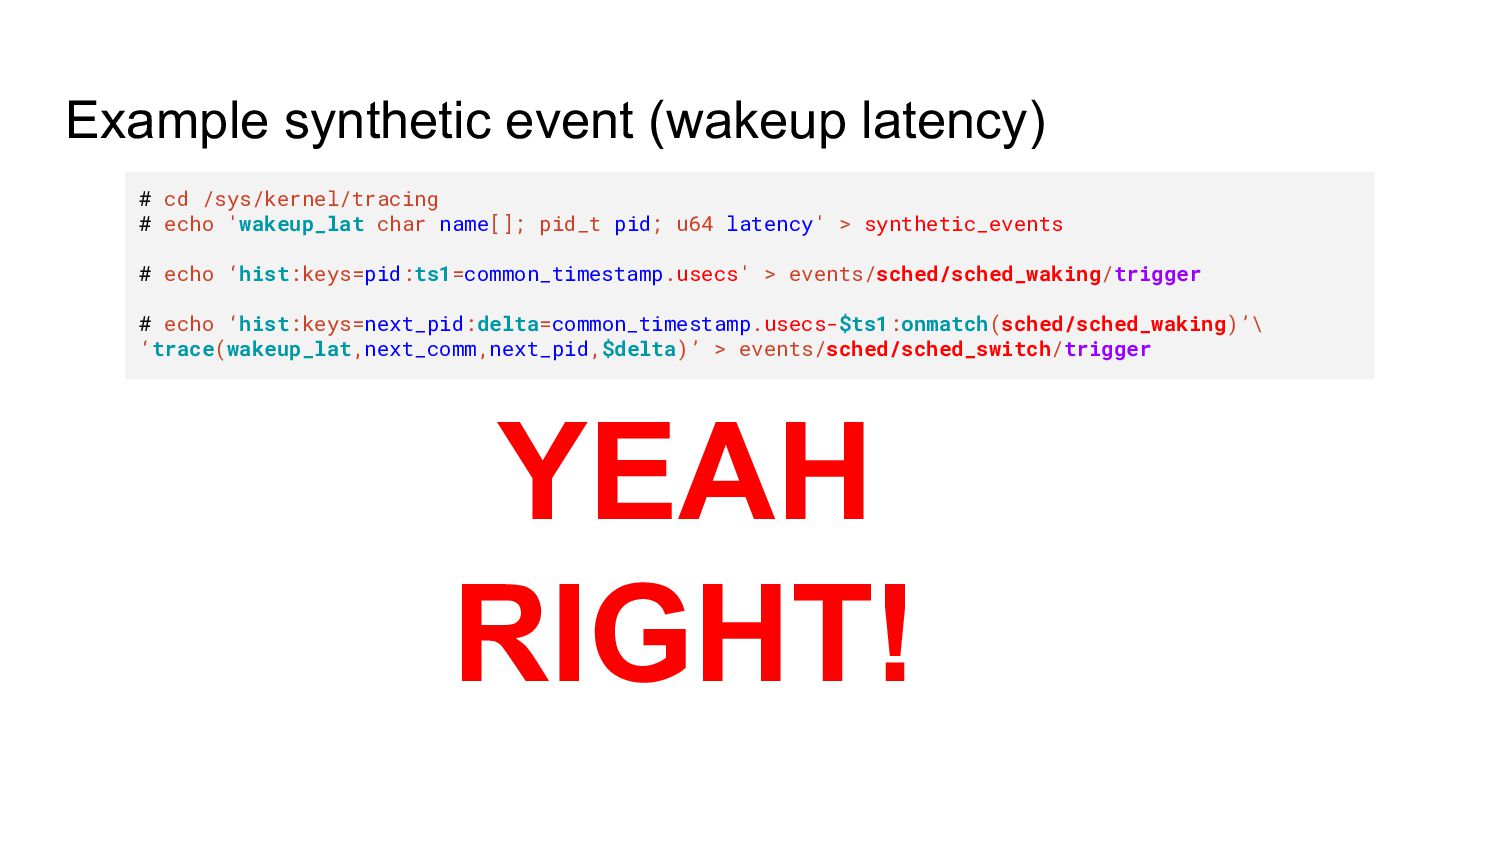
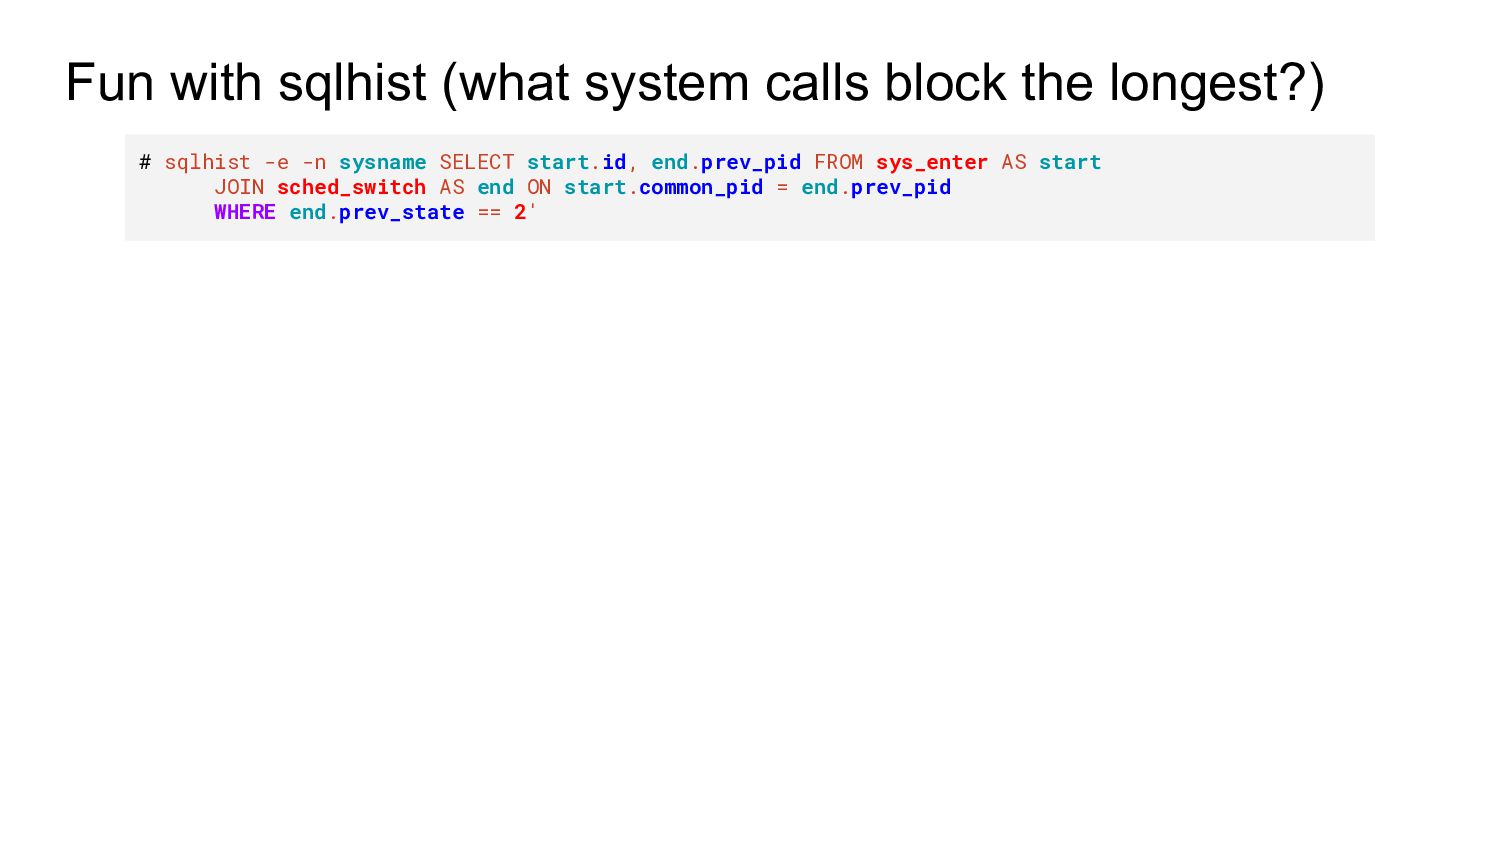
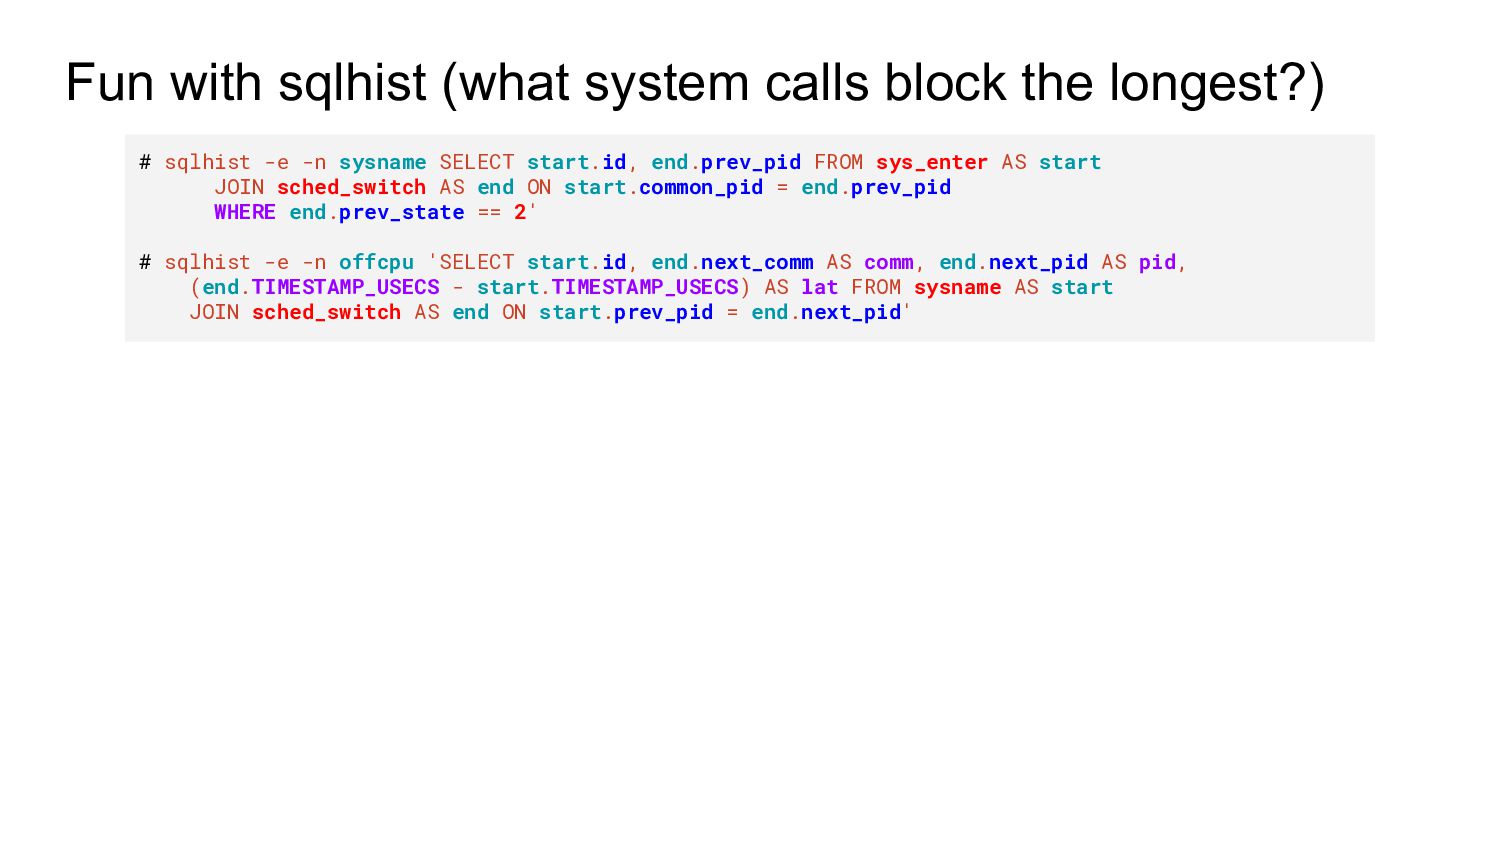
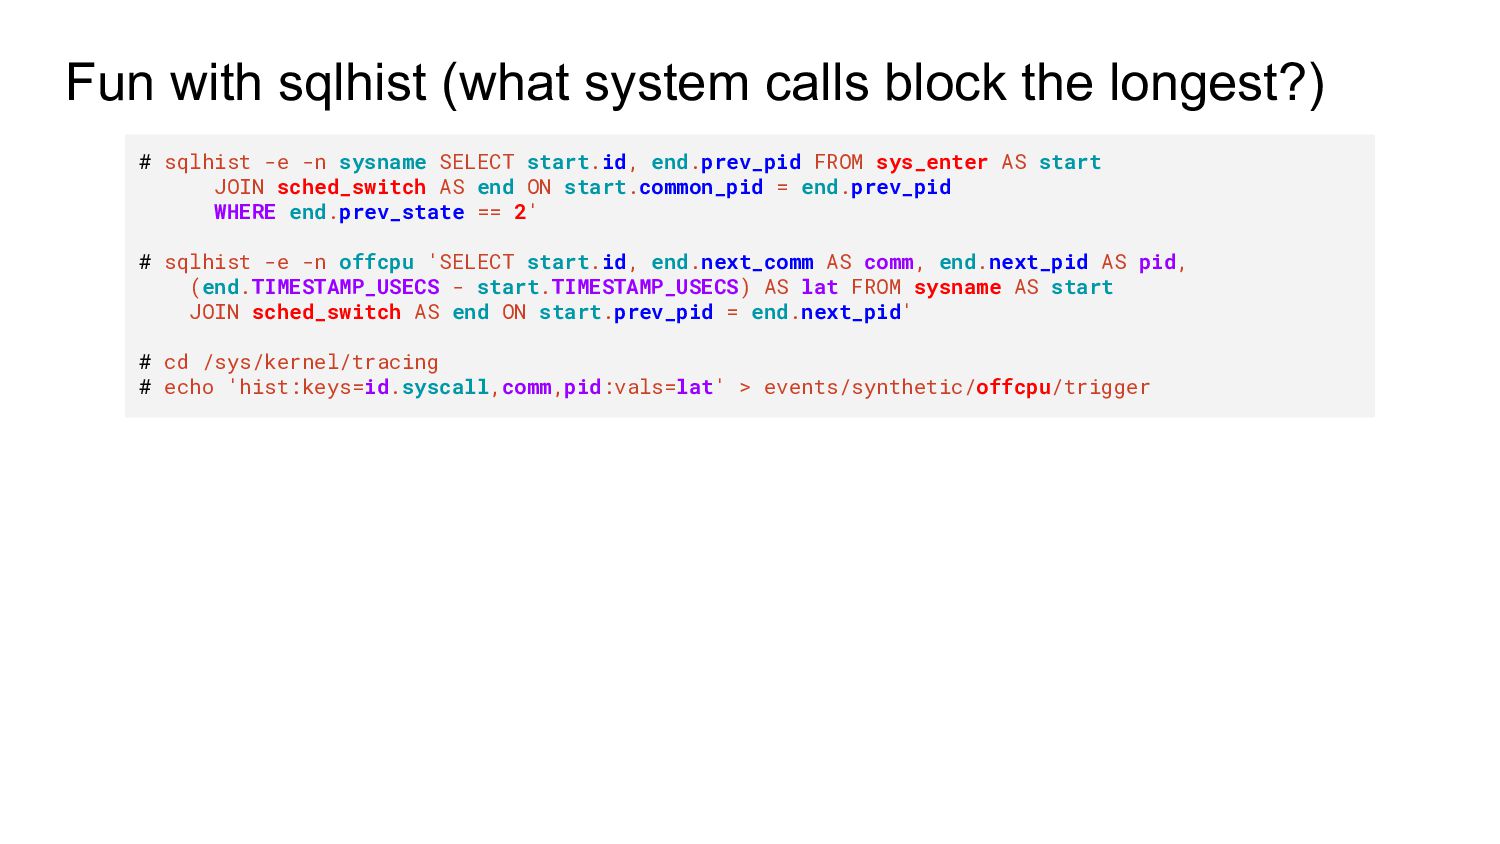
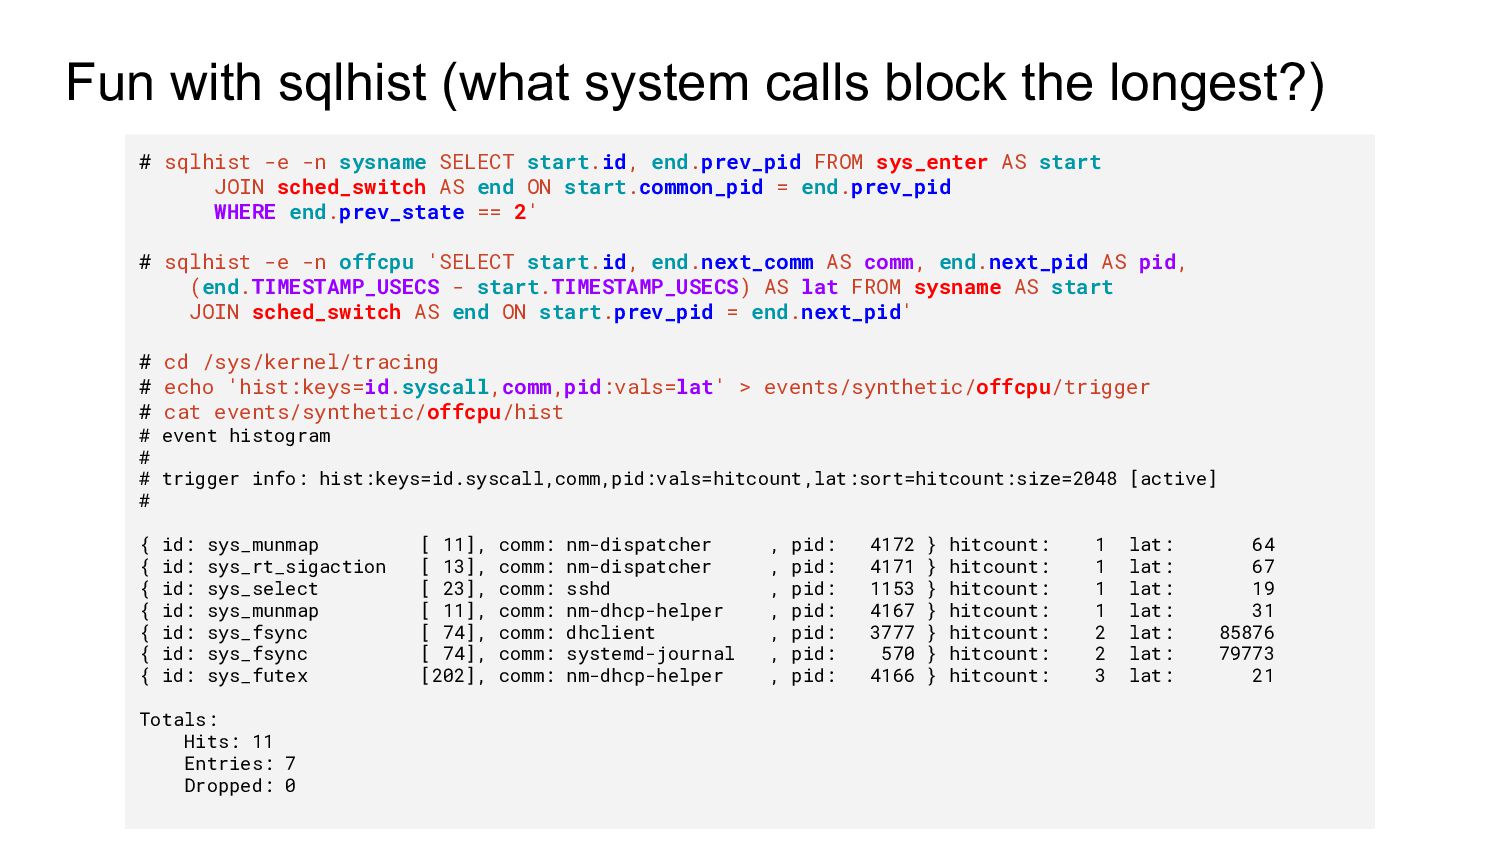
sqlhist -e -n sysname SELECT start.id, end.prev_pid FROM sys_enter AS start JOIN sched_switch AS end ON start.common_pid = end.prev_pid WHERE end.prev_state == 2' # sqlhist -e -n offcpu 'SELECT start.id, end.next_comm AS comm, end.next_pid AS pid, (end.TIMESTAMP_USECS - start.TIMESTAMP_USECS) AS lat FROM sysname AS start JOIN sched_switch AS end ON start.prev_pid = end.next_pid' # cd /sys/kernel/tracing # echo 'hist:keys=id.syscall,comm,pid:vals=lat' > events/synthetic/offcpu/trigger # cat events/synthetic/offcpu/hist # event histogram # # trigger info: hist:keys=id.syscall,comm,pid:vals=hitcount,lat:sort=hitcount:size=2048 [active] # { id: sys_munmap [ 11], comm: nm-dispatcher , pid: 4172 } hitcount: 1 lat: 64 { id: sys_rt_sigaction [ 13], comm: nm-dispatcher , pid: 4171 } hitcount: 1 lat: 67 { id: sys_select [ 23], comm: sshd , pid: 1153 } hitcount: 1 lat: 19 { id: sys_munmap [ 11], comm: nm-dhcp-helper , pid: 4167 } hitcount: 1 lat: 31 { id: sys_fsync [ 74], comm: dhclient , pid: 3777 } hitcount: 2 lat: 85876 { id: sys_fsync [ 74], comm: systemd-journal , pid: 570 } hitcount: 2 lat: 79773 { id: sys_futex [202], comm: nm-dhcp-helper , pid: 4166 } hitcount: 3 lat: 21 Totals: Hits: 11 Entries: 7 Dropped: 0
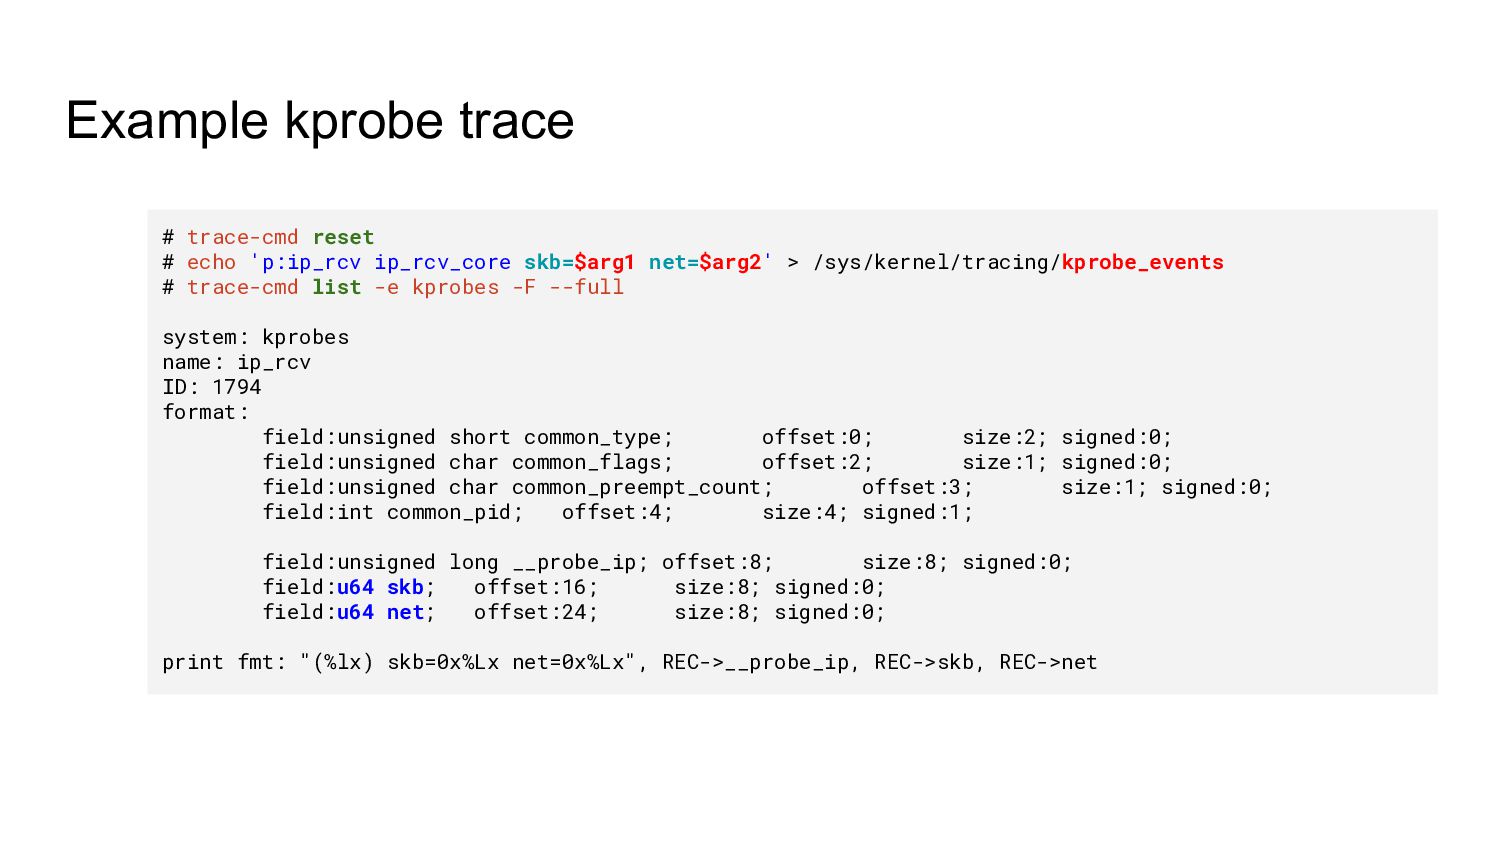
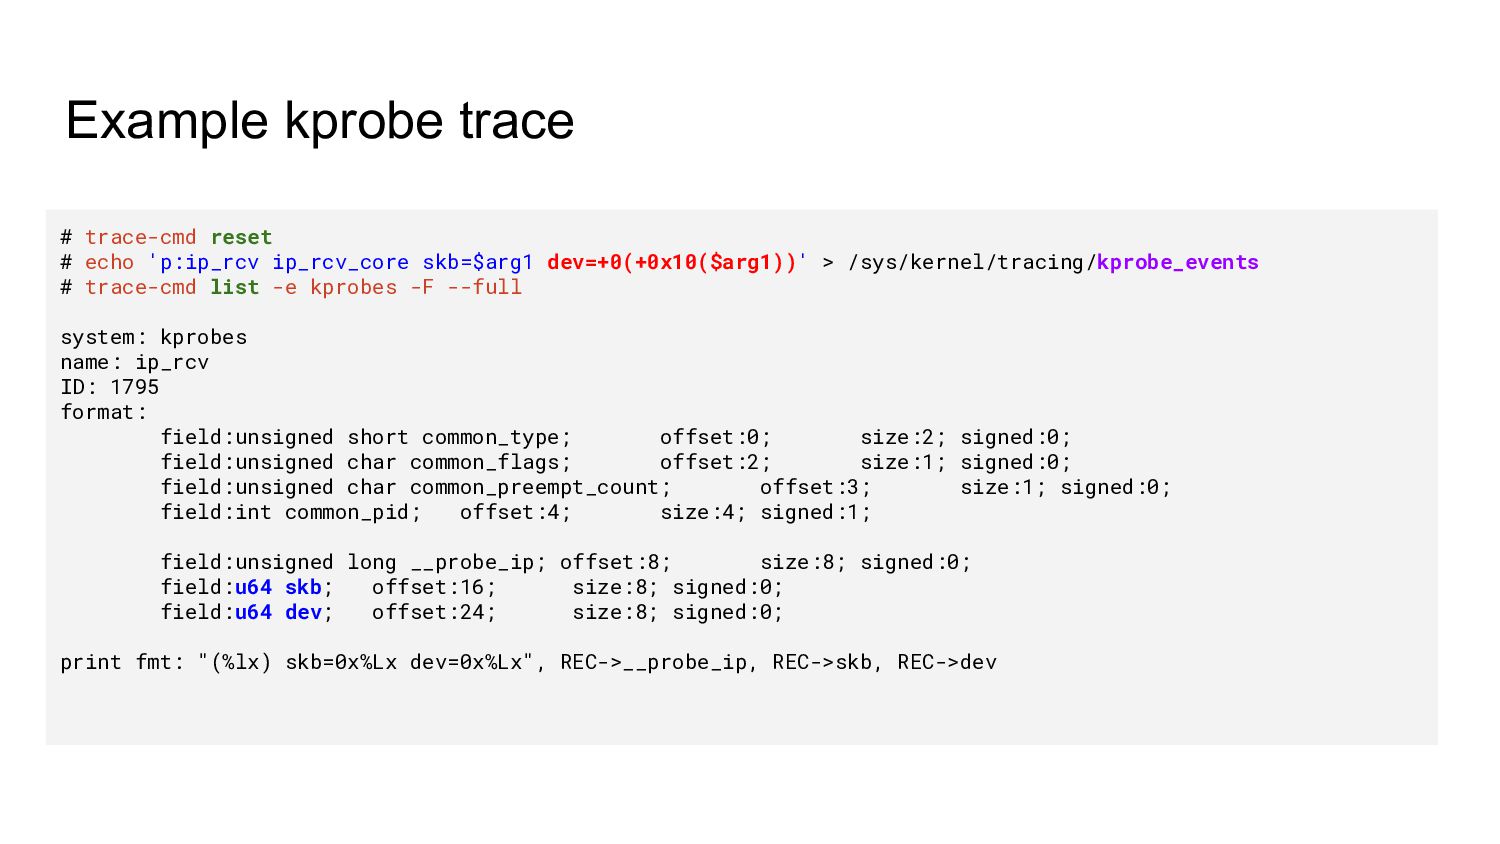
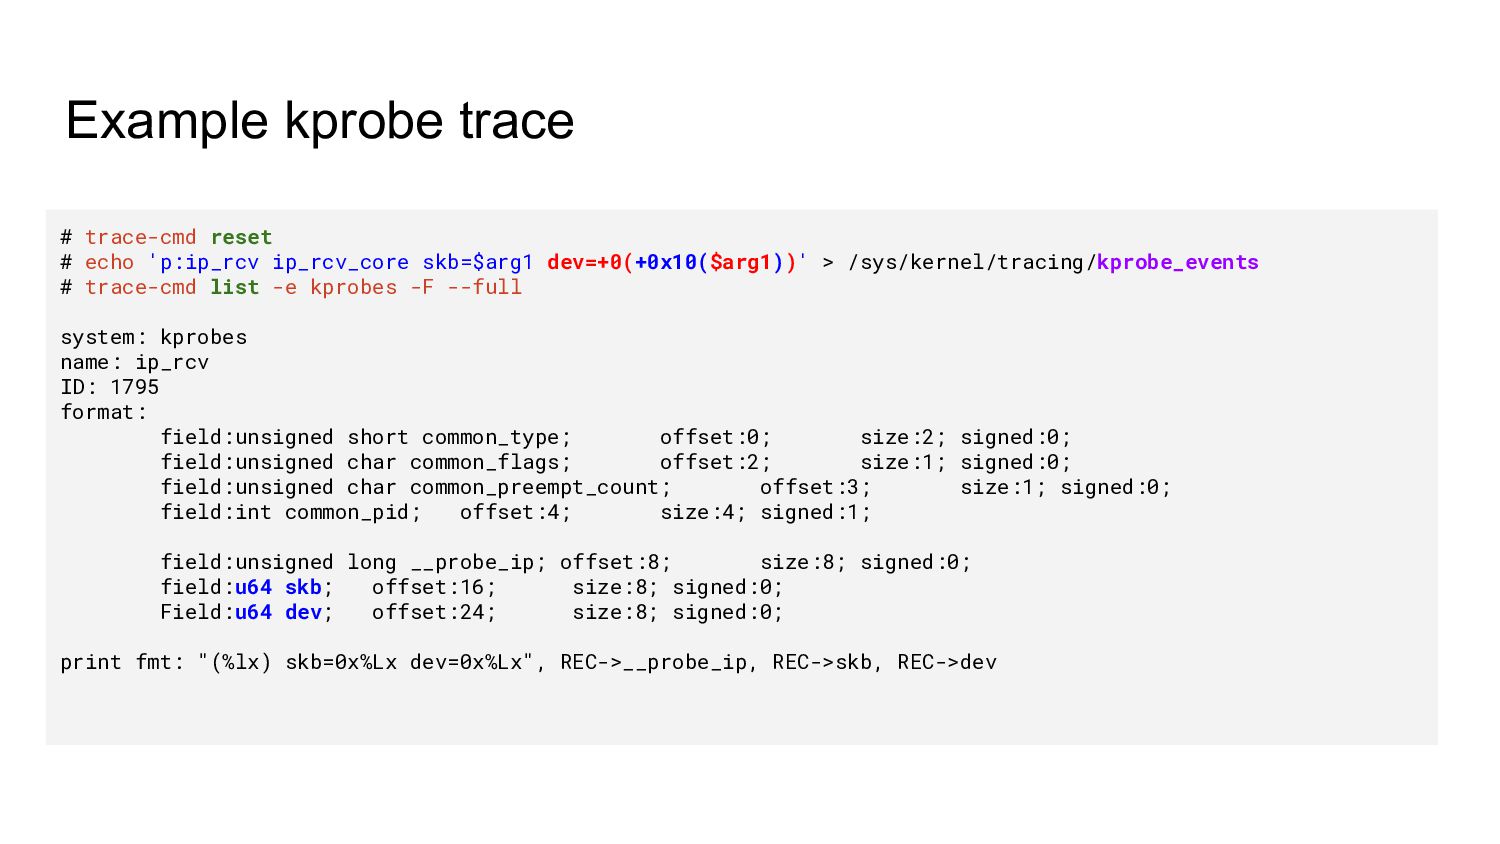
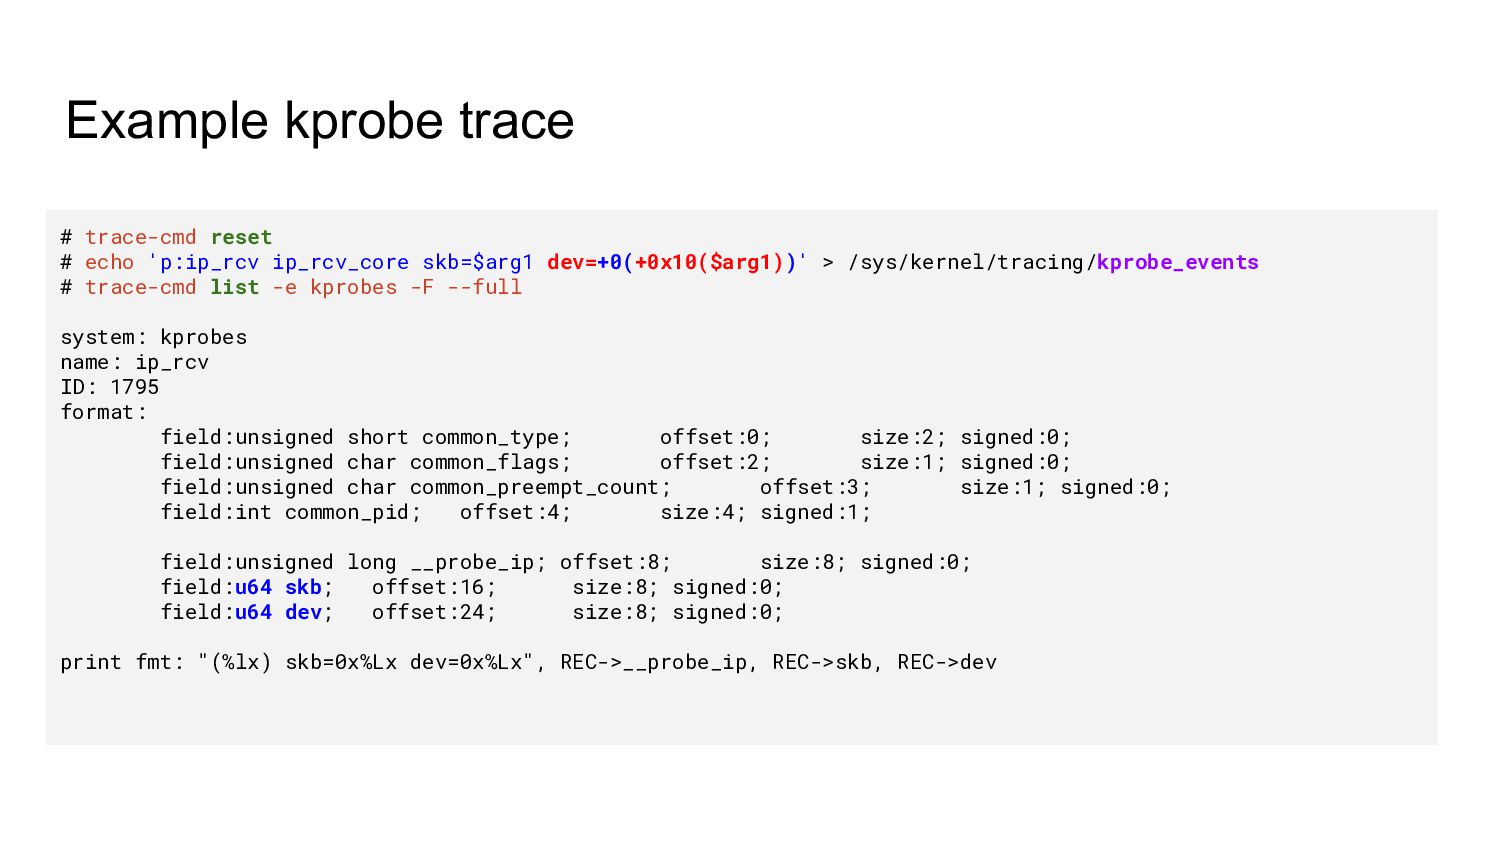
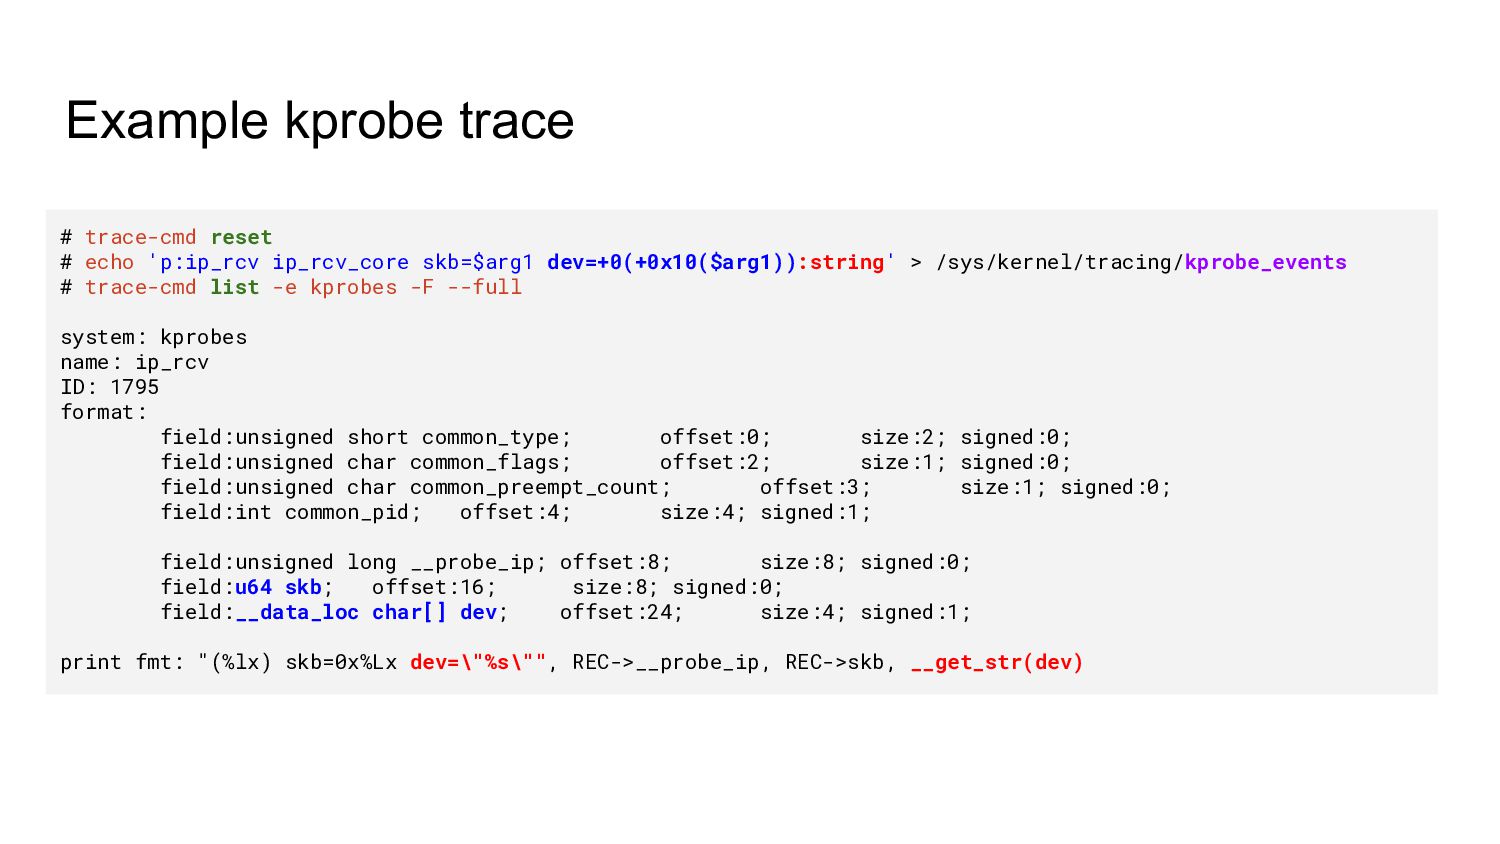
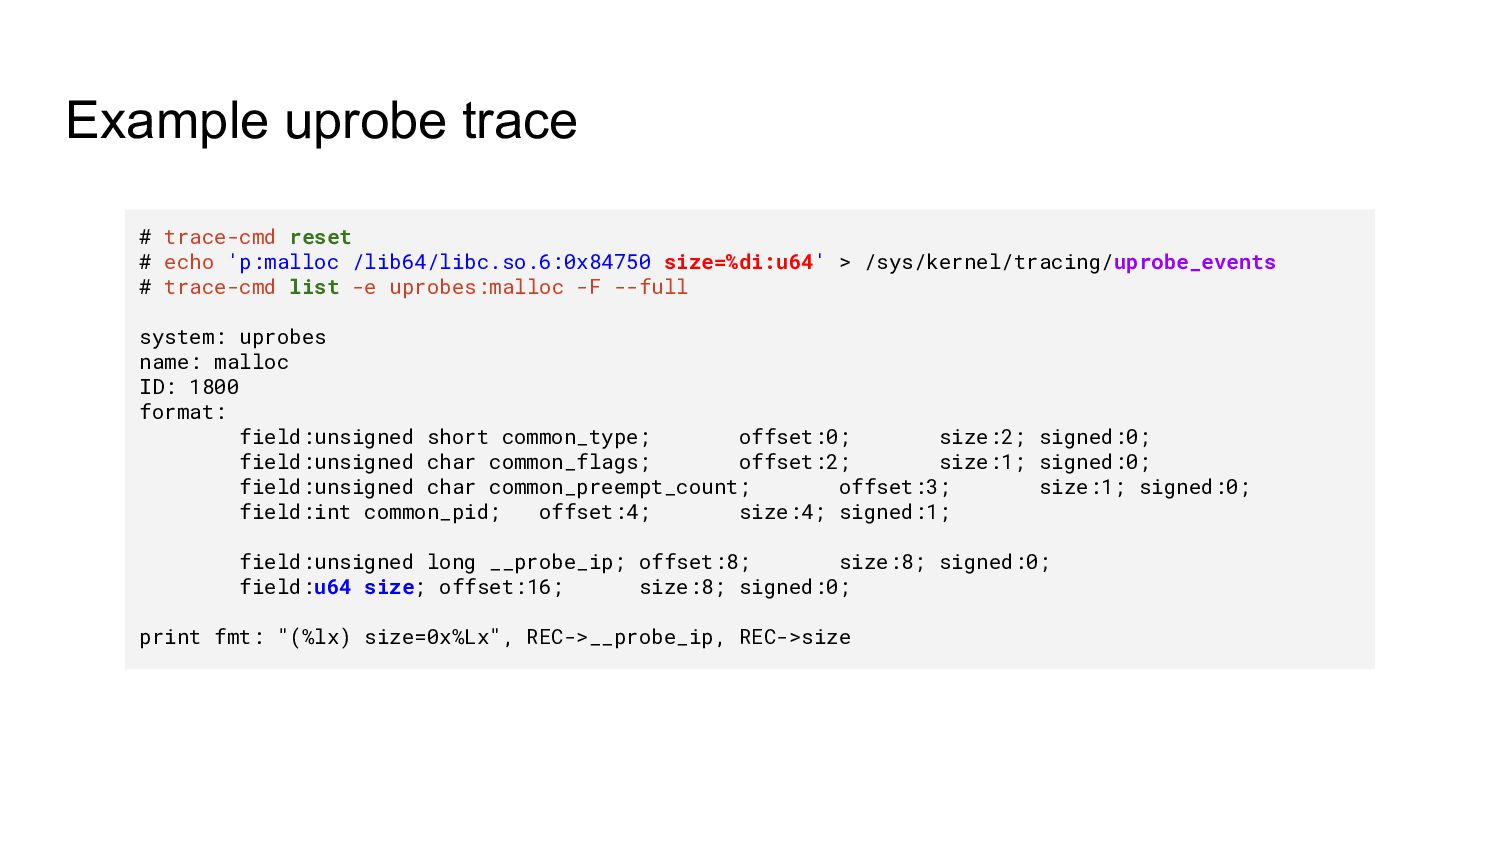
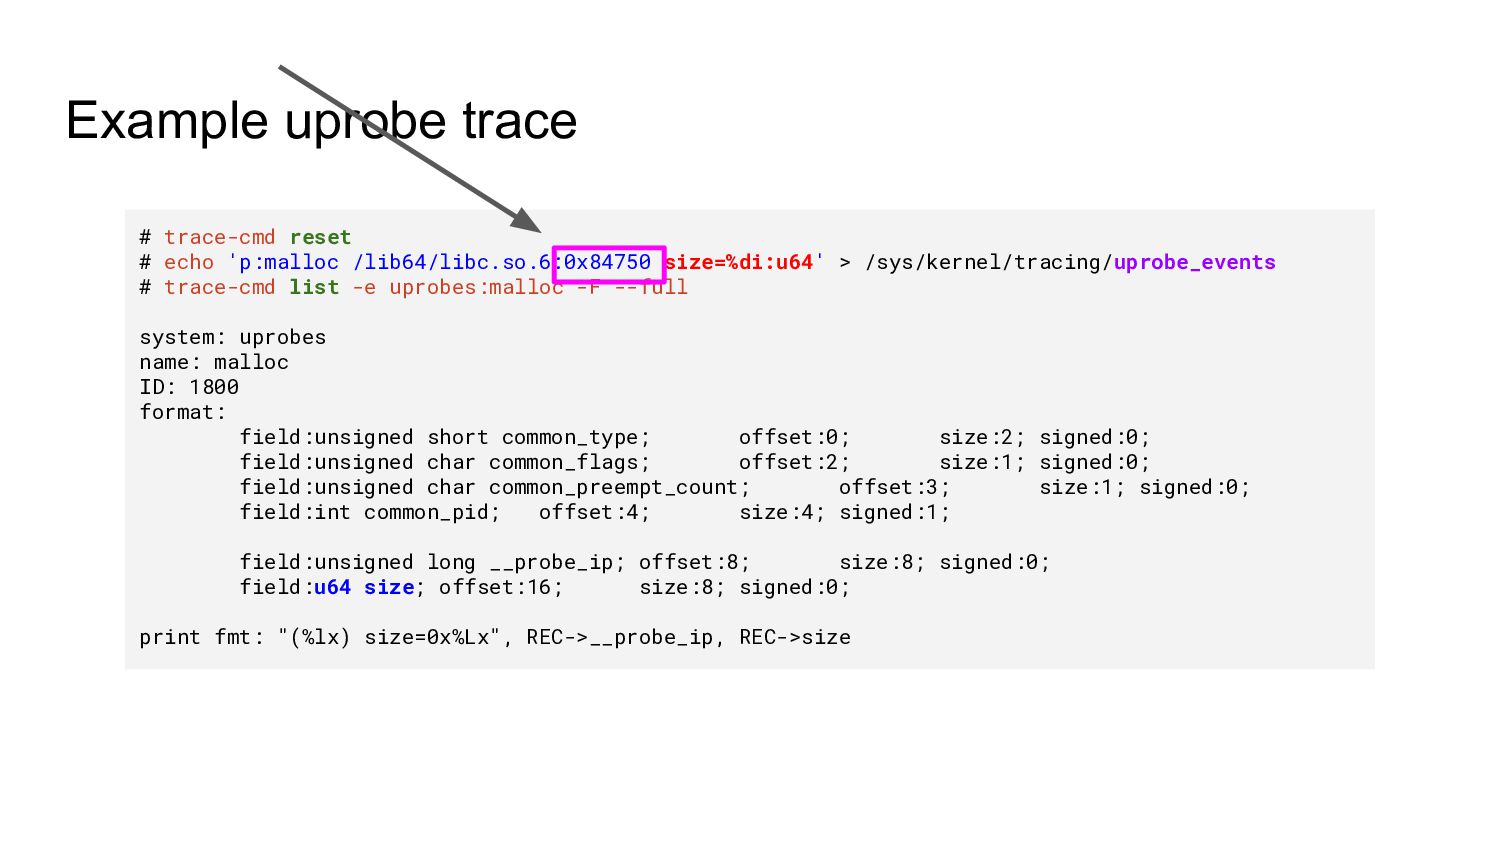
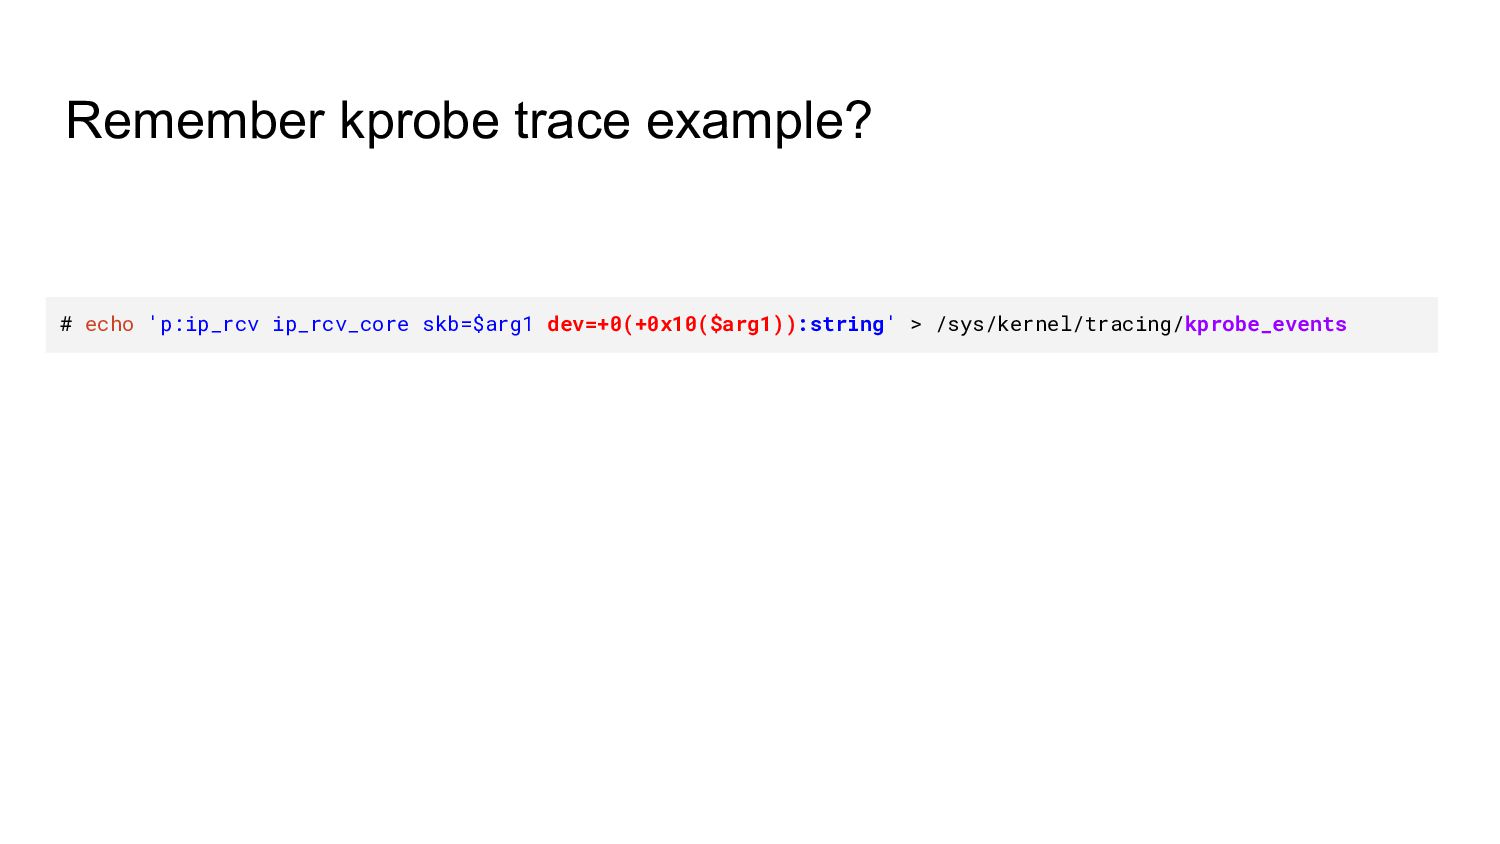
![Documentation/trace/kprobetrace.rst Synopsis of kprobe_events ------------------------- :: p[:[GRP/]EVENT] [MOD:]SYM[+offs]|MEMADDR [FETCHARGS] :](https://files.speakerdeck.com/presentations/2c09c35611a1429ea400d0c88d77c6d4/slide_23.jpg)
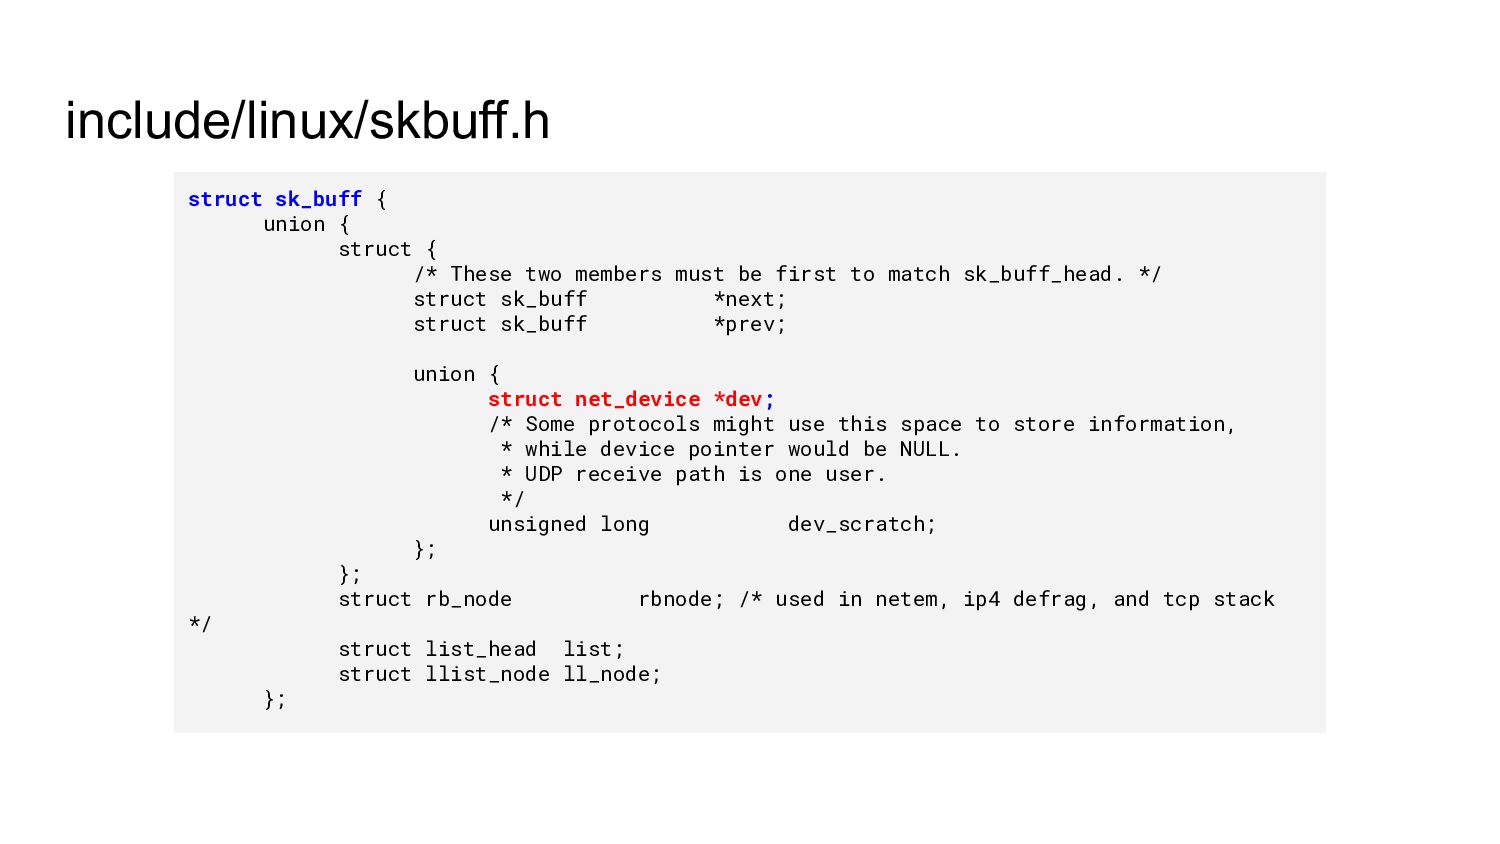
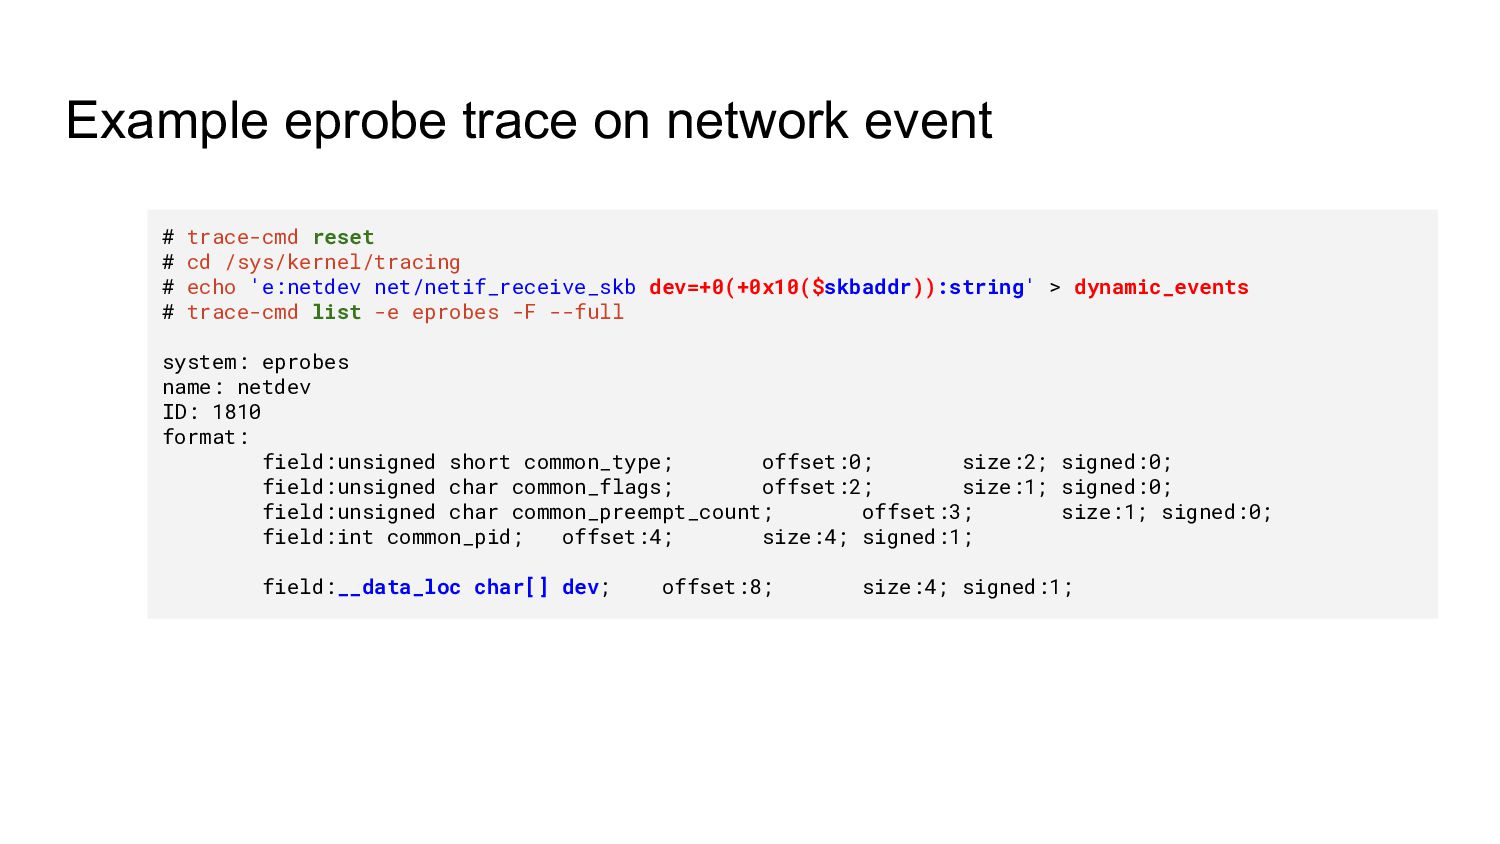
![include/linux/netdevice.h struct net_device { char name[IFNAMSIZ]; struct netdev_name_node *name_node; struct](https://files.speakerdeck.com/presentations/2c09c35611a1429ea400d0c88d77c6d4/slide_35.jpg)
![Documentation/trace/kprobetrace.rst Synopsis of kprobe_events ------------------------- :: p[:[GRP/]EVENT] [MOD:]SYM[+offs]|MEMADDR [FETCHARGS] :](https://files.speakerdeck.com/presentations/2c09c35611a1429ea400d0c88d77c6d4/slide_43.jpg)
![Documentation/trace/kprobetrace.rst Synopsis of kprobe_events ------------------------- :: p[:[GRP/]EVENT] [MOD:]SYM[+offs]|MEMADDR [FETCHARGS] :](https://files.speakerdeck.com/presentations/2c09c35611a1429ea400d0c88d77c6d4/slide_44.jpg)
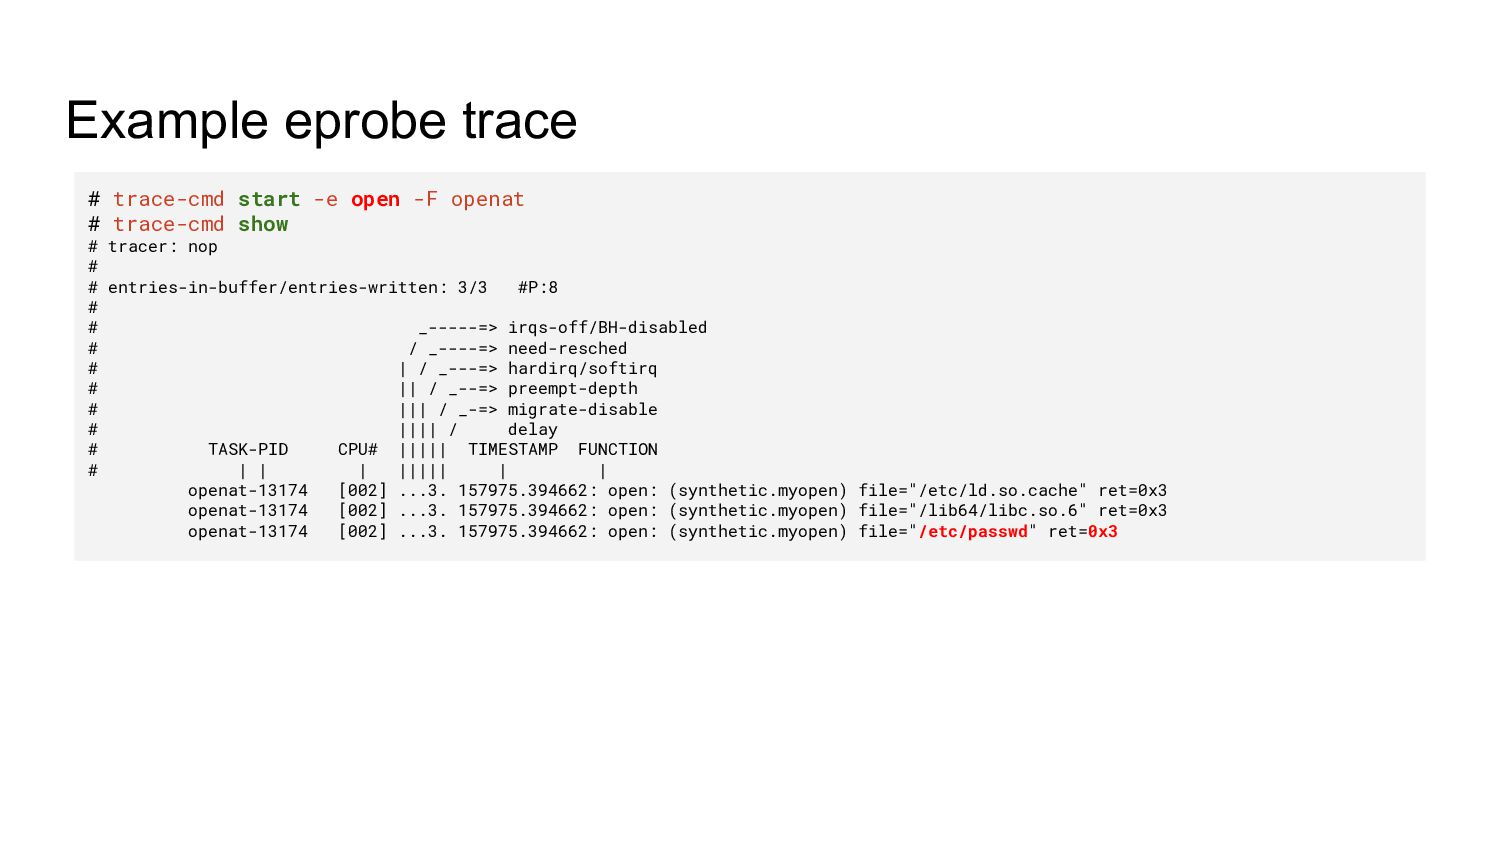
![ls-12606 [002] ...1. 151304.076524: open: (syscalls.sys_enter_openat) file="/etc/ld.so.cache" ls-12606 [002] ...1.](https://files.speakerdeck.com/presentations/2c09c35611a1429ea400d0c88d77c6d4/slide_135.jpg)