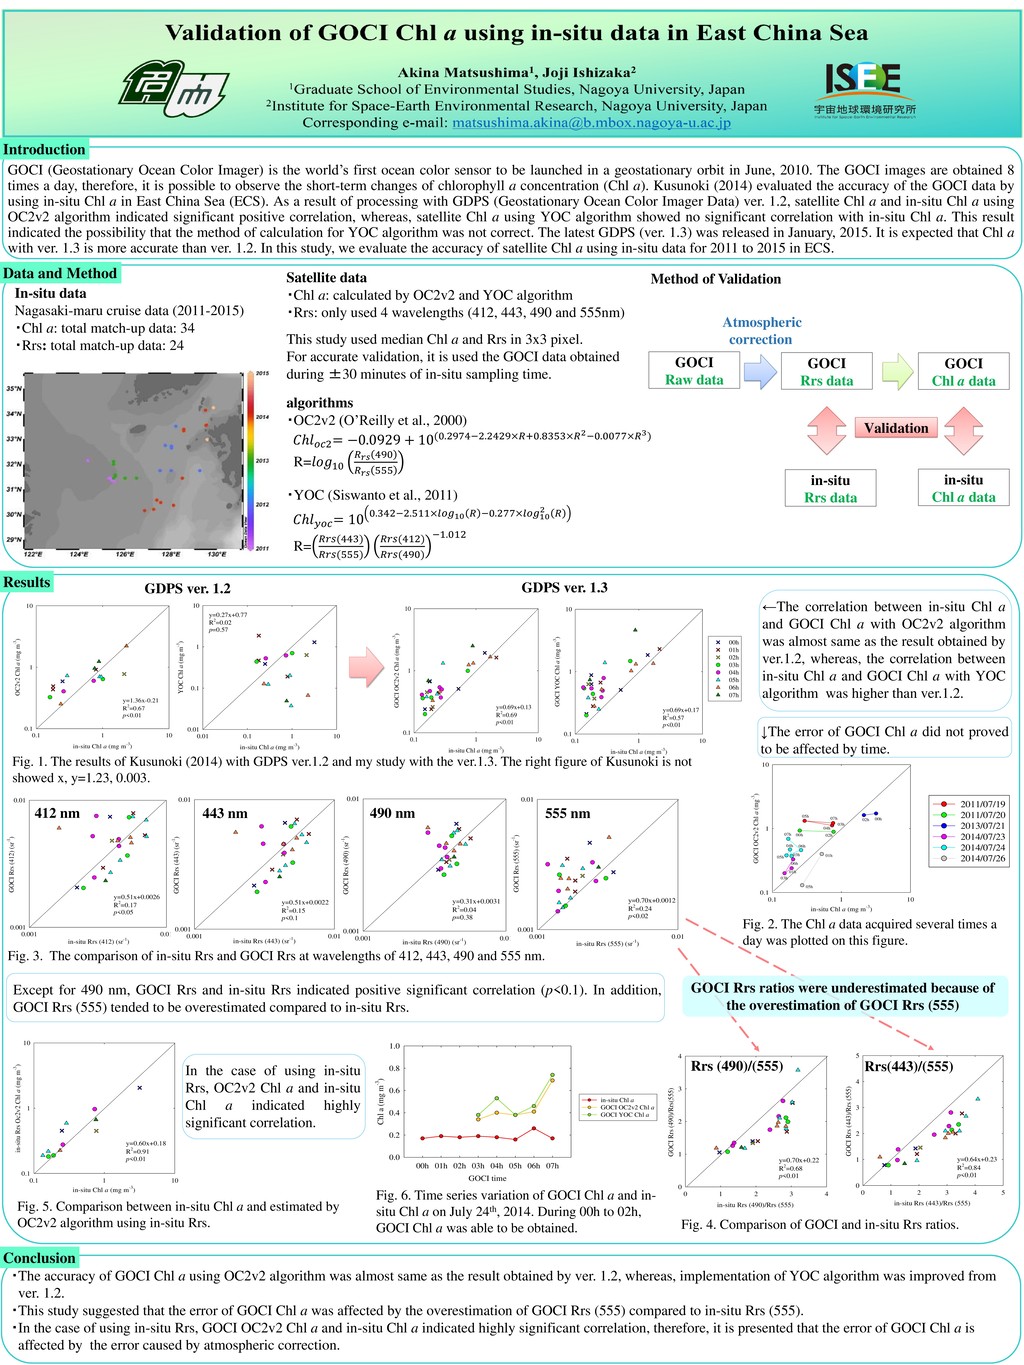
color sensor to be launched in a geostationary orbit in June, 2010. The GOCI images are obtained 8 times a day, therefore, it is possible to observe the short-term changes of chlorophyll a concentration (Chl a). Kusunoki (2014) evaluated the accuracy of the GOCI data by using in-situ Chl a in East China Sea (ECS). As a result of processing with GDPS (Geostationary Ocean Color Imager Data) ver. 1.2, satellite Chl a and in-situ Chl a using OC2v2 algorithm indicated significant positive correlation, whereas, satellite Chl a using YOC algorithm showed no significant correlation with in-situ Chl a. This result indicated the possibility that the method of calculation for YOC algorithm was not correct. The latest GDPS (ver. 1.3) was released in January, 2015. It is expected that Chl a with ver. 1.3 is more accurate than ver. 1.2. In this study, we evaluate the accuracy of satellite Chl a using in-situ data for 2011 to 2015 in ECS. in-situ Chl a (mg m-3) 0.01 0.1 1 10 YOC Chl a (mg m-3) 0.01 0.1 1 10 y=0.27x+0.77 R2=0.02 p=0.57 In-situ data Nagasaki-maru cruise data (2011-2015) ・Chl a: total match-up data: 34 ・Rrs: total match-up data: 24 Introduction Satellite data ・Chl a: calculated by OC2v2 and YOC algorithm ・Rrs: only used 4 wavelengths (412, 443, 490 and 555nm) This study used median Chl a and Rrs in 3x3 pixel. For accurate validation, it is used the GOCI data obtained during ±30 minutes of in-situ sampling time. algorithms ・OC2v2 (O’Reilly et al., 2000) ℎ2 = −0.0929 + 10(0.2974−2.2429×+0.8353×2−0.0077×3) R=10 490 555 ・YOC (Siswanto et al., 2011) ℎ = 10 0.342−2.511×10 −0.277×10 2 R= (443) (555) (412) (490) −1.012 GOCI Raw data GOCI Rrs data GOCI Chl a data in-situ Rrs data in-situ Chl a data Validation Atmospheric correction Method of Validation Conclusion GOCI time 00h 01h 02h 03h 04h 05h 06h 07h Chl a (mg m-3) 0.0 0.2 0.4 0.6 0.8 1.0 Data and Method in-situ Chl a (mg m-3) 0.1 1 10 OC2v2 Chl a (mg m-3) 0.1 1 10 y=1.36x-0.21 R2=0.67 p<0.01 GDPS ver. 1.2 Fig. 6. Time series variation of GOCI Chl a and in- situ Chl a on July 24th, 2014. During 00h to 02h, GOCI Chl a was able to be obtained. ・The accuracy of GOCI Chl a using OC2v2 algorithm was almost same as the result obtained by ver. 1.2, whereas, implementation of YOC algorithm was improved from ver. 1.2. ・This study suggested that the error of GOCI Chl a was affected by the overestimation of GOCI Rrs (555) compared to in-situ Rrs (555). ・In the case of using in-situ Rrs, GOCI OC2v2 Chl a and in-situ Chl a indicated highly significant correlation, therefore, it is presented that the error of GOCI Chl a is affected by the error caused by atmospheric correction. Fig. 1. The results of Kusunoki (2014) with GDPS ver.1.2 and my study with the ver.1.3. The right figure of Kusunoki is not showed x, y=1.23, 0.003. Fig. 3. The comparison of in-situ Rrs and GOCI Rrs at wavelengths of 412, 443, 490 and 555 nm. 2011/07/19 2011/07/20 2013/07/21 2014/07/23 2014/07/24 2014/07/26 Except for 490 nm, GOCI Rrs and in-situ Rrs indicated positive significant correlation (p<0.1). In addition, GOCI Rrs (555) tended to be overestimated compared to in-situ Rrs. ←The correlation between in-situ Chl a and GOCI Chl a with OC2v2 algorithm was almost same as the result obtained by ver.1.2, whereas, the correlation between in-situ Chl a and GOCI Chl a with YOC algorithm was higher than ver.1.2. Fig. 4. Comparison of GOCI and in-situ Rrs ratios. Fig. 2. The Chl a data acquired several times a day was plotted on this figure. in-situ Chl a (mg m-3) 0.1 1 10 in-situ Rrs Oc2v2 Chl a (mg m-3) 0.1 1 10 y=0.60x+0.18 R2=0.91 p<0.01 Fig. 5. Comparison between in-situ Chl a and estimated by OC2v2 algorithm using in-situ Rrs. In the case of using in-situ Rrs, OC2v2 Chl a and in-situ Chl a indicated highly significant correlation. Results in-situ Chl a GOCI OC2v2 Chl a GOCI YOC Chl a in-situ Chl a (mg m-3) 0.1 1 10 GOCI OC2v2 Chl a (mg-3) 0.1 1 10 00h 02h 07h 05h 04h 00h 02h 03h 01h 05h 01h 03h 06h 07h 06h 05h 04h 03h in-situ Rrs (490)/Rrs (555) 0 1 2 3 4 GOCI Rrs (490)/Rrs(555) 0 1 2 3 4 y=0.70x+0.22 R2=0.68 p<0.01 Rrs (490)/(555) in-situ Rrs (443)/Rrs (555) 0 1 2 3 4 5 GOCI Rrs (443)/Rrs (555) 0 1 2 3 4 5 y=0.64x+0.23 R2=0.84 p<0.01 Rrs(443)/(555) in-situ Rrs (412) (sr-1) 0.001 0.01 GOCI Rrs (412) (sr-1) 0.001 0.01 y=0.51x+0.0026 R2=0.17 p<0.05 412 nm in-situ Rrs (443) (sr-1) 0.001 0.01 GOCI Rrs (443) (sr-1) 0.001 0.01 y=0.51x+0.0022 R2=0.15 p<0.1 443 nm in-situ Rrs (490) (sr-1) 0.001 0.01 GOCI Rrs (490) (sr-1) 0.001 0.01 y=0.31x+0.0031 R2=0.04 p=0.38 490 nm in-situ Rrs (555) (sr-1) 0.001 0.01 GOCI Rrs (555) (sr-1) 0.001 0.01 y=0.70x+0.0012 R2=0.24 p<0.02 555 nm GDPS ver. 1.3 ↓The error of GOCI Chl a did not proved to be affected by time. GOCI Rrs ratios were underestimated because of the overestimation of GOCI Rrs (555) in-situ Chl a (mg m-3) 0.1 1 10 GOCI OC2v2 Chl a (mg m-3) 0.1 1 10 y=0.69x+0.13 R2=0.69 p<0.01 in-situ Chl a (mg m-3) 0.1 1 10 GOCI YOC Chl a (mg m-3) 0.1 1 10 00h 01h 02h 03h 04h 05h 06h 07h y=0.69x+0.17 R2=0.57 p<0.01