Upgrade to Pro — share decks privately, control downloads, hide ads and more …

-Tokyo Digital Twin Project- Roadmap for the Social Implementation of Digital Twin First Edition (Summary Version)

data_rikatsuyou
June 21, 2022
1.1k

-Tokyo Digital Twin Project- Roadmap for the Social Implementation of Digital Twin First Edition (Summary Version)

data_rikatsuyou

June 21, 2022
Tweet

Transcript

  1. Roadmap for the Social Implementation of Digital Twin M a

    r c h 2 0 2 2 F i r s t E d i t i o n ( S u m m a r y Ve r s i o n ) To k y o M e t r o p o l i t a n G o v e r n m e n t To k y o D i g i t a l T w i n P r o j e c t
  2. Table of Contents chapter section Title page 1 Digital Twin

    Concept 1 What is Digital Twin? 3 2 Significance of Tokyo Digital Twin Initiative 4 3 Tokyo Metropolitan Government's Initiatives Related to Digital Twin 17 2 Our goal through Digital Twin 1 Value of Digital Twin 20 2 What is the Complete Digital Twin that we aim to realize? 21 3 Components of Digital Twin 1 Overall Picture of Digital Twin 24 2 Components of Digital Twin 26 3 Components of Cyber Space 27 4 Components of Physical Space 29 5 Elements common to Cyber and Physical space 30 6 Other Factors 31 chapter section Title page 4 Steps toward realizing Digital Twin 1 Steps to realize Digital Twin 39 2 Implementation of base elements 41 3 Maintenance of ancillary elements 44 4 Service Implementation 51 5 Digital Twin area development 54 5 Maintenance and operation of Digital Twin 1 Role and Cost-sharing Approach 60 2 Division of roles in the development of Digital Twin 61 3 Division of roles in the operation of Digital Twin 62 6 Cost-effectiveness of Digital Twin development 1 Approach to Estimating Cost 65 2 Approach to Estimating Effectiveness 68 3 Examples of cost-effectiveness expressions 73
  3. 1.1 What is Digital Twin? Reproduce physical space in cyber

    space to build and utilize "twins“. Society5.0 Cyber-space (Virtual-space) Physical-space (Real-space) Tokyo 1 Analysis and Simulation Real Time Data Acquisition Tokyo 3 Feedback Tokyo Data Platform 3D digital map 2 A cyber space (a virtual space on a computer or computer network) that reproduces various physical space (real space) elements such as buildings, roads and other infrastructure, economic activities, and human flows as "twins" based on data acquired from sensors and other sources. Use case etc. Disaster prevention Town Planning Mobility Education Working style Industry Energy Nature Wellness 3
  4. 1.2 Significance of Tokyo Digital Twin Initiative Japanese economic presence

    in the world is declining and the digital shift of Japan is lagging. ・・・ Declining presence of Japanese economy Delay in the digital shift are apparent Japan's share of global GDP is estimated to be about 4.4% in 2030, compared to about 7% in 2010, indicating the declining presence of Japanese economy. Japan ranked 27th in the "Global Digital Competitiveness Ranking“, falling behind the rest of the world. Global Digital Competitiveness Ranking Real GDP Share by Country (2010/2030) 4 1 USA 2 Singapore 3 Denmark 4 Sweden 5 Hong Kong SAR 6 Switzerland 7 Netherlands 8 Korea Rep 9 Norway 10 Finland 27 Japan Source: Based on OECD, Economic Outlook No. 95 (2014) Source: IMD "World Digital Competency Ranking” USA Eurozone China Japan India UK Other China USA Eurozone India Japan UK Other Total 57.7 trillion dollars
  5. 1.2 Significance of Tokyo Digital Twin Initiative Declining birthrate, aging,

    declining population, and other factors have a significant impact on productivity and urban vitality of Japan. Decreasing birthrate, aging and falling population In 2015, the elderly population accounted for 22.7% of Tokyo's population, and the city has already entered a hyper-aged society. The aging of the population is expected to continue. The composition of Tokyo‘s population is expected to change drastically by 2060, with the young population decrease by about 30% and the working-age population by 20% compared to 2015. Population by age group in Tokyo (Source) The "Future Tokyo" Strategy Annex. https://www.seisakukikaku.metro.tokyo.lg.jp/basic-plan/fuzoku/html5.html#page=17 (Source) Compiled from "Tokyo Metropolitan Government Daytime Population Projections (March 2020)" (Bureau of General Affairs, Tokyo Metropolitan Government), "National Census" (Ministry of Internal Affairs and Communications), etc. (Remarks) 1.After 2045: Estimates by the Bureau of Policy Planning, Tokyo Metropolitan Government 2.Figures in parentheses in the breakdown are percentages of the population (percentages for 2015 were calculated by dividing the age unknowns by each age group). 3.Total breakdown may not equal total number due to rounding and inclusion of unspecified age in actual values. 5 122 147 (10.9) 170 191 (13.4) 191 183 (13.1) 183 198 221 228 224 (18.7) 143 160 (11.8) 154 136 (9.6) 146 171 (12.3) 196 197 180 167 157 (13.1) 885 893 (66.0) 923 938 (65.9) 932 900 (64.4) 850 808 771 738 706 (58.9) 148 152 (11.3) 159 157 (11.0) 150 143 (10.2) 136 130 123 117 111 (9.3) 0 200 400 600 800 1000 1200 1400 1600 2010 2015 2020 2025 2030 2035 2040 2045 2050 2055 2060 老人人口 (75歳以上) 老年人口 (65~74歳) 生産年齢人口 (15~64歳) 年少人口 (15歳未満) (1,352) (1,406) (1,423) (1,418) (1,398) (1,365) (1,333) (1,295) (1,250) (1,198) (1,316) (Year) (10 thousand people) Estimated Working age population (Aged 15 to 64) Elderly population (Aged 65 to 74) Elderly population (Aged 75 and over) Young population (Aged under 15)
  6. Increasing frequency and severity of natural disasters and rising risk

    of earthquakes directly under the Tokyo metropolitan area. Damage to Okutama-Nippara Highway by Typhoon No.19 in 2019 Satellite photo of Typhoon No. 19 in 2019 The global climate change crisis is having a serious impact on the environment and daily life in Tokyo, including the frequency of natural disasters. Source: Assumption of damage to Tokyo from an earthquake directly under the Tokyo metropolitan area, etc. (released April 18, 2012) https://www.bousai.metro.tokyo.lg.jp/taisaku/torikumi/1000902/1000401.html A massive Nankai Trough earthquake is assumed to cause a tsunami of up to 30 meters or more in the island areas, resulting in about 1,800 deaths. Global Climate Change Crisis Preparation for an earthquake directly under the Tokyo metropolitan area Source: Assumed damage to Tokyo from a massive Nankai Trough earthquake, etc. (released on May 14, 2013) https://www.bousai.metro.tokyo.lg.jp/taisaku/torikumi/1000902/1000402.html Source: "The 'Future Tokyo' Strategy" Vision (Summary Version) (December 2019) https://www.seisakukikaku.metro.tokyo.lg.jp/basic-plan/author53762/gaiyou.pdf 6 1.2 Significance of Tokyo Digital Twin Initiative Earthquake occurred in Northern Part of Tokyo Bay (M7.3) intensity 7 6 upper 6 lower 5 upper 5 lower 4 3 and under Hachijojima Kozushima Niijima Shikinejima It is assumed that there is a 70% probability of an earthquake directly under the Tokyo metropolitan area occurring in the next 30 years, with a maximum death toll of approximately 10,000 people and 5,170,000 people having difficulty returning home.
  7. Responding to changes in human flow and logistics is key

    to inter-city competition. Changes in human flow and logistics are enormous Because the e-commerce market is expected to expand further, if the infrastructure for new means of transportation such as drone delivery is delayed, we will be left behind the world. The number of air passengers worldwide is expected to nearly double to 7.8 billion by 2036. If we do not meet the strong demand for international business jets and other services, we will fall behind the rest of the world. Source: "The 'Future Tokyo' Strategy" Vision (December 2019) https://www.seisakukikaku.metro.tokyo.lg.jp/basic-plan/author53762/vision.pdf Source: based on materials published by IATA (International Air Transport Association) 7 Estimated future air passenger traffic in major countries Source: Ministry of Economy, Trade and Industry, "FY2019 International Economic Research Project for Building an Integrated Domestic and Foreign Economic Growth Strategy (Market Survey on Electronic Commerce) Report https://www.meti.go.jp/press/2020/07/20200722003/20200722003.html BtoC-EC (electronic commerce) market size in Japan 77,880 84,590 95,130 111,660 127,970 137,746 151,358 165,054 179,845 193,609 2.84% 3.17% 3.40% 3.85% 4.37% 4.75% 5.43% 5.79% 6.22% 6.76% 0.00% 1.00% 2.00% 3.00% 4.00% 5.00% 6.00% 7.00% 0 20,000 40,000 60,000 80,000 100,000 120,000 140,000 160,000 180,000 200,000 220,000 2010年 2011年 2012年 2013年 2014年 2015年 2016年 2017年 2018年 2019年 EC市場規模(左目盛) 物販系EC化率(右目盛) 0 2 4 6 8 10 12 14 16 ア メ リ カ 中 国 イ ギ リ ス 日 本 ス ペ イ ン ド イ ツ イ ン ド イ タ リ ア フ ラ ン ス イ ン ド ネ シ ア タ イ ト ル コ Number of air passengers 2016年 2036年 (hundred million people) (hundred million people) 1.2 Significance of Tokyo Digital Twin Initiative USA UK Spain France Thailand India China Japan Germany Italy Indonesia Turkey EC market size (left scale) EC ratio of product sales (right scale) (Year)
  8. Pursuing a "new life" with the experience gained through the

    COVID-19 Disaster. Source: The "Future Tokyo" Strategy (March 2021) https://www.seisakukikaku.metro.tokyo.lg.jp/basic-plan/mirainotokyo-senryaku/html5.html#page=1 8 Create a society that connects diverse people in real and virtual life Ensure an environment where everyone can live their own life Communicate the way of working and living from Tokyo Establish a new standard for safe and secure life Create innovation through connections among diverse people Weaving "new connections" and pursuing safe and secure "new lifestyles". 1.2 Significance of Tokyo Digital Twin Initiative
  9. Creating a strong and sustainable society that generates new value.

    Source: The "Future Tokyo" Strategy (March 2021) https://www.seisakukikaku.metro.tokyo.lg.jp/basic-plan/mirainotokyo-senryaku/html5.html#page=1 9 Strong promotion of “structural reform” ~ Promoting reform by going to the roots of the issues ~ Realization of “Sustainable Recovery” ~ Toward a strong and sustainable society ~ ◼ COVID-19 crisis highlights structural challenges facing Japanese society, including lagging digitalization ◼ Japan could be left far behind in the global competitive agenda ◼ Determine the essence of change, get to the root of the issues, and strongly promote structural reform ◼ Aiming for recovery for the future ◼ Promoting “Sustainable Recovery" with a view to realizing sustainable livelihoods for people ◼ Creating a strong and sustainable society, rather than simply returning to the society before the COVID-19 1.2 Significance of Tokyo Digital Twin Initiative
  10. As a city with diversity, it is necessary to be

    attentive to diverse values. Source: The "Future Tokyo" Strategy (March 2021) https://www.seisakukikaku.metro.tokyo.lg.jp/basic-plan/mirainotokyo-senryaku/html5.html#page=1 10 ◼ A city with true diversity. ◼ The most foreigner-friendly city in the world. ◼ Japanese and foreign children understand each other's values and learn together. ◼ International students who have studied at universities in Tokyo are at the forefront of business and technological development. ◼ Accessible environment with high quality in both software and hardware. The Tokyo of the 2040s as we aspire to be 1.2 Significance of Tokyo Digital Twin Initiative
  11. Strongly promote DX in all fields, and drastically change the

    industrial structure. Source: The "Future Tokyo" Strategy (March 2021) https://www.seisakukikaku.metro.tokyo.lg.jp/basic-plan/mirainotokyo-senryaku/html5.html#page=1 11 Accelerating Change with the power of startups Pioneering the "Tokyo of the Future“ by promoting DX Creating the strongest economic and financial city in Asia Thorough digitization of Public Administration Take the COVID-19 disaster to a good opportunity for progressing industry No one is left behind in the digital divide Overcome the lagging behind the world and win international competition through "blast-speed" digitization 1.2 Significance of Tokyo Digital Twin Initiative
  12. 12 We will promote initiatives that are comparable to those

    of overseas cities. Finland (Helsinki) Australia (Victoria) Source:Victoria State Government HP(https://www.land.vic.gov.au/maps-and-spatial/maps-and- spatial-news/3d-buildings-data-of-major-victorian-regional-centres-now-available) In Helsinki, the city has built a 3D city model, created and published a viewer, and created open data in the Kalasatama area of the city. Source:Kalasatama digital twins(https://www.hel.fi/static/liitteet- 2019/Kaupunginkanslia/Helsinki3D_Kalasatama_Digital_Twins.pdf) Victoria releases highly detailed, high-quality 3D city models covering 20 regional cities across the state as open data. 3D City Model Victoria 3D Model 1.2 Significance of Tokyo Digital Twin Initiative
  13. 13 Singapore United Kingdom Source:Case Study: National Underground Asset Register

    (NUAR) Pilot Programme」 ( https://www.cdbb.cam.ac.uk/news/case-study-NUAR-pilot-programme ) (Viewed October 18, 2021) Singapore's National Land Agency has created a platform to provide geospatial information of roads and buildings, land ownership, demographics, etc. Source:Singapore Land Authority(SLA)「OneMap3D」(https://www.onemap3d.gov.sg/main/ In the UK, a mapping information infrastructure has been developed to allow underground infrastructure owners to securely share existing underground asset data with authorized users. Onemap3D National Underground Asset Register We will promote initiatives that are comparable to those of overseas cities. 1.2 Significance of Tokyo Digital Twin Initiative
  14. As the capital of Japan, it is required to promote

    the spread of the project to other cities in Japan. Ripple Effects on Other Municipalities In advanced municipalities (e.g. Shizuoka Prefecture), efforts to create a digital twin, such as the development of 3D models of cities, have sprouted. Tokyo is expected to be the first city to take this initiative, thereby promoting the spread of innovations throughout Japan. Source: Shizuoka Prefecture, “Shizuoka Prefecture‘s Aim to Utilize 3D Data in the Near Future” https://www.zenken.com/kensyuu/kousyuukai/H31/659/659_sugimoto.pdf Examples of open 3D point cloud data Leading dissemination throughout Japan 14 1.2 Significance of Tokyo Digital Twin Initiative
  15. Tokyo, the world's most open city, attracting people, goods, and

    money from all over the world. Overcome international intercity competition Source: The "Future Tokyo" Strategy (March 2021) https://www.seisakukikaku.metro.tokyo.lg.jp/basic-plan/mirainotokyo-senryaku/html5.html#page=1 15 ◼ Tokyo will evolve into the world's most open economic and financial city, and global companies from around the world will operate in Tokyo. ◼ Highly skilled human resources from around the world will gather in Tokyo, and new innovations will continue to be born. ◼ The official language of business will be English, and a strategic business area will be formed. ◼ International schools will be enhanced, and everyone around the world can live at the same level of stress-free life as in their home countries. ◼ Many world-leading innovators will be produced. 1.2 Significance of Tokyo Digital Twin Initiative
  16. Significance of Tokyo Digital Twin Initiative ◼ Extremely diverse issues

    are concentrated. ◼ A social infrastructure that contributes to solving problems and improving the QOL of Tokyo residents is needed. ◼ High ripple effect on other local governments is expected. ◼ It can be an advantage in international intercity competition. Responding to diverse needs of Tokyo residents Ripple effects on other local governments Overcome international intercity competition Declining presence of The Japanese economy Delay in digital shift manifested Global Climate Change Crisis Low birthrate, aging and declining population Significant changes in human flow and logistics Preparation for an earthquake directly under the Tokyo metropolitan area (Source) Excerpts from the "Future Tokyo" Strategy Adapting to the new normal "Explosive" Digitalization and Structural Reforms Sustainable Recovery etc. Leading Japan through the spread to other municipalities under the banner of social implementation in Tokyo. (Source) Changes in Social Conditions: Excerpts from "Future Tokyo" Strategic Vision, etc. 16 1.2 Significance of Tokyo Digital Twin Initiative
  17. 1.3 Tokyo Metropolitan Government's Initiatives Related to Digital Twin As

    one of the 20+1 strategies to be addressed by 2030, "Strategy 10: Smart Tokyo/TOKYO Data Highway Strategy" is set to "realize a complete digital twin", where real- time data can be utilized in all fields and used for decision-making and policy-making by 2030. The promotion of the digital twin has been identified as supporting the realization of the three cities (Safe City, Diversity City, and Smart City), and is expected to "update the metropolitan government," "improve the quality of life of Tokyo residents and visitors," and "enhance the earning power of Tokyo-based companies. The Digital Twin Realization Project includes the construction of a public-private collaborative data platform after 2020 and the realization of a digital twin through the fusion of cyber and physical space. < December 2019 > < February 2020 > < March 2021 > Tokyo Metropolitan Government's Long-Term Strategy Positioning the promotion of the digital twin in long-term strategy. 17 (出典) "The 'Future Tokyo' Strategy" Vision, https://www.metro.tokyo.lg.jp/tosei/hodohappyo/press/2019/12/27/07.html Source: Tokyo Metropolitan Government, "Smart Tokyo Implementation Strategy" https://www.metro.tokyo.lg.jp/tosei/hodohappyo/press/2020/02/07/12.html Source: Tokyo Metropolitan Government, The "Future Tokyo” Strategy https://www.seisakukikaku.metro.tokyo.lg.jp/basic-plan/choki-plan/
  18. 1.3 Tokyo Metropolitan Government's Initiatives Related to Digital Twin Tokyo

    Metropolitan Government's Long-Term Strategy Accelerating the development of the infrastructure for the realization of the digital twin is positioned in the latest long-term strategy. 18 Accelerating Infrastructure Development for Realization of the Digital Twin ⚫ Develop 3D topographic data throughout the metropolitan area as the basis for the digital twin. ➢ Scheduled to be acquired by the end of FY2022 ⚫ Preliminary use in the field of disaster prevention ➢ Simulate damage from flooding and landslides on 3D city models, etc. ➢ For the other 8 areas, the fields to be prioritized for service implementation will be determined based on the characteristics of each region, etc. ⚫ Promote initiatives for full-scale operation of the Tokyo Data Platform ➢ Establishment of data collaboration infrastructure ➢ Creating use cases through pilot operations < February 2022 > Source: Tokyo Metropolitan Government, The "Future Tokyo” Strategy version up 2022, https://www.seisakukikaku.metro.tokyo.lg.jp/basic-plan/choki-plan/
  19. 2.1 Value of Digital Twin Digital Twin Improves QOL of

    Tokyo Residents and QOS of Tokyo Metropolitan Government. Digital Twin Conceptual Diagram Expected Effects 20 1 Real-time understanding of urban conditions in physical space (real space) in cyberspace 2 Analysis and simulation using up-to-date, real- time data 3 Utilize data for various purposes by feeding back the results of visualization, analysis, and simulation to the physical space Society5.0 Cyber-space (Virtual-space) Physical-space (Real-space) Tokyo 1 Analysis and Simulation Real Time Data Acquisition Tokyo 3 Feedback Tokyo Data Platform 3D digital map 2
  20. 2.2 What is the complete digital twin that we aim

    to realize? Based on existing plans and related policies, 9 fields are assumed as focus fields. Digital Twin Target Fields and Services : 9 Fields Base : 9 Fields in the Smart Tokyo Implementation Strategy (High-level Plan) ◼ Tokyo Data Platform Council, Areas of study (under consideration) ◼ Public-Private Partnership Data Platform, Basic Policy ◼ Tokyo Metropolitan Open Data Catalog Site, Priority Areas for Open Data ◼ Image of the city's digital twin utilization in the 3D visualization demonstration project Study fields and services in related plans ◼ The “Future Tokyo” Strategy ◼ Tokyo Disaster Prevention Plan 2021 ◼ Bureau of Citizens and Culture, Tokyo Metropolitan Government, “Public Opinion Survey on the Lives of Tokyo Residents”. ◼ Tokyo Bay eSG Project version1.0 Disaster Prevention Town Planning Mobility Education Working style Industry Energy Nature Wellness + Items that need to be addressed as indicated in the metropolitan government's plan and polls (Climate crisis, COVID-19, disaster prevention, medical and sanitation) 21 Concept of Fields
  21. Realize the digital twin by 2030 and build a continuous

    improvement cycle by 2040. 22 Disaster Prevention Town Planning mobility energy Nature Wellness Education Working Style Industry Note: "Complete Digital Twin" is a concept described in "The 'Future Tokyo' strategy". Degree of Data Utilization (Advancement) Users (Government, Companies, Citizens of Tokyo) Field Step 1: Expand the number of users and the field of use Step 2: Conduct advanced simulation using high-precision data Utilizing real-time data in “ALL" target fields by 2030 Definition: A state in which 3D city models and interfaces are developed and continuously updated, and a variable system is established in which "some" data of the city can be used for decision-making by the metropolitan government, businesses, and citizens, and for policy-making by the metropolitan government in "all" target fields. Image of the "perfect digital twin" that we aim to realize 2.2 What is the complete digital twin that we aim to realize?
  22. 3.1 Overall Picture of Digital Twin Study the overall structure

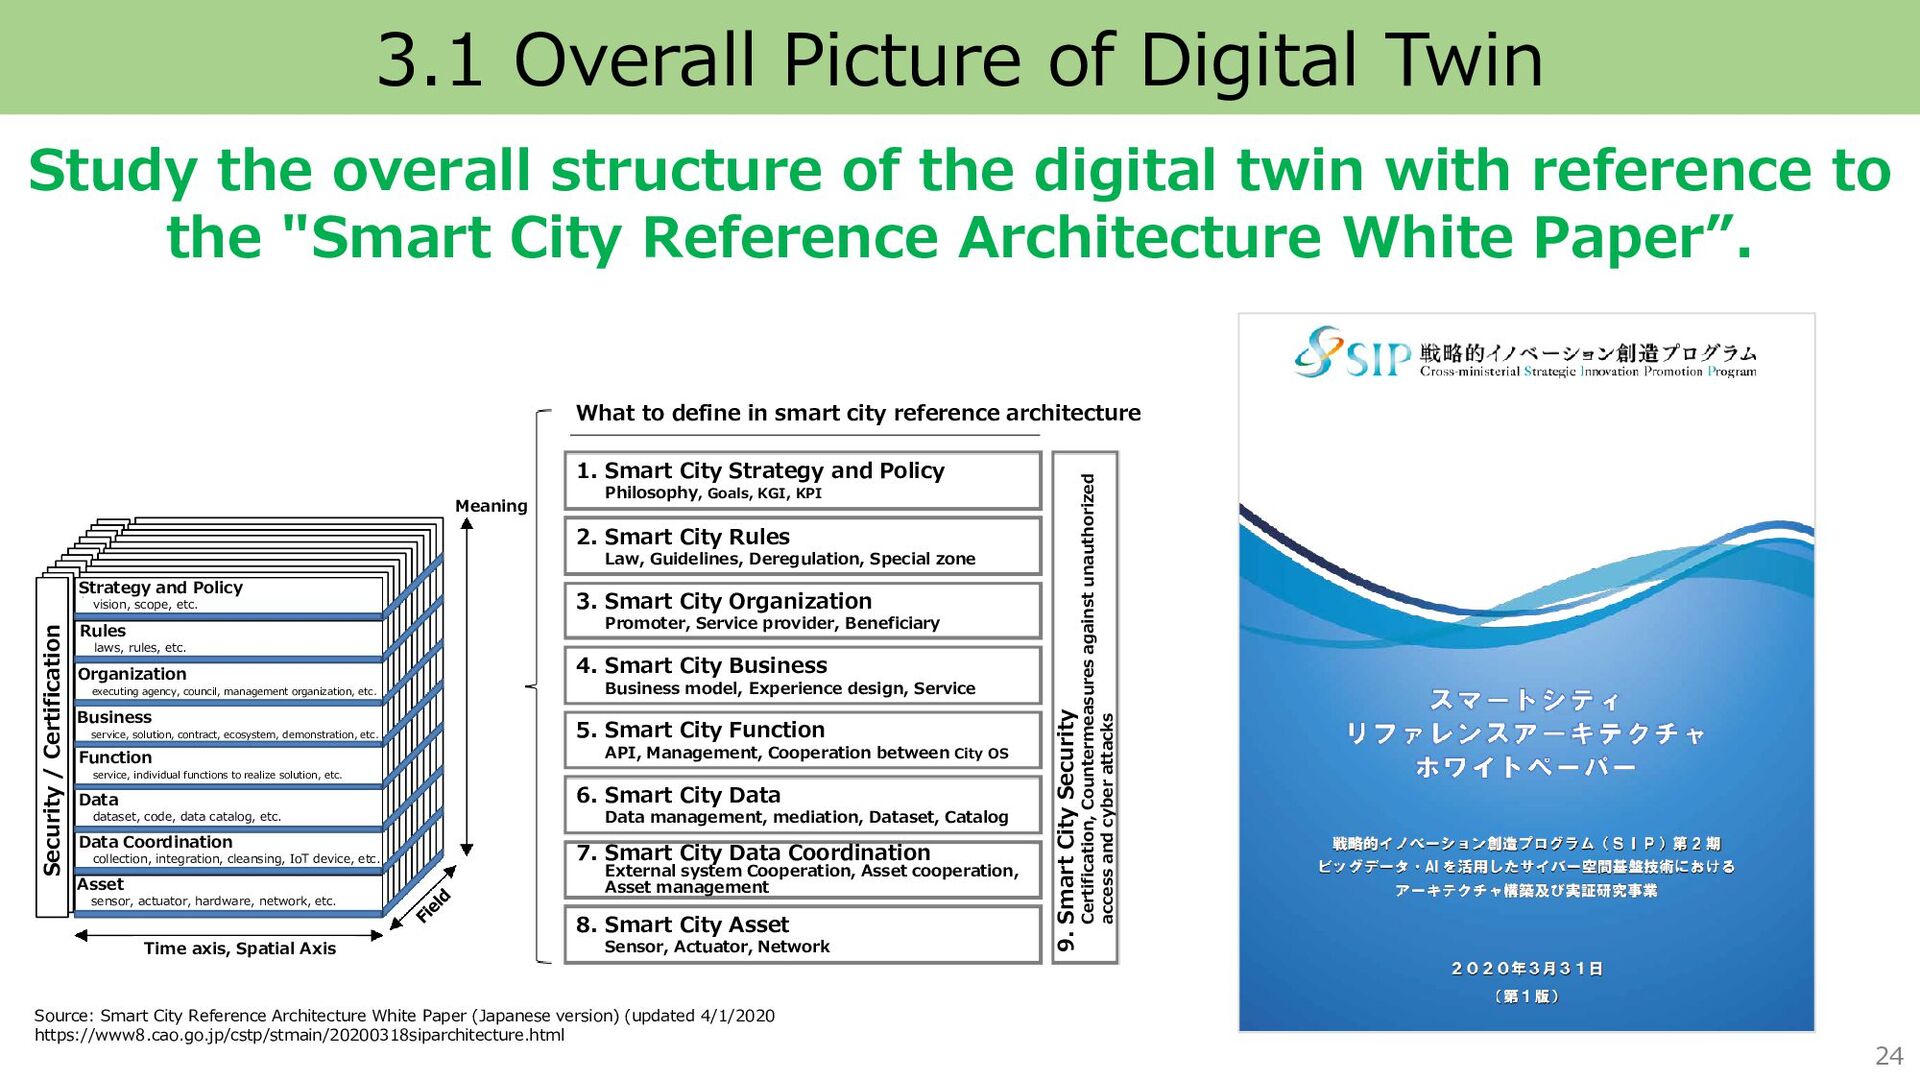
    of the digital twin with reference to the "Smart City Reference Architecture White Paper”. Source: Smart City Reference Architecture White Paper (Japanese version) (updated 4/1/2020 https://www8.cao.go.jp/cstp/stmain/20200318siparchitecture.html 24 Security / Certification 1. Smart City Strategy and Policy Philosophy, Goals, KGI, KPI 3. Smart City Organization Promoter, Service provider, Beneficiary 2. Smart City Rules Law, Guidelines, Deregulation, Special zone 4. Smart City Business Business model, Experience design, Service 5. Smart City Function API, Management, Cooperation between City OS 6. Smart City Data Data management, mediation, Dataset, Catalog 7. Smart City Data Coordination External system Cooperation, Asset cooperation, Asset management 8. Smart City Asset Sensor, Actuator, Network What to define in smart city reference architecture 9. Smart City Security Certification, Countermeasures against unauthorized access and cyber attacks Strategy and Policy vision, scope, etc. Rules laws, rules, etc. Organization executing agency, council, management organization, etc. Business service, solution, contract, ecosystem, demonstration, etc. Function service, individual functions to realize solution, etc. Data dataset, code, data catalog, etc. Data Coordination collection, integration, cleansing, IoT device, etc. Asset sensor, actuator, hardware, network, etc. Time axis, Spatial Axis Meaning
  23. 3.1 Overall Picture of Digital Twin The digital twin consists

    of 4 elements: Strategy, Foundational Elements, Ancillary Elements, and Services. Ancillary Elements Foundational Elements Simulator Viewer Static data Security Cyber Space System Data System Linkage Strategy Application Dynamic data Geospatial data Data Interface Interface System Physical Space Infra- structure Network Sensing Device Device Relay equipment Short-distance network Wide-area network Operation Model Rules and Specifications Organization Digital Twin Services Database Security Database and Data Catalog Data Linkage 25
  24. 3.2 Components of Digital Twin Layer Broad category Middle category

    Description Cyber space Data Data body to be utilized on Digital Twin Data Data body to be utilized on Digital Twin System Various systems operating on Digital Twin Application Various software running on Digital Twin Database Environment for storing various data to be utilized on Digital Twin Interface Functions and APIs to link with each data and each system Physical space Infrastructure Facilities and equipment for generating and transferring data to be utilized on Digital Twin Network Facilities for transferring digital data Sensing device Equipment for acquiring and generating digital data Common Security Functions and measures necessary to protect Digital Twin from internal and external threats Technical measure Security features that system and infrastructures should have Administrative measures Administrative measures required in the maintenance and operating of Digital Twin Data, Systems, Infrastructure, and Security are defined as the fundamental elements of the Digital Twin. 26
  25. 3.3 Components of Cyber Space Broad category Middle category Sub

    category Description Data Data Dynamic data Time series data that is frequently update and generated in real time Static data Data that is updated relatively infrequently and stored and referenced for long periods of time Geospatial data Data with information about the location of a specific point or area. It also includes information about various events associated with the location. System Application Simulator Software for simulation using data Viewer Software for visualizing data Database Data store, Data catalog Environment for aggregating and managing data Interface System Linkage Interface between systems Data Linkage Interface between each device and the databases Data and Systems are defined as components of Cyber Space. 27
  26. Reference: Example of data 28 Category Example Description Dynamic data

    Sensing data Data acquired from various sensing devices Movement data Data on movement of people and mobility SNS data Text and other data transmitted via SNS Static data Statistics data Data on various statistics Analysis data Result of data-driven analysis and simulation Document data Reports and other electronic data Geospatial data Topographic map Map information representing elevation, topography, rivers, coastlines, roads, buildings, etc. Aerial image Photographs taken by aircraft Satellite image Data acquired from satellites Network data Data represented by a combination of “nodes” and “links” GIS data Data that can be used in Geographic Information System Point cloud data 3D point data with horizontal coordinate and height information 3D digital map Vector data with semantic structure of buildings, roads, and other geographic features BIM・CIM Vector data reproducing detailed components of buildings and infrastructure structure 2D 2D 2D 2D 2D 3D 3D 3D 3D
  27. 3.4 Components of Physical Space Broad category Middle category Sub

    category Description Infrastruc- ture Network Short distance network Network to deliver data generated from devices to repeater equipment Repeater equipment Equipment to receive data generated from each device and transfer the data through long distance network such as Internet Long distance network Network to deliver data from repeater equipment to remote servers, etc. Sensing device Device Equipment from which data is generated Infrastructure is defined as components of physical space. 29
  28. 3.5 Elements common to Cyber and Physical Space Broad category

    Middle category Sub category Description Security Technical measures Certification Functions to verify that users, services, systems, devices, etc. connected to digital twin are the correct connection partners, and to grant access privileges to them Encryption Functions to provide appropriate security encryption for communications and data managed by the digital twin according to each confidentiality Unauthorized access prevention (Firewall) Functions to block unauthorized access to the digital twin Unauthorized access detection / blocking Functions to detect and block unauthorized access that cannot be handled by firewalls, such as DoS attacks and attacks on application layer vulnerabilities Administrative measures Vulnerability management Collect information on vulnerabilities and apply patches as needed to address them Log management Obtain logs of communications and processes performed by the digital twin Security is defined as a common element of Cyber and Physical Space. 30
  29. 3.6 Other Factors Present elements and ideas on Strategy, Ancillary

    Elements, and Services. 31 Layer Category Factor Description Strategy Strategy Guideline for designing the foundational elements, ancillary elements, and services of the digital twin Target Goals to be achieved through the realization of the digital twin Evaluation index Quantitative indicators to show the degree of achievement for each goal (KGI, KPI) Ancillary Elements Operation model Mechanisms for maintaining and operating the digital twin Organization Entities and roles for the development and operation of the digital twin Entities Entities related to the digital twin Roles Roles of each entity Rules and specifications Rules and specifications required for the maintenance and operation of the digital twin Laws and regulations Laws, regulations, and ordinances to be complied with in the development and operation of the digital twin Terms and Guidelines Rules for the maintenance and operation of the digital twin and terms for the use of data and services Standard specifications Specifications and quality indicators that should be standardized for mutual use of systems, data, etc. among entities Services Services Services provided by using infrastructure elements of the digital twin Administrative services Services provided by the public administration using the infrastructure elements of the digital twin Internal services used by administrative staff External services used by residents and companies Private services Services provided by private companies and organizations (area management groups, etc.) using data, systems, etc. that are open to the public by the government
  30. 3.6 Other Factors (Operational model) Digital Twin scales are categorized

    as Building, Area, and City. Scale Building Area City Objective Shortening of construction period, improvement of quality, and Preventive measures Business sophistication and efficiency Resolving urban issues and improvement of services for residents Main Operating Entity Private company Area management organizations and private companies Administration Image https://www.kajima.co.jp/news/press/202005/pdf/11a1-j.pdf https://www.shimz.co.jp/toyosu/concept/digitaltwin/ https://info.tokyo-digitaltwin.metro.tokyo.lg.jp/ Building Information FM Platform Cooperation BIM data Physical Space Cyber Space Cameras or Sensors 3D Digital Data + Monitoring Data Simulation Advanced Facility Convenience & New Service Town with high QOL
  31. Step 1: Establish and operate a Digital Twin within the

    Agency Started internal development and operation of the Urban Digital Twin. The value will increase by interlinking data and functions with others. 【Tokyo Metropolitan Government】 Urban Digital Twin 【Companies】 Digital twin of the building 【Companies】 Digital twin of the building 【 Area Management Organizations 】 Digital twin of the area 【 Local Government】 Urban Digital Twin Release of various specifications and catalogs (data, API) Linking data and APIs Step 2: Mutual Collaboration 33 3.6 Other Factors (Operational model)
  32. Data Provider Provide data necessary for the maintenance and operation

    of the digital twin Operator Promote the digital twin strategy and operate the infrastructure Agency Infrastructure Users Provide administrative services using infrastructure The Digital Twin is operated through data linkage between each entity. 34 Service user Use and benefit from services Advisor Advise on the direction of overall and each service Evaluator Constantly review the services and operations, and provide regular feedback Service provision and feedback Data provision and feedback External Infrastructure Users Provide private services using infrastructure Data provision and feedback external evaluation Examples University Private company External expert Residents of Tokyo 34 Administration Private company University / Researcher Residents of Tokyo Administration Administration Private company Residents of Tokyo Private company University / Researcher Entities Legend 3.6 Other Factors (Operational model)
  33. Seven entities are defined as the main actors in the

    development and operation of the Digital Twin. 35 Entities Description Operator Promote the digital twin and operate the platform (environment where data and systems are aggregated and provided) Data provider Maintain and provide data necessary for operation of the digital twin Internal infrastructure users Provide administrative services using infrastructure Use the data and systems of the digital twin infrastructure for internal operations External infrastructure users Provide private services using infrastructure Service users Use and benefit from the services provided through the digital twin Advisor Advice the promoting entities on the operation and direction of each service Evaluator Constantly review the services and the operations, and provide regular feedback 3.6 Other Factors (Entities)
  34. 3.6 Other Factors(Role) Examples of the main roles of each

    entity were defined. 36 Entity Roles Description Operator Supervise overall and develop strategy Develop and manage the overall strategy for the digital twin Provide overall management for the realization of the digital twin in accordance with the strategy Operate and manage organization Establish and manage the organization of the promotional entity, and coordinate and collaborate with related entities to ensure the smooth operation of the digital twin Operate the digital twin infrastructure Establish and operate the digital twin platform (environment where data are aggregated and provided) Review and release of standard specifications Consider and publish data standard specifications, quality standards, etc. Review and public rules Consider and publish rules and guidelines necessary for the maintenance and operation of the digital twin Data provider Maintain and provide data Maintain and acquire data and provide it to the digital twin platform Develop and operate infrastructure Develop and operate infrastructure (sensing device, etc.) to acquire data Internal users and service provider Develop and operate systems Develop and operate systems (simulators, etc.) required to provide services Develop and operate services Plan, develop and operate services Advisor Advise Advise on the strategy, operation, and policy of each service of the digital twin Evaluator Guide and feedback Monitor the operation status and the services, and provide guidance periodically
  35. 3.6 Other Factors(Rules and Specifications) Element Examples of items Laws

    and regulations Laws and regulations regarding data acquisition and the creation of the digital twins Laws and regulations regarding data analysis and simulation Laws and regulations regarding the release of data ant the provision of services Terms and guidelines Rules for data maintenance and acquisition Rules for providing and using data Rules for operating the digital twin platform Standard specification Standard for Data format Standard for data quality Specification for the tool and operating rules Examples of items to consider regarding rules and specifications were defined. 37
  36. Phase2 4.1 Steps to realize Digital Twin Supposing three phases

    to realize the Digital Twin. Operation and Expansion of Digital Twin Phase1 ◼ Consider items to be developed and the division of roles among them ◼ Consider the overall picture of the operation and the division of roles ◼ Consider rules and specifications necessary for operation ◼ Consider use cases and services ◼ Start operation of platform ◼ Expansion and linkages of various functions ◼ Update rules and specifications ◼ Implementation of each service Realization and Sophistication of Digital Twin ◼ Considerate policies for the sophistication of digital twins ◼ Considerate policies for the functions, specifications, etc. to realize sophistication FY2020- FY2023ー FY2030- Construction of Digital Twin Platform Phase3 39
  37. 4.1 Steps to realize Digital Twin For the time being,

    construction of platform and ecosystem, rule development, and implementation of services in priority fields are focused. Phase Construction of Digital Twin Platform Realization and Sophistication of Digital Twin Operation and Expansion of Digital Twin Component Steps Strategy Maintenance and operation strategy study Real-time operation, external collaboration Base Element Ancillary Element Services Use case study / Demonstration project for service implementation Service implementation (priority fields) Real-time data utilization service implementation Review and development of standard specifications and quality standards Utilization of existing infrastructure / Development and utilization of new infrastructure Establishment of an environment for real-time data utilization Dissemination and expansion, external collaboration Infra- struc- ture Specifi- cations Opera- ting Rules Review and maintenance of various rules for operation Addition and update of various specifications and rules based on operations and trends in the country, etc. Consideration and development of various specifications and rules related on real-time data utilization data External Viewer Construction Internal data store, data catalog, and viewer construction Provision and update of real-time data Data openness, collaboration with data outside of the Agency, and Study and construction of data updating mechanism Internal data aggregation Simulator development, linkage, and function expansion Realization of highly real-time simulation system Create and update roadmap (guidelines for construction and operation of the digital twin), confirm policies with external experts FY2020~ FY2023~ FY2025~ FY2030~ 40
  38. 4.2 Implementation of base elements 41 The Digital Twin Platform

    is established to serve as a node for data linkage in order to aggregate and utilize data in TMG. Each Depart- ment User Exter- nal User Internal Data Store Internal Data Catalog External Viewer Internal Viewer Tokyo Data platform Tokyo Metropolitan Government Open Data Catalog Site Digital Twin Platform Linkage Each data provided Data visualization data superim position Provision of each data (data from other stations, etc.) Each data provision and analysis Database Applications Users Interface Interface Various infrastructures (Sensors, etc.) Each Department User Departments in Tokyo Data Storage Various External Infrastructure (Sensors, etc.) state ownership Owned by private company Owned by a ward, city, town or village Owned by universities and Research Institution External User Govern ment Citizen Linkage of data held by each entities Linkage of data held by various entities Each Department Simulators Linkage of data held by various entities Infrastructure Legend : Utilization of Simulation Results
  39. 4.2 Implementation of base elements Each element is classified into

    common areas with the aim of completing development in phases. 42 Elements to be developed by the start of operations (at the completion of Phase 1) Elements that are expected to be commonly developed in the field Elements expected to be developed in each field Development Category by field by field common to all fields Infrastr ucture Data System Dynamic Data Static data Geospatial Data Simulator Viewer Network Sensing devices Interface Base Elements Database common to all fields by field Example Sensors, cameras, etc. LTE/5G, Wi-Fi, etc. common to all fields common to all fields by field by field Agency Data Store Each API Department Simulators Agency Viewer / Viewers outside the government 3D Digital Map Sensing data, movement data, SNS data, etc. Statistical data, analytical data, document data, etc. by field Various GIS data, etc. Data Applica tions common to all fields Common API
  40. Aggregate each data mainly within the TMG, and make it

    available to the public through external viewers, etc. 43 Class Category Example of data Dynamic data Sensing data ⚫ Real-time broadcast of river monitoring ⚫ Data acquired from smart pole Movement data ⚫ Location of Tokyo bus Static data Statistics data ⚫ Census: Total population, Rate of change in population Document data ⚫ Materials, minutes, etc. of Session for Social Implementation of “Urban Digital Twin” in Tokyo Geospatial data 3D digital map ⚫ Building model ⚫ Underpass ⚫ Transportation infrastructure: roads, bridges Point cloud data ⚫ ICT-utilized construction 3D point cloud data GIS data ⚫ National land numerical data ⚫ GIS data of urban planning decisions ⚫ Flood inundation area map, storm surge inundation area map ⚫ Shelters, public facilities, bus stops and bus routes 4.2 Implementation of base elements
  41. Item Implementation Data acquisition People ・ How to handle the

    “right of portrait and right to privacy” of people who may appear in the video, etc. ・ Is the handling of location information (people flow) by GPS, etc. appropriate from the viewpoint of “personal information” protection? ・ Is prior consent from the target entity necessary? How is it appropriate to obtain consent (explanation of purpose, scope of use, etc.)? Cities ・ How to consider the possibility of architectural works, arts, etc., which are recognized as copyrightable, to be captured in the image. Digital Twin construction ・ Does the reproduction of real space constitute a reproduction or adaptation of a work? ・ Does the reproduction of real space constitute an infringement of the "right to maintain identity"? Data analysis (simulation) ・ Is it possible to process data provided/shared by each entity or obtained through API linkage? Data and service provision ・ Is the provision of services using a virtual space that reproduces real space using a trademarks or unfair competition? ・ How should the terms of use of the data and services provided by the Digital Twin be considered (i.e., is there any possibility of being held liable in any way for any deficiencies in the data, services, etc.)? Data release ・ Is there a "copyright" problem in distributing processed data? ・ What "security" should be considered? 4.3 Maintenance of ancillary elements(related laws and regulations) Continuing considering legal actions or studies to be taken by TMG. 44
  42. Reference: Guidelines, etc. related to relevant laws and regulations (examples)

    45 Item Document Name Document Content Created by Portrait Rights Portrait Rights Guidelines ⚫ Organized ideas as a basis for on-site personnel of digital archiving institutions to process portrait rights. Japan Society for Digital Archive Personal Information / Location Information Guidelines on the Act on the Protection of Personal Information ⚫ Specific examples to support the activities of businesses in ensuring the proper handling of personal information. Personal Information Protection Commission Guidelines for the Protection of Personal Information in the Telecommunications Business ⚫ A summary of restrictions on the use of location information and other information handled by telecommunications carriers. Ministry of Internal Affairs and Communications Sufficient Anonymity" in the Telecommunications Business Guidelines ⚫ A compilation of rules on how location information handled by telecommunications carriers can be processed and used for social purposes, based on the purpose of protecting the secrecy of communications and privacy under the Telecommunications Business Law. Telecommunications Carriers Association, etc. Guidelines for Utilization of "Device Location Data" such as location information ⚫ Industry-wide standards to promote sound and sustainable use of device location data LBMA Japan Data Terms of Use Contractual guidelines for data use authorization ⚫ A summary of the methods and ideas used to contractually define appropriate and equitable authority to use data created, acquired, or collected in connection with transactions between businesses. IoT Acceleration Consortium Ministry of Economy, Trade and Industry Service Development and Provision Guidelines for the development of AR services for use in facilities, etc. ⚫ AR A compilation of legal and ethical issues that are likely to cause problems in the provision of services, general ideas that can be used as reference for overcoming such problems, and examples of technical measures that have been adopted in practice. XR Consortium
  43. 4.3 Maintenance of ancillary elements (rules and guidelines) Organizing rules

    and guidelines for Digital Twin operation and internal data provision on a priority basis. 46 Target Item Implementation Platform operation Operation of Agency Infrastructure ・ Consider detailed policy of internal platform operation ・ Consider the procedures for using internal platform Data maintenance (Internal) Data Collection ・ Arrangements for making the data generated / collected by each business available on digital twin ・ Consideration of open data licensing policy when collecting data for the purpose of public release Data provision Storing data in the Agency's internal infrastructure ・ The rules for providing data to the Digital Twin Platform Data use Establishment of rules for data use ・ Establishment of license and terms for data use ・ Present examples of procedures for data cleansing, etc. by users ・ Consider rules for feedback by users to data, platform, etc. Open Data Licensing ・ Consider detailed policy of internal platform operation ・ Consider the procedures for using internal platform
  44. Reference: Open Data Licensing Type Outline Specific examples CC (Creative

    Commons) • Licenses for all copyrighted works (CC 4.0 also covers database rights.) • CC0 • CC BY • CC BY-SA • CC BY-ND • … ODC (Open Data Commons) • Licenses for data / databases • PDDL • ODC-By • ODbL PD (Public Domain) • State that belongs to no one indicating public domain • Those that have voluntarily relinquished their copyrights. • Works that are "not legally recognized as copyrightable," such as works that are past the copyright protection period. Reference: http://faq.pf- sapporo.jp/license/%E3%82%AA%E3%83%BC%E3%83%97%E3%83%B3%E3%83%A9%E3%82%A4%E3%82%BB%E3%83%B3%E3%82%B9%E3%81%AE%E7%A8%AE%E9%A1 %9E.html, https://www.ipa.go.jp/files/000035470.pdf, https://www.jstage.jst.go.jp/article/johokanri/56/3/56_140/_pdf/-char/ja 47 Appropriate licenses must be considered and set when developing open data.
  45. Reference: Open Data Licensing Dual / Multi-licensing improves data versatility.

    Reference : https://www.kantei.go.jp/jp/singi/it2/densi/kettei/gl2_betten_1_gaiyou.pdf, https://creativecommons.org/licenses/by/4.0/deed.ja https://speakerdeck.com/furuhashilab/zheng-fu-biao-zhun-li-yong-gui-yue-falseruo-dian-dot-rigarumian-falseke-ti-woyi-lun-surukou-huo-woqie-rutameni-project-plateau https://sites.research.google/open-buildings/ Dual / Multiple Licenses ▶ Data can be made more versatile for use on other platforms. Government Standard Terms of Use / CC BY 4.0 PLATEAU → Multiple licenses for CC BY 4.0 + ODC BY 1.0, ODbL 1.0 Google Open Buildings → dual license for CC BY 4.0 + ODbL 1.0 ▶ There are cases where usage is restricted, such as DRM (Digital Rights Management) usage restrictions. 48
  46. 4.3 Maintenance of ancillary elements (standard specifications) Formulation of data

    standards, data quality, tools, and operation rules is important for cross-organizational data collaboration. 49 Items Implementation Data standard Format ・ Consider standard specifications for map data ・ Consider recommended formats for static and dynamic data / Create guidelines Metadata ・ Consider metadata items (data title, description, update frequency, coordinate, etc.) Data link ・ Consider how to link map data and dynamic / static data (e.g., link between 3D city model and people flow using coordinate) ・ Consider how to link map data (e.g., link between 3d city model and BIM data) ・ Consider common vocabulary for each data and rules for assignment and conversion of facilities IDs, etc. Data quality ・ Improve machine readability of data to be developed and provided ・ Organize and publish data quality standard Tool Data conversion ・ Provide data conversion software (converters, etc.) ・ Crate data conversion procedures Data catalog ・ Establish and operate internal data catalog to guide, search, and download data Operation rules ・ Organize the process of data maintenance such as cleansing and the entities, and create procedure manuals
  47. Items Document Author Year of publication Data standard Format ⚫

    The requirements for the development and operation of a 3D digital map of the city ⚫ Data product specifications for 3D digital maps of the city Tokyo Metropolitan Government March 2021 ⚫ Fundamental Geospatial data, Source form database, Geospatial Data Product Specification (Draft) 【Numerical Topographic Maps】 Version 2.3 Geospatial Information Authority of Japan April 2014 ⚫ Geospatial Data Product Specification Manual Geospatial Information Authority of Japan November 2019 ⚫ Standard Data Product Specification for 3D City Model ⚫ Standard Implementation Procedures for 3D city Model Ministry of Land, Infrastructure, Transport and Tourism March 2021 Metadata ⚫ JMP2.0 Specification Geospatial Information Authority of Japan ⚫ Geospatial Data Product Specification Manual Geospatial Information Authority of Japan November 2019 Data link ⚫ Manual for the Integration of BIM Models in 3D City Model with CityGML ⚫ Manual for the Visualization of Disaster Risk with 3D City Models Ministry of Land, Infrastructure, Transport and Tourism March 2021 ⚫ Basic information data linkage model for public administration Cabinet Secretariat June 2021 ⚫ Linkage model of administrative services and data (beta version) Cabinet Secretariat June 2021 Data quality ⚫ Data Quality Management Guidebook (beta version) Cabinet Secretariat August 2021 ⚫ Geospatial Data Product Specification Manual Geospatial Information Authority of Japan November 2019 Tool Data conversion ⚫ 3D City Model Data Conversion Manual Ministry of Land, Infrastructure, Transport and Tourism March 2021 Reference: Guidelines, etc. related to standard specifications (example) 50
  48. Fields Examples Contents Disaster Prevention Disaster simulation By simulating disasters

    in a virtual space and predicting and analyzing the damage, the system will be used to formulate safe and secure urban development plans and evacuation plans. Real-time monitoring and anomaly detection Monitoring and forecasting of data on flow rate, flow direction, and water pressure of drainage pipes, to detect abnormalities such as leakage and backflow at an early stage and utilize the data for prevention of flooding and inundation, review of inspection work (increase in frequency of daily inspection, etc.). Simulation of disaster impact area By observing the height structure of the ground surface using satellite images, areas that will be affected by disasters like torrential rains and volcanic eruptions will be predicted and signs will be detected, which will be used to formulate safe and secure urban development plans and evacuation plans, as well as to disseminate information. Town Planning Urban congestion forecasting Data on indoor and outdoor spaces in Tokyo (public spaces, metropolitan facilities, underground spaces, etc.) will be acquired to monitor and forecast congestion and used to disseminate congestion information to Tokyo residents and improve daily operational operations. Urban development simulation Setting hypothetical conditions for urban regeneration, urban development, landscaping, and other future visions of the city, and simulating sunlight, wind direction. This information will be utilized in development plans and explanations to the citizens. Smart planning Utilizing data on human flow, person trips, and other data related to movement, and simulating of optimal facility layout, traffic measures, and redistribution of space such as roads in order to predict the effects of implementing each measure. These results are also used in the formulation, evaluation, and review of urban planning. Mobility Urban traffic congestion forecasting The system acquires information of public transportation operations and traffic congestion in Tokyo, as well as on the availability of parking spaces at Tokyo facilities and grasps and predicts congestion conditions for use in disseminating congestion information to Tokyo residents, improving operation operations, and studying measures to relieve traffic congestion. Transportation network opening simulation Establishing hypothetical conditions such as traffic volume when a new transportation network is opened, and simulating traffic volume and congestion occurrence. Then the simulation results will be used in the transportation network development plan. Automated driving simulation For routes where automobiles, drones, flying cars, and other vehicles are expected to operate automatically, setting up weather conditions and other hypothetical conditions, conducting operational simulations, and use the simulations to examine routes for each type of mobility. 4.4 Service Implementation 51 Examples of Services in Focus Fields
  49. Fields Examples Contents Energy Urban CO2 Emissions Simulation Toward the

    realization of a "Zero Emission Tokyo" that contributes to virtually zero CO₂ emissions, various urban data will be used to understand and forecast CO₂ emissions from urban activities. These results will be used to study and implement various measures to reduce emissions. Estimation of solar power generation potential Estimating the potential for solar power generation on roofs and walls of building facilities in Tokyo and analyzing the effects of reducing environmental impact through the use of re-energy. Then using the results to examine decarbonization measures. Optimal ZEV charging facilities Placement simulation To promote the introduction and spread of Zero Emission Vehicles (ZEVs), simulate the optimal placement of charging facilities through traffic simulation, and use it to study the placement plan of charging facilities. Nature Behavior change by displaying the state of the biological and natural environment The carbon sink of forests, the status of climate change such as ocean acidification, and changes in ecosystems will be monitored, and how the ecological environment changes as a result of changes in the natural environment will be analyzed and used for measures to protect the biological and natural environment of Tokyo residents. XR-based natural environment experience service Realizing XR (VR and AR) tourism experiences that reproduce the images, sounds, smells, and winds of forests, lakes, parks, etc., to improve quality of life and promote awareness of environmental conservation behaviors. Prediction of climate change, etc. Utilizing past meteorological data, various urban data, the system predicts and displays climate change, the extent of guerrilla downpours, and the extent of impact at the time of eruptions such as Mt. Fuji. Wellness Real-time understanding of the health behavior of Tokyo residents and action guidance By grasping the health behavior status of Tokyo residents through devices and cameras, and visualizing health behavior indices, health promotion measures will be implemented, and Tokyo residents will be guided to take healthier actions, contributing to an increase in healthy life expectancy. Capture and map accessibility concerns Hazardous areas of concern for barrier-free access will be visualized and analyzed on a 3D map, and feedback will be provided for community planning. Infectious disease prevention and control Simulation The data on indoor/outdoor human movement and stay will be used to study countermeasures against infectious diseases by detecting and predicting the “Three Cs” (closed spaces, crowded places and close-contact settings). 52 4.4 Service Implementation
  50. 4.4 Service Implementation 53 Fields Examples Contents Education Experiential Education

    with XR To realize hands-on, practical education using XR (VR and AR) technology and contribute to improving the effectiveness and quality of education. Social Studies Learning with Virtual Archives of Cities By recording the city's history and the past of local cultural assets in a virtual space, XR technology can be used as an experiential history teaching tool for fieldwork and contribute to a better understanding of the region. Urban data acquisition learning As part of school classes, through efforts to acquire 3D data of cities through fieldwork and integrate them into a digital twin, this service will promote understanding of the region and digital technology while acquiring data for updating 3D maps. Working Style Conducting construction meetings remotely Conducting construction discussions via remote meetings using underground 3D models will significantly reduce the time required for travel and status checks, contributing to the creation of extra time. Chatbot text data analysis to improve customer service Linking an automatic response service AI chat-bot with the Digital Twin to visualize the content of inquiries by region and collect, integrate, and analyze data such as the text of inquiries to realize prioritized provision of services with high needs. Training, seminars, etc. using VR Contributing to the efficiency of seminars, training for employees and students by providing training simulators that utilize XR technology. Industry Utilization of Digital Twin in the manufacturing industry By developing a foundation for the introduction of digital twin, which can be used in the manufacturing field of the manufacturing industry, each company will be able to introduce digital twin to enhance the sophistication and productivity of the company's production process. Promote digitalization of agriculture To improve labor productivity in agriculture by introducing a digital twin to the agricultural production process to increase efficiency and sophistication of production. Development of virtual events Developing virtual events in cyberspace where various people can participate from remote locations in Japan and abroad and contributing to the activation of the event.
  51. 4.5 Digital Twin area development Start developing in the Smart

    Tokyo prior implementation areas, and expand initiatives to other areas in Tokyo. Source: Smart Tokyo Implementation Strategy https://www.metro.tokyo.lg.jp/tosei/hodohappyo/press/2020/02/07/documents/12_01a.pdf 54 2. Expand initiatives to other areas in Tokyo 1. Start in the prior implementation area Build a model Nishi Shinjuku Minami Osawa (Tokyo Metropolitan University) Metropolitan Area Bay Area Islands
  52. 4.5 Digital Twin area development Five prior implementation areas were

    selected. Area Regional Characteristics (Smart Tokyo) Metropolitan Area A transportation hub between Tokyo and the rest of Japan, and the economic and financial center of the city with a concentration of leading companies. Nishi Shinjuku The central area for business, commerce, and tourism in Tokyo and Japan, with the Tokyo Metropolitan Government Building and a row of skyscrapers. Bay Area The area with a large space suitable for new demonstrations and creating a bustling atmosphere for sports, events, etc. Minami Osawa The area in the western part of Tama New Town where academic research (Tokyo Metropolitan University) and urban development are linked. Islands The area rich in nature and blessed with primary industry and tourism resources. 55
  53. 4.5 Digital Twin area development In selection of the area,

    the regional characteristics of Tokyo and the location strategy, etc. are considered. In the “Grand Design for Urban Planning” (September 2017) established four area classifications ("Central Regional Hub Area", "New Urban Life Creation Area", "Tama Regional Hub Area", and "Natural Environment Symbiosis Area") based on regional characteristics. (Two Areas, "International Business Exchange Area" and "Tama Innovation Exchange Area", which serve as engines for Japan and the Tokyo region, are overlapped.) In the “Master Plan for Urban Planning Area” (March 2021), the future image of Tokyo is divided into four categories; • “Central hub” • “Vital and Lively hub” • “(Essential) Regional hub” • “Center of Life” Source: Grand Design for Urban Development https://www.toshiseibi.metro.tokyo.lg.jp/keikaku_chousa_singikai/grand_design.html Master Plan for Urban Planning Area https://www.toshiseibi.metro.tokyo.lg.jp/seisaku/master_plan/index.html Regional Classification in Grand Design for Urban Development Master Plan for Urban Planning Area 56
  54. 4.5 Digital Twin area development Source: List of Urban Revitalization

    Districts and Specific Urban Revitalization Districts https://www.chisou.go.jp/tiiki/toshisaisei/kinkyuseibi_list/index.html Policies for Utilization of Urban Development Systems for New Urban Development https://www.toshiseibi.metro.tokyo.lg.jp/seisaku/new_ctiy/katsuyo_hoshin/hoshin_02.html About "Tokyo Bay eSG Project" (Version 1.0) https://www.metro.tokyo.lg.jp/tosei/hodohappyo/press/2021/04/23/04.html In the "Urban Development Systems", base area where policy guidance is provided with an incentive for development are defined. (Core base districts, vitality and liveliness base districts, and core districts in key areas). In The Ministry of Land, Infrastructure, Transport and Tourism's "Project PLATEAU", the development level (LOD) for the Urgent Urban Revitalization Area is raised. Urgent Urban Revitalization Area (Data intensive development) Urban Development Systems Base Area Tokyo Bay eSG Project The "Tokyo Bay eSG Project" targets the Bay Area and sets a guideline to realize an urban model that balances sustainability and economy using leading technology and to share the model with society. 57 (Bay Area: "TOKYO WATER FRONT CITY" and new reclaimed land) In selection of the area, the regional characteristics of Tokyo and the location strategy, etc. are considered. Chiyoda Ward Chuo Ward Minato Ward Koto Ward [Specified area] Tokyo city centre and waterfront area January 25, 2012 Integration of regions (Formerly known as Tokyo Station/Yurakucho Station Area, Loop Route 2 Shimbashi/Akasaka/Roppongi Area, Tokyo Waterfront Area) Chiyoda Ward Taito Ward Akihabara/Kanda area Minato Ward Shinagawa Ward [Specified area] Areas around Shinagawa and Tamachi Stations Shinjuku Ward Shibuya Ward [Specified area] Shinjuku Station Area Shinagawa Ward [Specified area] Osaki Station Area Shibuya Ward [Specified area] Shibuya Station Area Toshima Ward [Specified area] Ikebukuro Station Area Tokyo/ Kanagawa Ota Ward Kawasaki City [Specified area] Haneda Airport South, Kawasaki Tonomachi, Daishi Kawara area (Former name: Kawasaki Tonomachi and Daishi Kawara area) Tokyo
  55. 4.5 Digital Twin area development Leading Areas Bases to be

    expanded horizontally (Classification is based on the master plan for the urban planning area.) A core location, a center of vitality and liveliness Core location A pivotal regional center, a center of life Core location, pivotal regional center, center of life NISHI SHINJUKU, Metropolitan Area BAY AREA MINAMI OSAWA ISLANDS Central Regional Hub Area New Urban Life Creation Area Tama Regional Hub Area Natural Environment Symbiosis Area Expanding initiatives across Tokyo through interaction and collaborations among locations and development of surrounding areas In the horizontal development of the project, the future vision of urban development is also taken into consideration, with a view to creating new value through the formation and development of hubs that utilize the individuality and potential of the region. ※ Assumed to be various hubs defined in the Master Plan for Urban Planning Areas, Urban Revitalization Emergency Development Districts, Urban Development System Hub Districts, etc. 58 Develop the project from the leading areas with an eye on the regional classification of the "Grand Design for Urban Development".
  56. 5.1 Role and cost-sharing approach Sharing roles and costs to

    ensure that the Digital Twin can function as a social infrastructure in the future. 60 Tokyo Metropolitan Government Outside the government Initial and maintenance costs are borne by the entity that maintains and operates each element. Collaboration in the initial development and updating of data and infrastructure that would be difficult for Tokyo Metropolitan Government alone. Initial development and operation of data, systems, and infrastructure, particularly in the public sector Role of maintenance and operation Cost sharing
  57. 5.2 Division of roles in the development of Digital Twin

    Data, systems, and infrastructure are shared within and outside the government office. 61 Security Tokyo Metropolitan Government Outside the government Sensors, cameras, etc. for data acquisition in the Agency Sensing devices used by each entity Simulator for each bureau, etc. ー Various data, reports, etc. managed by Tokyo Metropolitan Government office Sensing data, movement data, etc. acquired by each entity Sensing data, etc. acquired from various infrastructures managed by the TMG Disadvantaged Area Network (Development Support), Public Wi-Fi, etc. Public maintenance of 5G / LTE Wi-Fi to be maintained by each entity Internal Viewer / External Viewer ー Internal Data API API for data acquired by each entity Internal data store ー ー 3D digital maps, various GIS data, etc. Detailed and incidental geospatial information Analytical data, etc. maintained by each entity Infrastruct ure Data System Dynamic data Static data Geospatial data Viewer Network Sensing device Interface Elements Database Strategy, rules and systems, organization, and operational model Various regulations, guidelines, and standard specifications Shared by each developer and operator Data Simulator Applicati on
  58. 5.3 Division of roles in the operation of Digital Twin

    According to the policy established by the operator, roles for the operation of the Digital Twin will be assigned. 62 Operator data collection Private companies ①Data delivery according to specifications Internal Sensors DT platform External Platform Users Internal Platform Users ③Data Download Platform operations ・ Consider standard specification ・ Organize quality standards Data Providers ⑤ Feedback to data, platform, etc. Service users ④ Private service provision ④Administrative service provision Advisors and Evaluators Advice and evaluation to the Digital Twin Internal Data Store/ Data Catalog ② Upload data data collection Sensors Data Providers ⑥ Feedback on data External
  59. 5.3 Division of roles in the operation of Digital Twin

    63 Data ecosystems are built by linking data among various entities. ① Data Maintenance ② Data Storage ④ Data Use ③Data Confirmation / Visualization ⚫ The user downloads the data in accordance with the license and terms of use established by the data provider. ⚫ Data cleansing and other processing as needed ⚫ Provide feedback to data, platform, etc. ④ Data Use ⚫ Maintain data according to specifications and quality standards set by the operator ⚫ Establish licenses and terms of use for data usage in accordance with the policy set by the operator ① Data Maintenance ⚫ Provide data to the digital twin platform according to the rules set by the infrastructure operator ② Data Storage ⚫ Confirm and provide feedback on the metadata format, etc. of the provided data ⚫ Visualize data on a viewer ③ Data Confirmation / Visualization Internal users/ External users Data Ecosystem Operator Data Provider
  60. 6.1 Approach to Estimating Cost Costs are estimated based on

    a combination of details and scope of development in each fields. 65 Scope of development (region, timing) Data System Infrastr ucture Details of develop ment Calculated based on details of development × scope of development (region and timing) Organize development details and scope of development in each area Use case etc. Disaster prevention Town planning Mobility Education Working Style Industry Energy Nature Wellness
  61. Cost items are estimated for each element regarding the point

    in time when costs are incurred. 6.1 Approach to Estimating Cost Base Element Classification Example Cost items (acquisition items) At the time of cost incurred Initial Maintenance and management Data Data Dynamic data: sensing data, movement data, etc. Dynamic Data Acquisition 〇 〇 Dynamic Data Processing 〇 〇 Static data: statistical data, document data, etc. Geospatial data: map data, GIS data, etc. Initial data creation/purchase 〇 - Data processing and conversion 〇 〇 Procurement of difference data - ◦ Reflecting and updating differential data - 〇 System Applications Simulators Internal / External Viewer System development and implementation 〇 - System maintenance - 〇 Database Databases System development and implementation 〇 - System maintenance - 〇 Interfaces Common API / individual APIs System development and implementation 〇 - System Operation - 〇 Infrastr ucture Sensing devices Sensors, cameras, etc. Equipment Installation 〇 - Operation and maintenance of equipment - 〇 Network LTE/5G, Wi-Fi, etc. Installation of network equipment 〇 - Operation and maintenance of network equipment - 〇 66 * This is an example of maintenance for the purpose of illustrating the cost-effectiveness estimation method and does not assume a specific use case. The items to be estimated vary depending on the field and use case.
  62. 6.1 Approach to Estimating Cost(Sample calculations) Initial cost ・Dynamic data

    maintenance: data acquisition costs + data processing and conversion costs ※ Assuming purchase (acquisition) of data ・Static data maintenance: data processing and conversion costs ※ Assuming conversion of existing data (Agency data) ・Map data: Initial data purchase cost + data processing/conversion cost ※Assuming purchase (acquisition) of data ・System development: System development and implementation costs ※ Assuming cost segmentation and refinement according to the level of detail of the system design Costs for use cases Initial cost (yen) + Maintenance and management cost* (yen/year) × years of operation (years) = Maintenance cost (yen) * When costs and benefits are recorded as a monetary value at the time of development, it is necessary to convert the costs to a present value (discounted future costs and effects using the social discount rate). Maintenance and management costs ・Dynamic data maintenance: data acquisition costs + data processing and conversion costs ※ Assuming purchase (acquisition) of data ・Static data maintenance: data processing and conversion costs ※ Assuming conversion of existing data (Agency data) ・Map data: differential data purchase cost + data processing/conversion cost ※ Assuming purchase (acquisition) of data ・System development: System maintenance costs ※ Assuming cost segmentation and refinement according to the level of detail of the system design Cost items are estimated for each element regarding the point in time when costs are incurred.
  63. 6.2 Approach to Estimating Effectiveness 68 A framework for estimating

    the effects of the Digital Twin was prepared, and the development effects were estimated for use cases in each field. Major items Concept of effect estimation and general method Environ ment Impact on environment, use of resources (example : Multiply environmental impact by intensity) Society Impact on civic life and communities (example : Alternative methods, virtual market methods) Living Impact on safety and security, impact on employment (example: Multiply impact coverage by the amount of disaster losses and insurance premiums) Produc- tion Impact on manufacturing and production (example: Change the amount of manufacturing / production by a certain percentage) Assets Impact on operating costs and earnings of assets (stock) (example: change operating expenses and revenues by a certain percentage) Effects of the development of Tokyo Digital Twin (draft) Evaluation items for Value for Money of Digital Twin • Natural • Social • Human • Manufactured • Financial < Future Tokyo Strategy > ~ Purpose of Tokyo DT ~ Improvement of QOL of Residents and QOS of TMG Estimate the effect of development by applying the effects of the use cases to the major items Establish major items of development effectiveness based on the Tokyo Metropolitan Government's top policies and overseas case studies, etc. * The framework is presented in the document on promoting the digital twin,” Digital Twin Toolkit Developing the business case for your digital twin”, which the Centre for Digital Built Britain (CDBB, a UK government-funded collaboration with the University of Cambridge) has published in 2021. Use case etc. Disaster prevention Town planning Mobility Education Working style Industry Energy Nature Wellness
  64. 6.2 Approach to Estimating Effectiveness Effect items are categorized into

    items related to QOL and converted into monetary values. 69 Based on the digital twin services envisioned for each area, effect items are listed according to the maintenance details. Effect item Environment Impact on environment, use of resources (example : Multiply environmental impact by intensity) Society Impact on civic life and communities (example : Alternative methods, virtual market methods) Living Impact on safety and security, impact on employment (example: Multiply impact coverage by the amount of disaster losses and insurance premiums) Production Impact on manufacturing and production (example: Change the amount of manufacturing / production by a certain percentage) Assets Impact on operating costs and earnings of assets (stock) (example: change operating expenses and revenues by a certain percentage) Effect item … Effect item Classify effect items Classification of effect items (example of estimation method) Set classifications related to quality of life (QOL) of Tokyo residents * *The classification of effectiveness items is based on the "Digital Twin Toolkit", a document published in 2021 by the Centre for Digital Built Britain (CDBB: a UK government-funded collaboration with the University of Cambridge) to promote the digital twin. Based on the framework presented in "Digital Twin Toolkit Developing the business case for your digital twin," each category is designed to contribute to improving the quality of life of Tokyo Metropolitan Government residents.
  65. 6.2 Approach to Estimating Effectiveness In the UK, the Value

    for Money of the Digital Twin is organized into five categories: Natural, Social, Human, Manufactured, and Financial. Quantifying Value for Money is an important step in justifying an investment. After all, digital twins can be expensive assets that provide value for several years. The following five items provide a template for value. ⚫ Natural - Environmental impact, Resource use ⚫ Social - Impact on citizens and communities ⚫ Human - Effects on safety, security and work ⚫ Manufactured - Impact on manufacturing and productivity ⚫ Financial - Investment costs, Operating costs, Revenues 70 * The framework is presented in the document on promoting the digital twin,” Digital Twin Toolkit Developing the business case for your digital twin”, which the Centre for Digital Built Britain (CDBB, a UK government-funded collaboration with the University of Cambridge) has published in 2021.
  66. The estimation method is organized by categorizing the effect items

    by the target of the effect, focusing on the indicators to which the effect is attributed. 6.2 Approach to Estimating Effectiveness(Sample calculations) Category Subject Item Effect items (indicators attributed to effectiveness) Additional effects in the event of a major disaster* Accelerate disaster recovery projects, etc. Life (safety and security) Improved efficiency of on-site situation surveys and detailed investigations at the time of a disaster Life (safety and security) Early resumption of economic activities through rapid restoration Constant effects Improve efficiency of infrastructure maintenance and management Trial calculation (Long-term cost reduction) Reduced inspection costs for each facility Improve efficiency of urban planning and evacuation planning Production (productivity improvement) Improved efficiency of various planning processes by utilizing the results of disaster impact area forecasts * The effects that occur in the event of a disaster are organized separately from the constant effects. ** This table is organized using one use case in the field of disaster prevention as an example. The items vary depending on the field or use case to be estimated. 71
  67. Effect 1: Accelerate disaster recovery projects, etc. Efficiency of on-site

    situation investigation: Time required for investigation × Percentage of efficiency improvement × Percentage of maintenance target × Man-hours of staff involved in response (time value) Early resumption of economic activities through rapid restoration: Production value of the affected area × Reduction rate of the amount of damage × Percentage of the area to be improved Efficiency of on-site situation investigation + Early resumption of economic activities through rapid restoration = Effects of Acceleration of disaster recovery projects, etc. (yen) Effect 2: Improve efficiency of infrastructure maintenance and management Time required to respond × Percentage of efficiency improvement × Percentage of maintenance targets × Man-hours of staff involved in response (time value) = Effects of more efficient infrastructure maintenance and management (yen/year) Effectiveness of Use Case Development Effects of acceleration of disaster recovery projects, etc. = Effects in the events of major disasters (yen) Effects of more efficient infrastructure maintenance and management (yen/year) + Effects of more efficient urban planning and evacuation planning (yen/year) = Constant effects (yen/year) * The information is based on an example use case in the field of disaster prevention for the purpose of explaining the method of estimating cost-effectiveness. The contents may differ from those of actual use cases to be considered and implemented. Effect 3: Improve efficiency of urban planning and evacuation planning Time required for planning × Percentage of efficiency improvement × Percentage of development targets × Man-hours of staff required for planning (time value) = Effectiveness of more efficient urban planning and evacuation planning (yen/year) 72 The development effect is calculated by adding up the results of the estimates for each effect item. 6.2 Approach to Estimating Effectiveness(Sample calculations)
  68. Cost-effectiveness is expressed in terms of time series and period

    totals. 6.3. Example of cost-effectiveness expressions ・・・・ Total constant effects XX Billion yen FY2022 • Billion yen (initial cost: ◦ billion yen + maintenance/manag ement: △ billion yen) cost effect Effect - Cost Differential Approx. XX Billion yen FY20XX Billion yen Additional XX billion yen in the event of a major disaster Additional XX billion yen in the event of a major disaster cost effect FY 2022 2023 2024 20XX ・・・・・ ・・・・・ Image of time series Cost-effectiveness * Image of total Cost- effectiveness 73 * The effects of a major disaster are not expressed as a time series, but rather as additional effects that may occur during the total period of the disaster, since the occurrence and the time of occurrence are uncertain.