Upgrade to Pro — share decks privately, control downloads, hide ads and more …

Predictive Analytics

Predictive Analytics

Presentation given at USI 2014, Paris. Contrasts Big Data vs Analytics and explore how the two interact.

Video of the talk in French: https://www.youtube.com/watch?v=R8QLyBXlEYg

Olivier Grisel

June 16, 2014
Tweet

More Decks by Olivier Grisel

Other Decks in Technology

Transcript

  1. Triumph of the Nerds: Nate Silver Wins in 50 States

    http://mashable.com/2012/11/07/nate-silver-wins/
  2. Triumph of the Nerds: Nate Silver Wins in 50 States

    http://mashable.com/2012/11/07/nate-silver-wins/
  3. Goals of this talk • What Big Data actually is

    or isn’t • Introduce predictive analytics concepts & tools • Study the impact of data size on analytics
  4. – Wikipedia “Big data is a blanket term for any

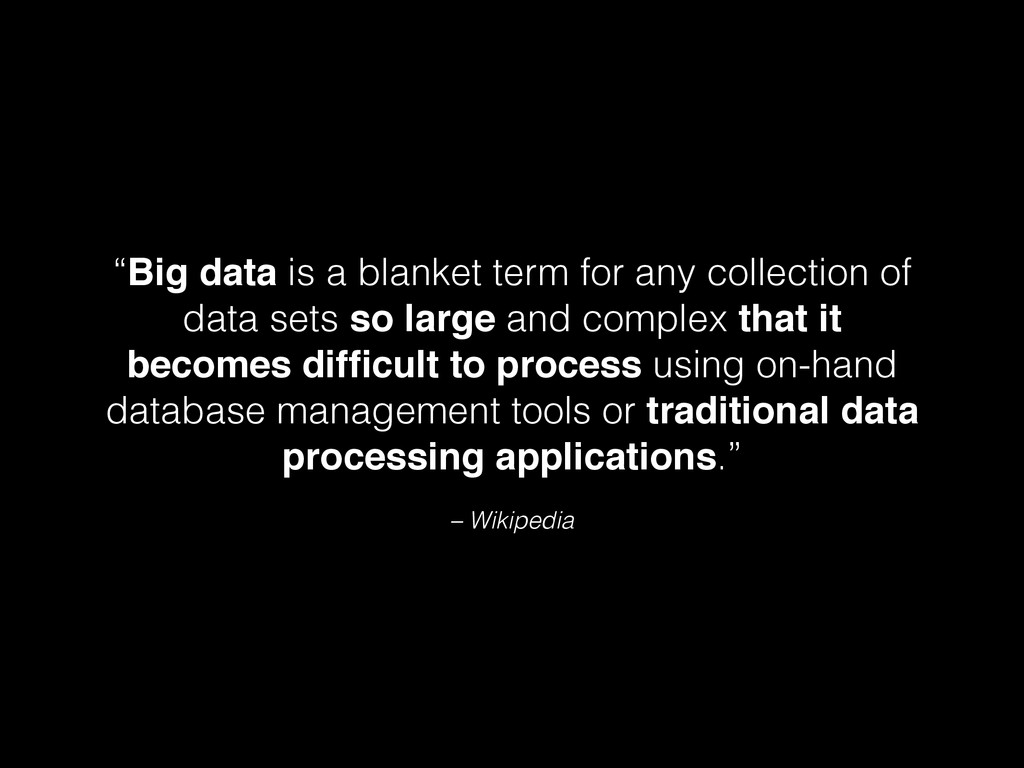
    collection of data sets so large and complex that it becomes difficult to process using on-hand database management tools or traditional data processing applications.”
  5. Not Big Data • Data that fits on a spreadsheet

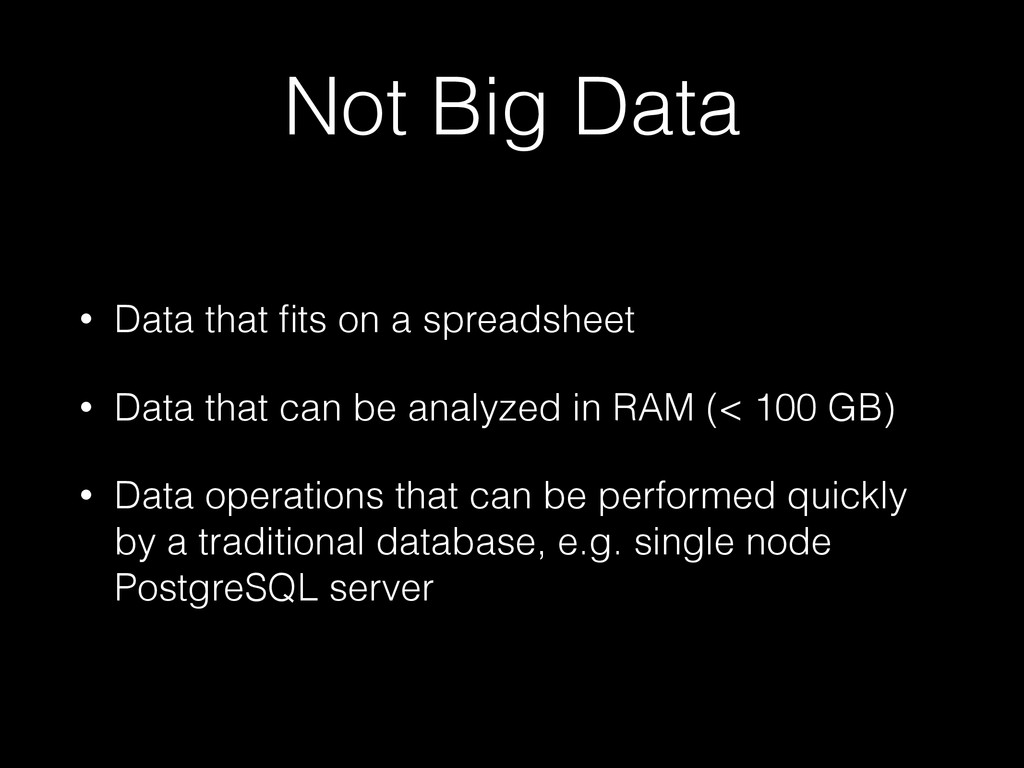
    • Data that can be analyzed in RAM (< 100 GB) • Data operations that can be performed quickly by a traditional database, e.g. single node PostgreSQL server
  6. Canonical Big Data problem: indexing the Web • Inverted index

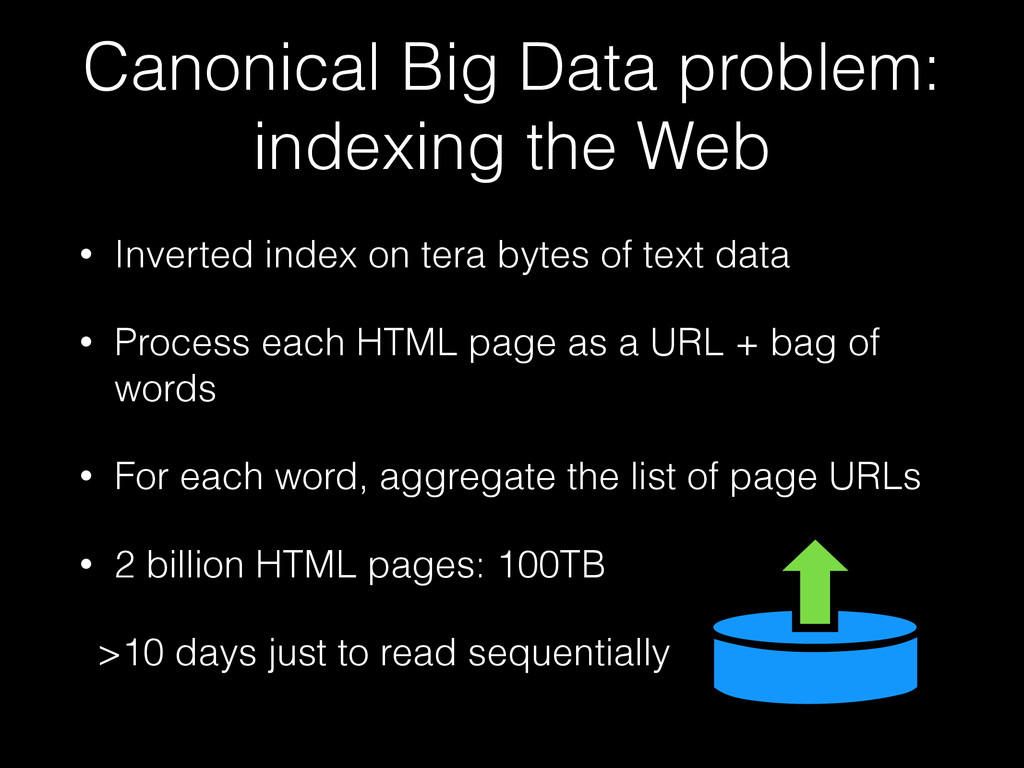
    on tera bytes of text data • Process each HTML page as a URL + bag of words • For each word, aggregate the list of page URLs • 2 billion HTML pages: 100TB >10 days just to read sequentially
  7. Non-traditional architectures • Hadoop: HDFS / MapReduce, Pig, Hive •

    Sharded, replicated NoSQL: BigTable, DynamoDB, Cassandra, HBase, ElasticSearch • Distributed event stream processing Kafka, Storm • Next gen cluster processing / distributed analytical DB YARN / Tez, Spark, Impala, PrestoDB, Redshift…
  8. Other Big Data examples • GSM location event log from

    telco • Transaction log of a big retail network • Raw traffic data on a large website or app • Intra-day tick data from a stock exchange
  9. Not Big Data • Polls data (~10K data points) •

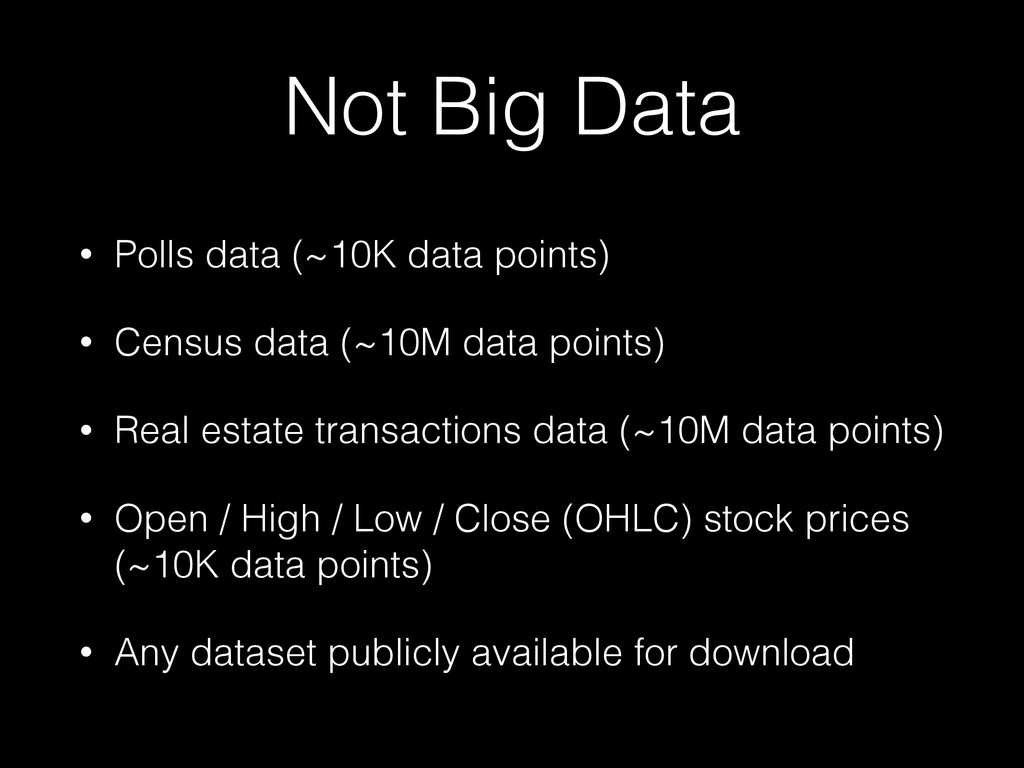
    Census data (~10M data points) • Real estate transactions data (~10M data points) • Open / High / Low / Close (OHLC) stock prices
 (~10K data points) • Any dataset publicly available for download
  10. • Make predictions of outcome on new data • Alternative

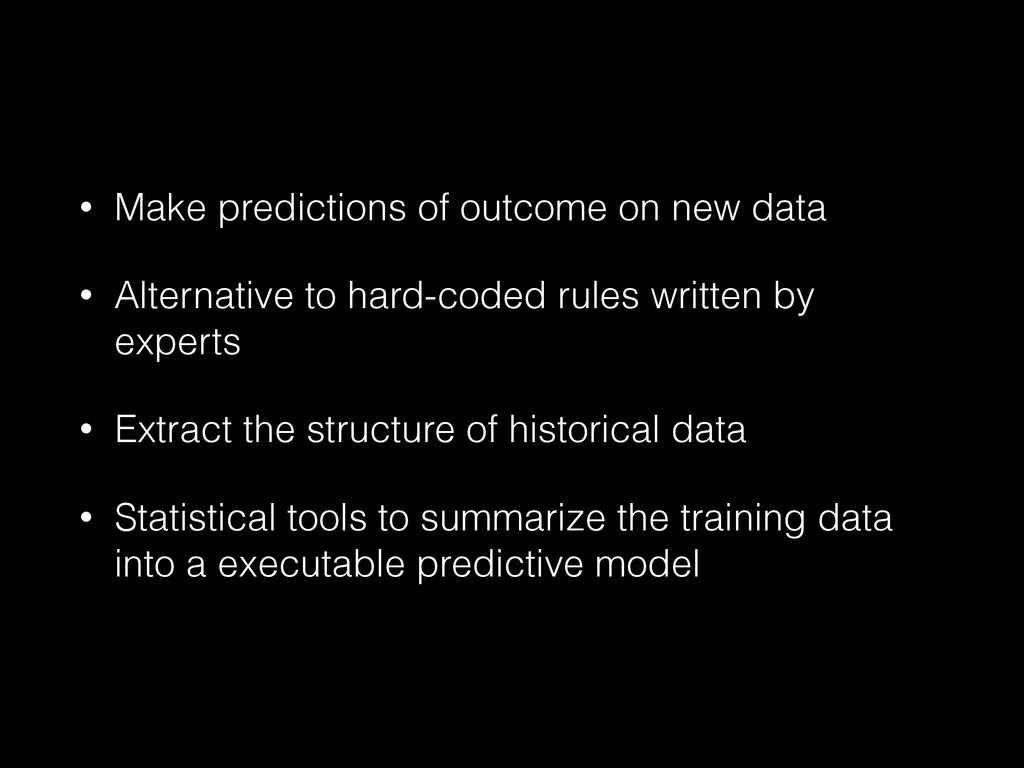
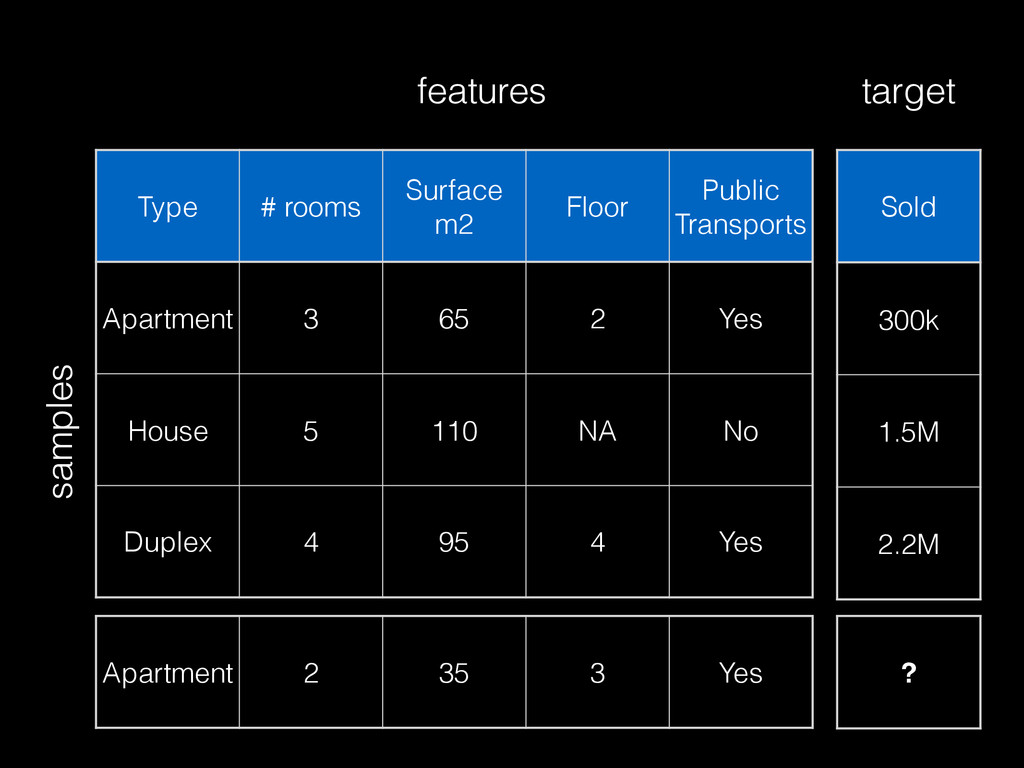
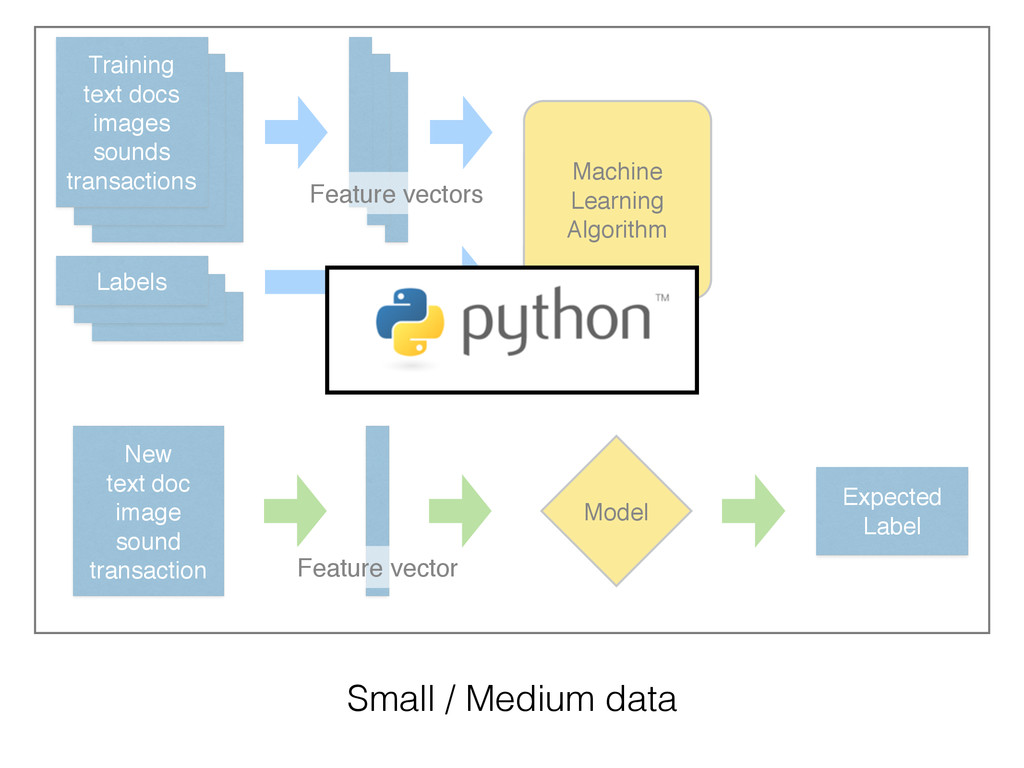
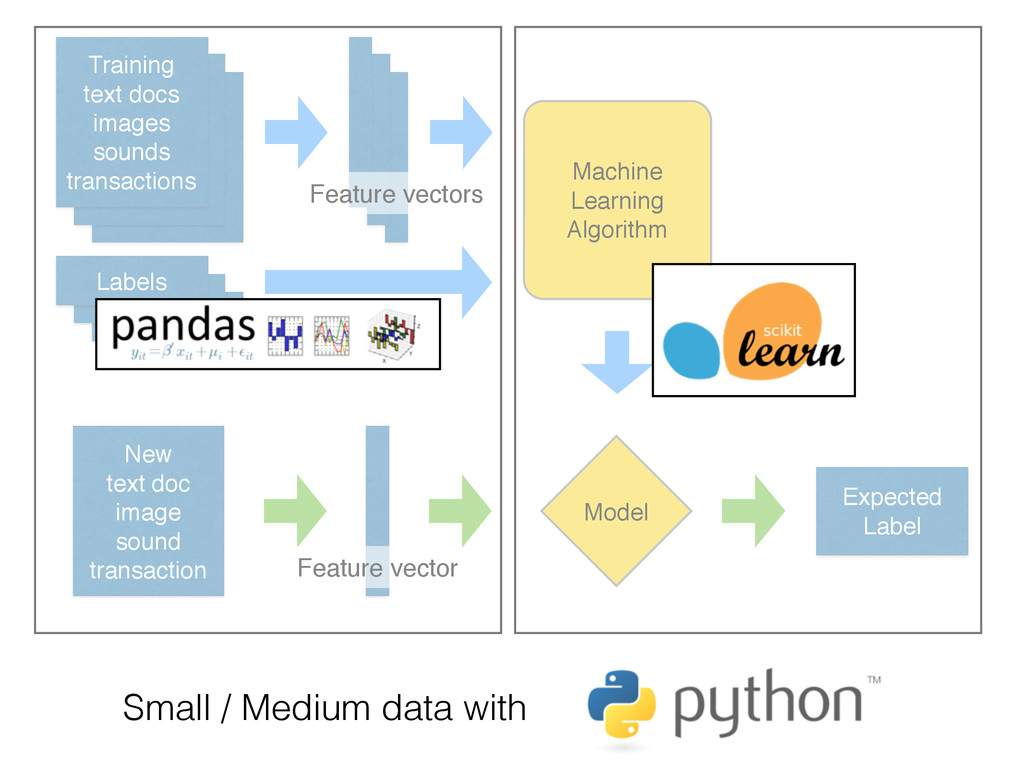
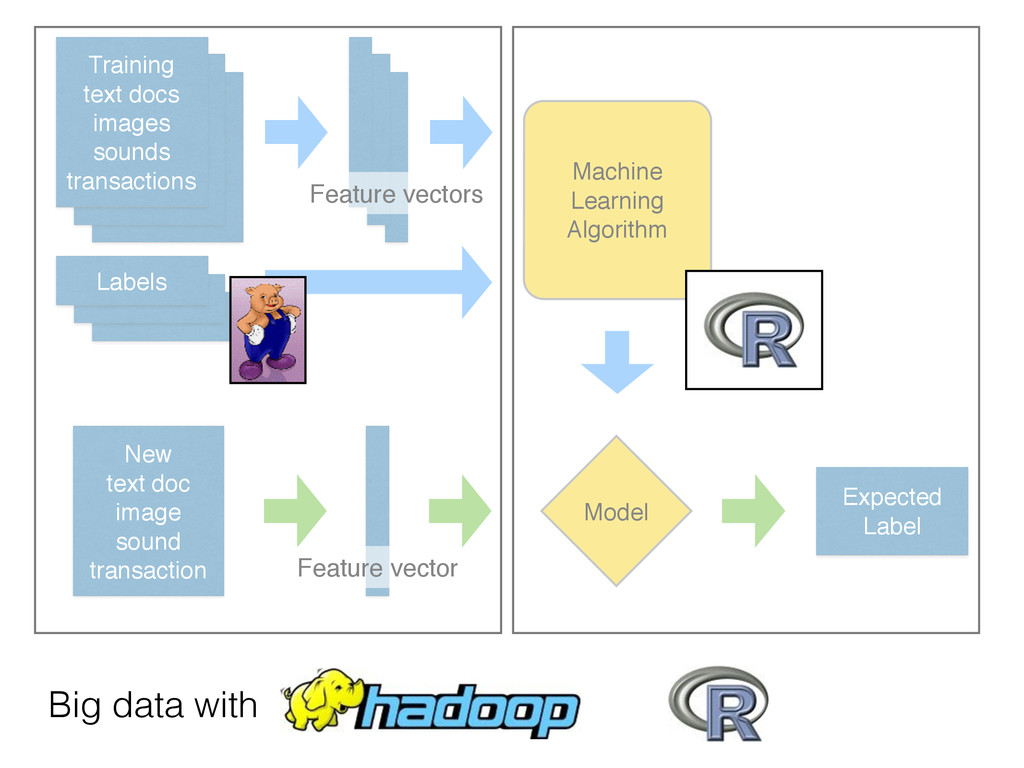
    to hard-coded rules written by experts • Extract the structure of historical data • Statistical tools to summarize the training data into a executable predictive model
  11. Type # rooms Surface m2 Floor Public Transports Apartment 3

    65 2 Yes House 5 110 NA No Duplex 4 95 4 Yes
  12. Type # rooms Surface m2 Floor Public Transports Apartment 3

    65 2 Yes House 5 110 NA No Duplex 4 95 4 Yes features samples
  13. Type # rooms Surface m2 Floor Public Transports Apartment 3

    65 2 Yes House 5 110 NA No Duplex 4 95 4 Yes features samples Sold 300k 1.5M 2.2M target
  14. Type # rooms Surface m2 Floor Public Transports Apartment 3

    65 2 Yes House 5 110 NA No Duplex 4 95 4 Yes features samples Sold 300k 1.5M 2.2M target Apartment 2 35 3 Yes
  15. Type # rooms Surface m2 Floor Public Transports Apartment 3

    65 2 Yes House 5 110 NA No Duplex 4 95 4 Yes features samples Sold 300k 1.5M 2.2M target Apartment 2 35 3 Yes ?
  16. Applications in Business • Forecast sales, customer churn, traffic, prices

    • Predict CTR and optimal bid price for online ads • Build computer vision systems for robots in the industry and agriculture • Detect network anomalies, fraud and spams • Recommend products, movies, music
  17. Applications in Science • Decode the activity of the brain

    recorded via fMRI / EEG / MEG • Decode gene expression data to model regulatory networks • Predict the distance of each star in the sky • Identify the Higgs boson in proton-proton collisions
  18. New! text doc! image! sound! transaction Model Expected! Label Predictive

    Modeling Data Flow Feature vector Training! text docs! images! sounds! transactions Labels Machine! Learning! Algorithm Feature vectors
  19. New! text doc! image! sound! transaction Model Expected! Label Small

    data Training! text docs! images! sounds! transactions Labels Machine! Learning! Algorithm Feature vectors Feature vector
  20. New! text doc! image! sound! transaction Model Expected! Label Small

    / Medium data Training! text docs! images! sounds! transactions Labels Machine! Learning! Algorithm Feature vectors Feature vector
  21. New! text doc! image! sound! transaction Model Expected! Label Small

    / Medium data with Training! text docs! images! sounds! transactions Labels Machine! Learning! Algorithm Feature vectors Feature vector
  22. New! text doc! image! sound! transaction Model Expected! Label Small

    / Medium data with Training! text docs! images! sounds! transactions Labels Machine! Learning! Algorithm Feature vectors Feature vector
  23. Model Expected! Label Big data with Machine! Learning! Algorithm New!

    text doc! image! sound! transaction Training! text docs! images! sounds! transactions Labels Feature vectors Feature vector
  24. Model Expected! Label Big data with Machine! Learning! Algorithm New!

    text doc! image! sound! transaction Training! text docs! images! sounds! transactions Labels Feature vectors Feature vector
  25. Model Expected! Label Big data with Machine! Learning! Algorithm New!

    text doc! image! sound! transaction Training! text docs! images! sounds! transactions Labels Feature vectors Feature vector
  26. From Big to Small • Feature extraction often shrinks data

    • Filter / Join / Group By / Count • Machine Learning performed on a small aggregate • Sampling for fast in-memory iterative modeling
  27. Back to the Regionator What if we did not have

    census data on daily mobility?
  28. Back to the Regionator • Use raw daily telco logs

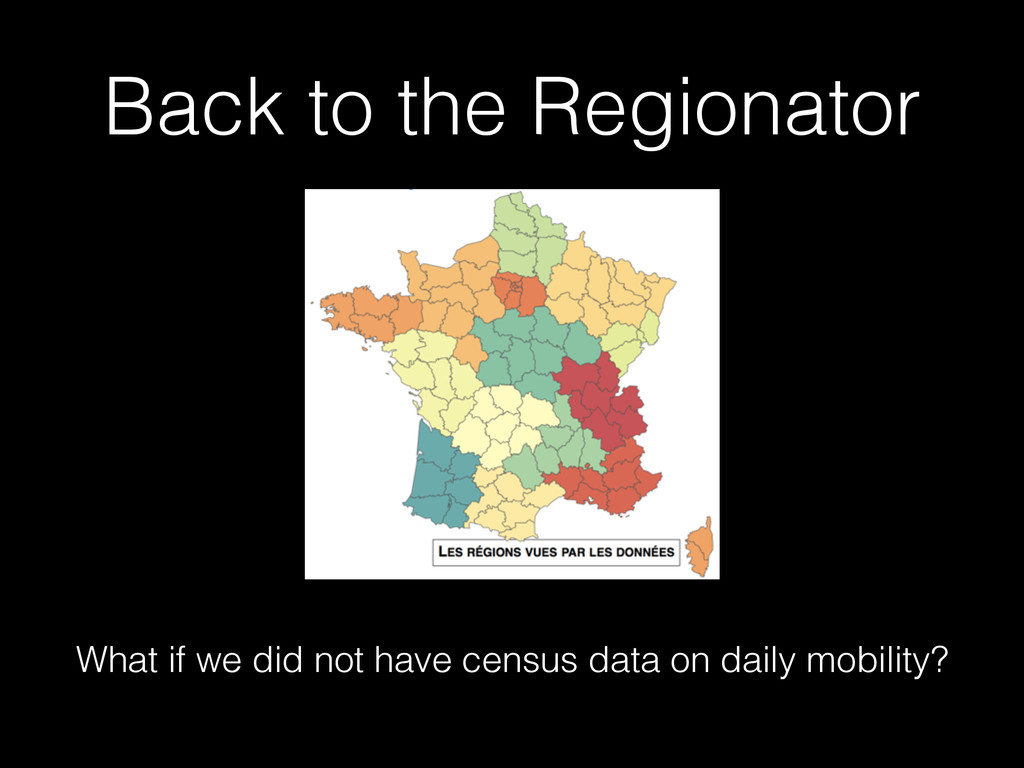
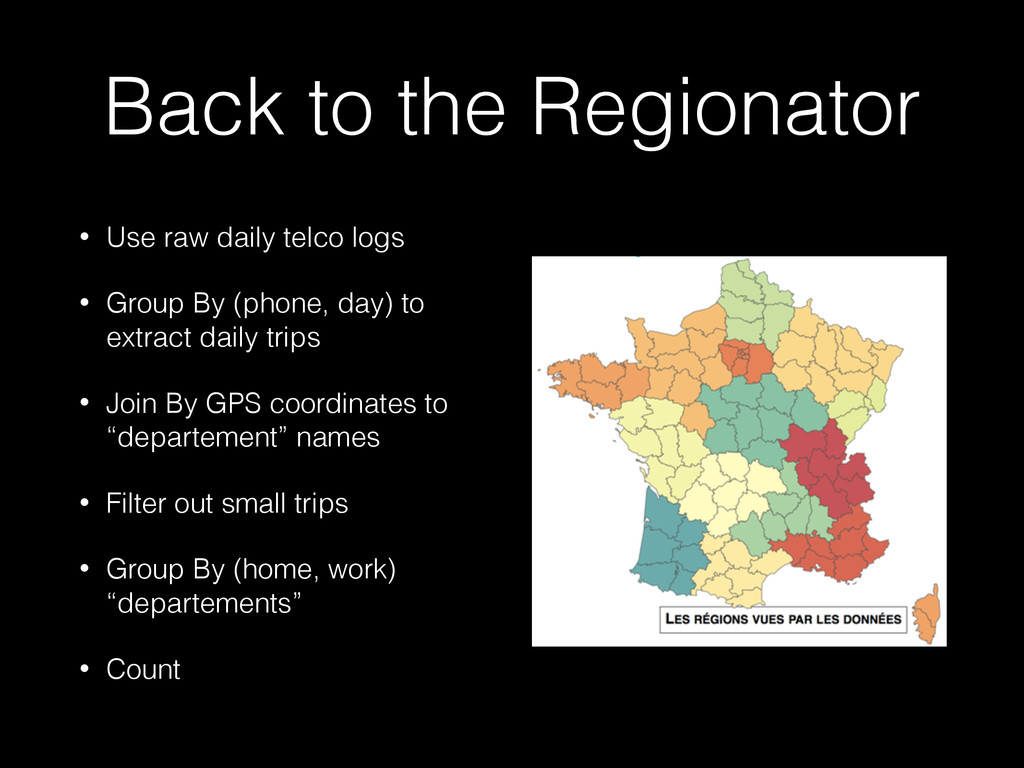
    • Group By (phone, day) to extract daily trips • Join By GPS coordinates to “departement” names • Filter out small trips • Group By (home, work) “departements” • Count
  29. Type # rooms Surface (m2) Floor Public Transp. Apart. 3

    65 2 Yes House 5 110 NA No Duplex 4 95 4 Yes features samples
  30. Type # rooms Surface (m2) Floor Public Transp. School (km)

    Flood plain Apart. 3 65 2 Yes 1.0 No House 5 110 NA No 25.0 Yes Duplex 4 95 4 Yes 0.5 No features samples
  31. • Big Data ≠ Predictive Analytics • Predictive models are

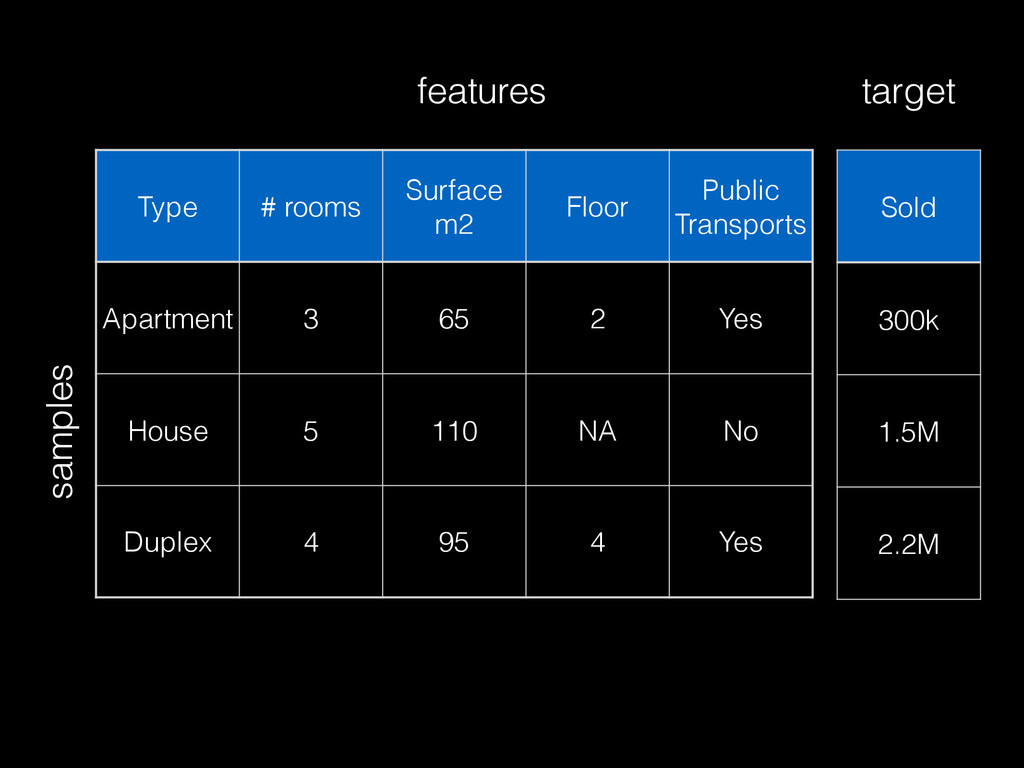
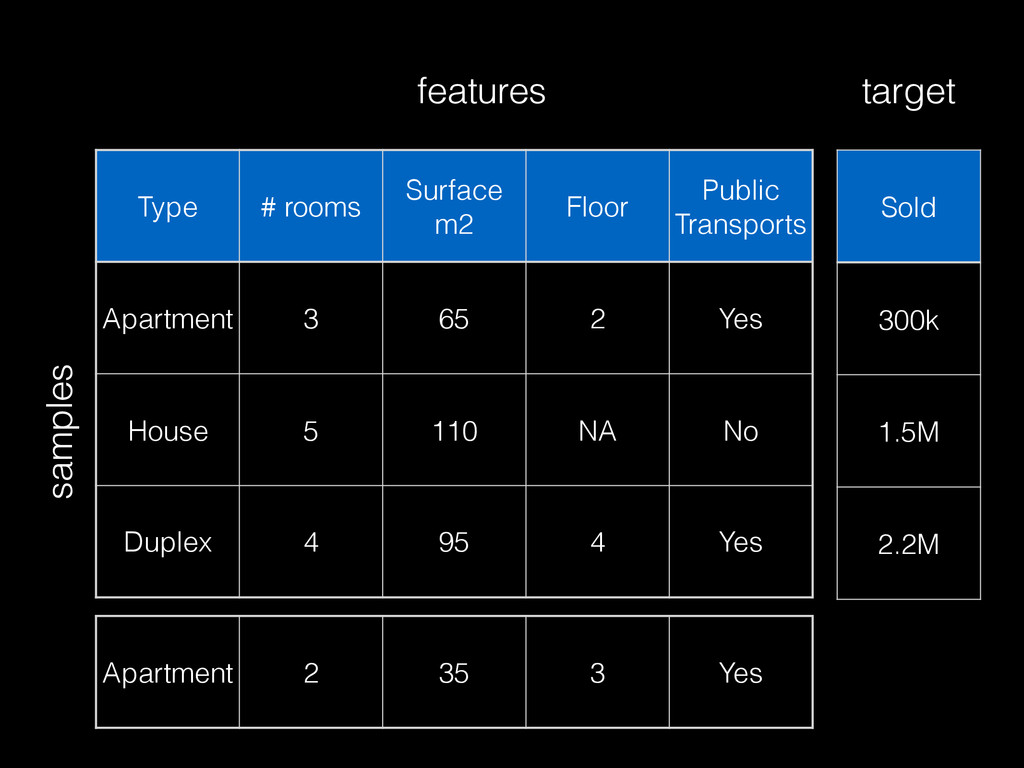
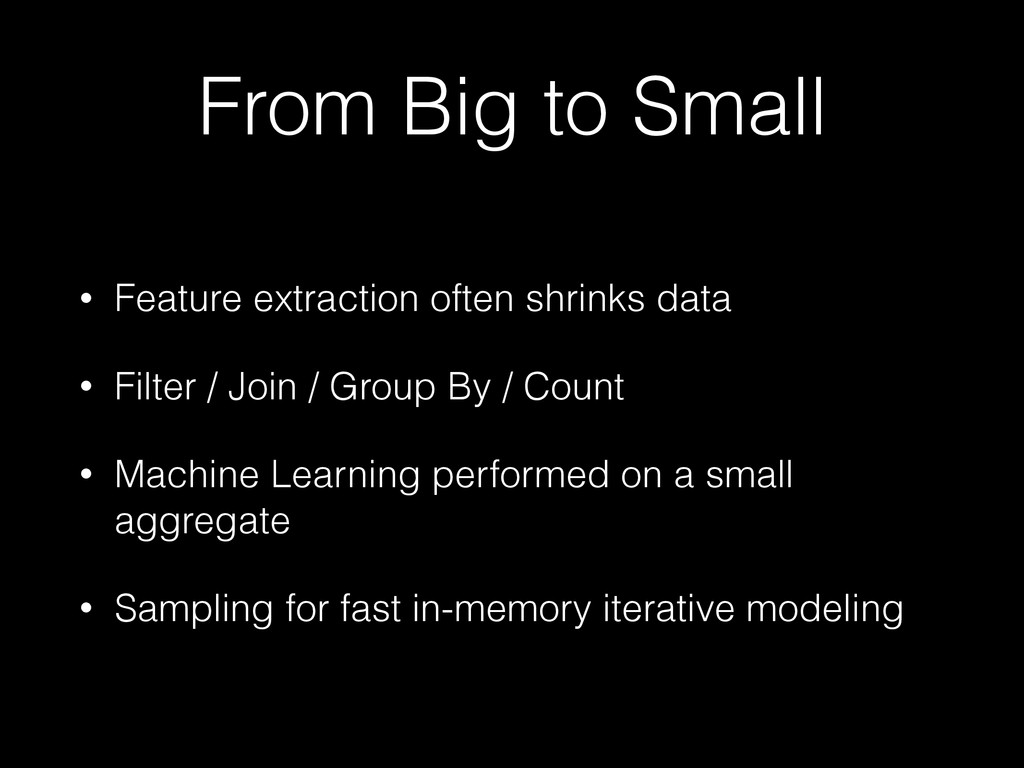
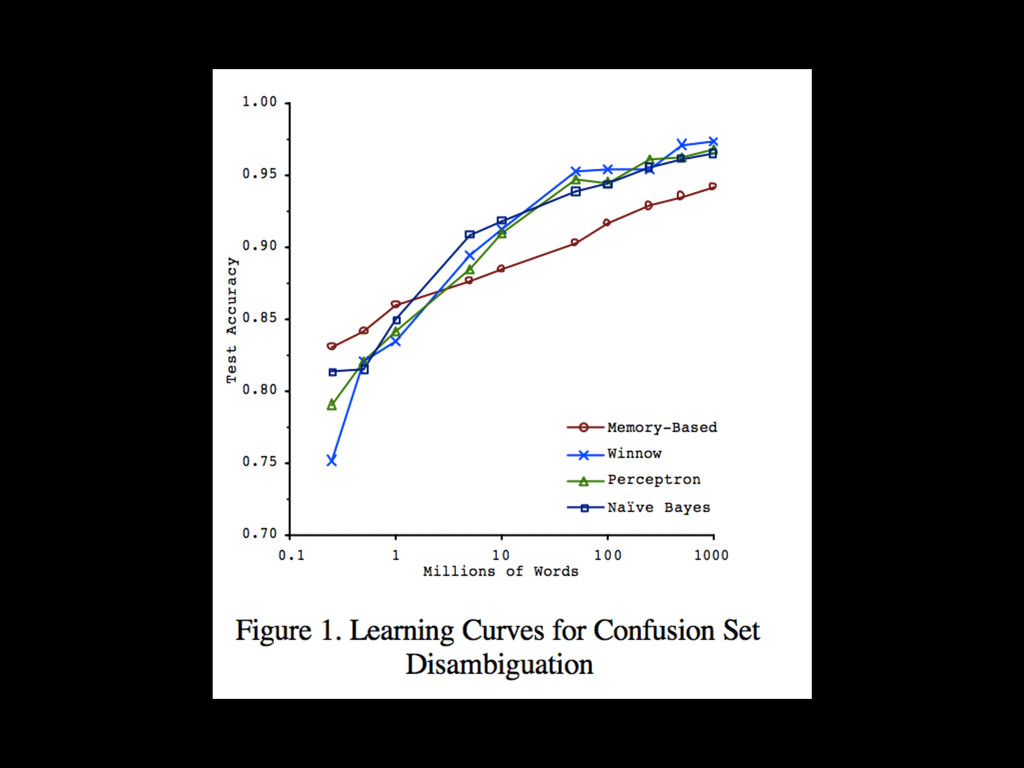
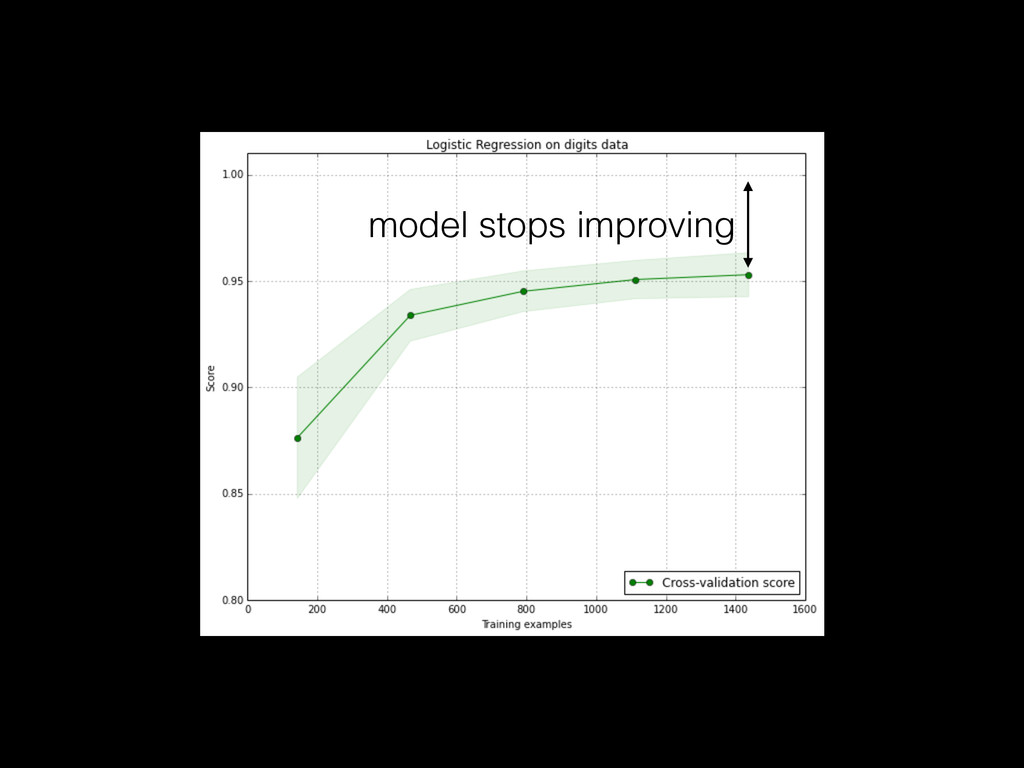
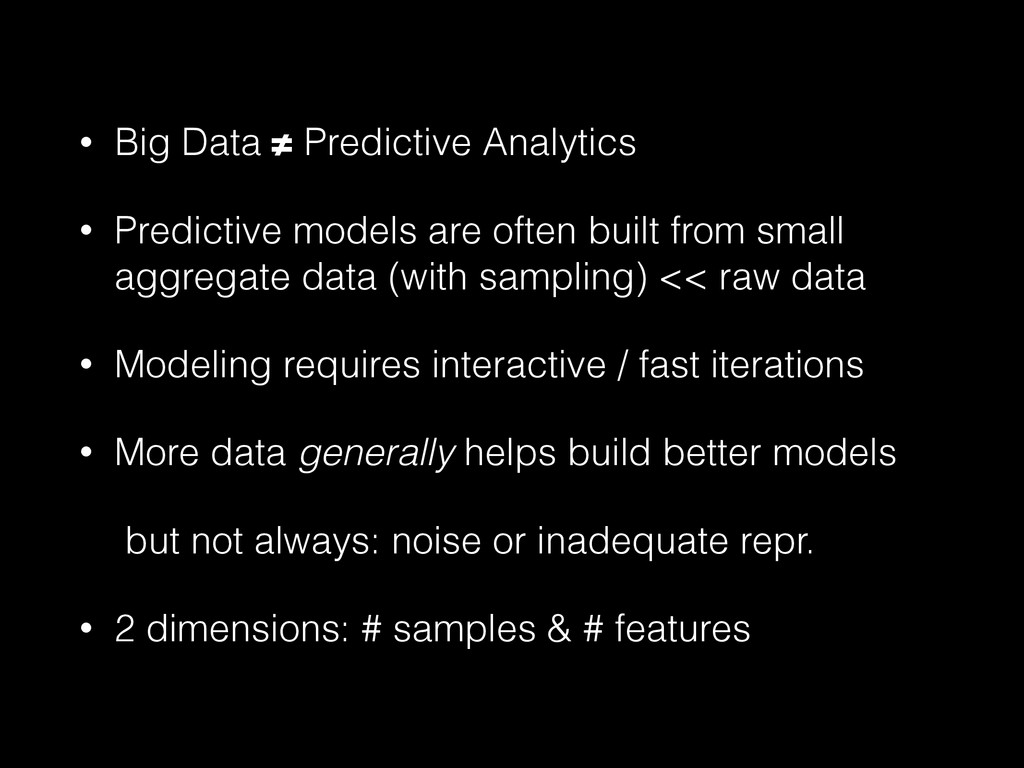
    often built from small aggregate data (with sampling) << raw data • Modeling requires interactive / fast iterations • More data generally helps build better models but not always: noise or inadequate repr. • 2 dimensions: # samples & # features
  32. • Parametric e.g. linear model (traditional stats) vs Non-parametric e.g.

    Random Forests, Neural Networks (Machine Learning) • Understand a model with 10% accuracy vs blindly trust a model with 90% accuracy • Simple models e.g. F = m a, F = - G (m1 + m2) / r^2 will not become false(r) because of big data • New problems can be tackled: computer vision, speech recognition, natural language understanding
  33. • the (experimental) scientific method introduced by Karl Popper is

    based on the falsifiability of formulated hypotheses • theory is correct as long as past predictions hold in new experiments • machine learning train-validation-test splits and cross-validation is similar in spirit • ml model is just a complex theory: correct as long as its predictions still hold