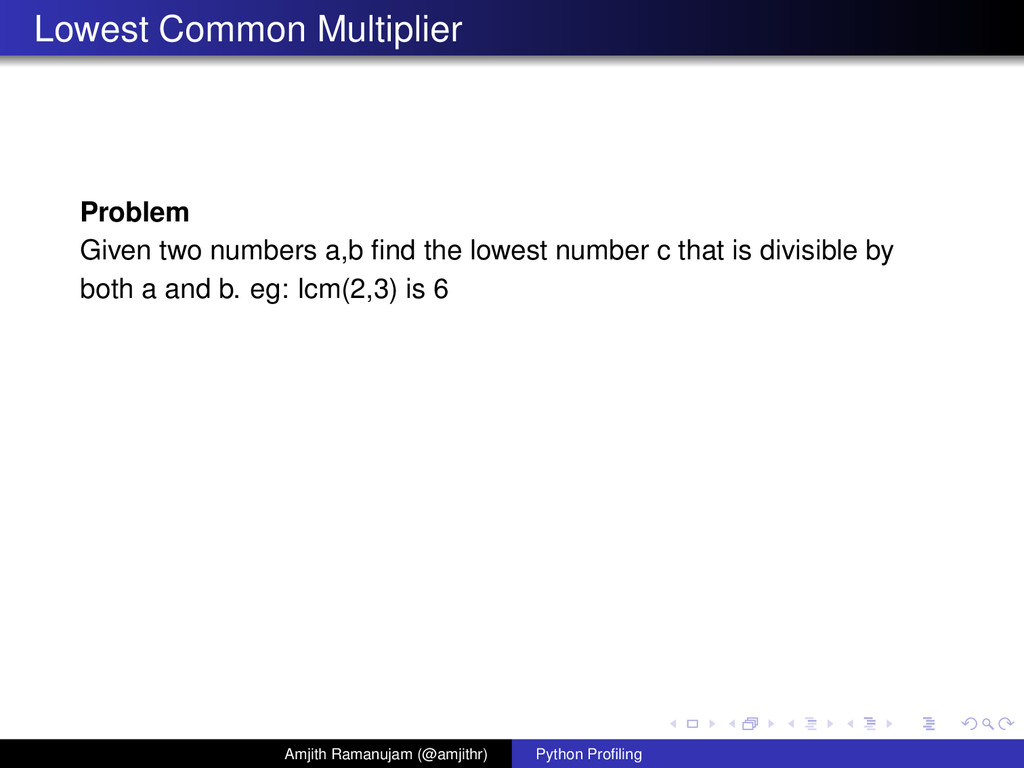
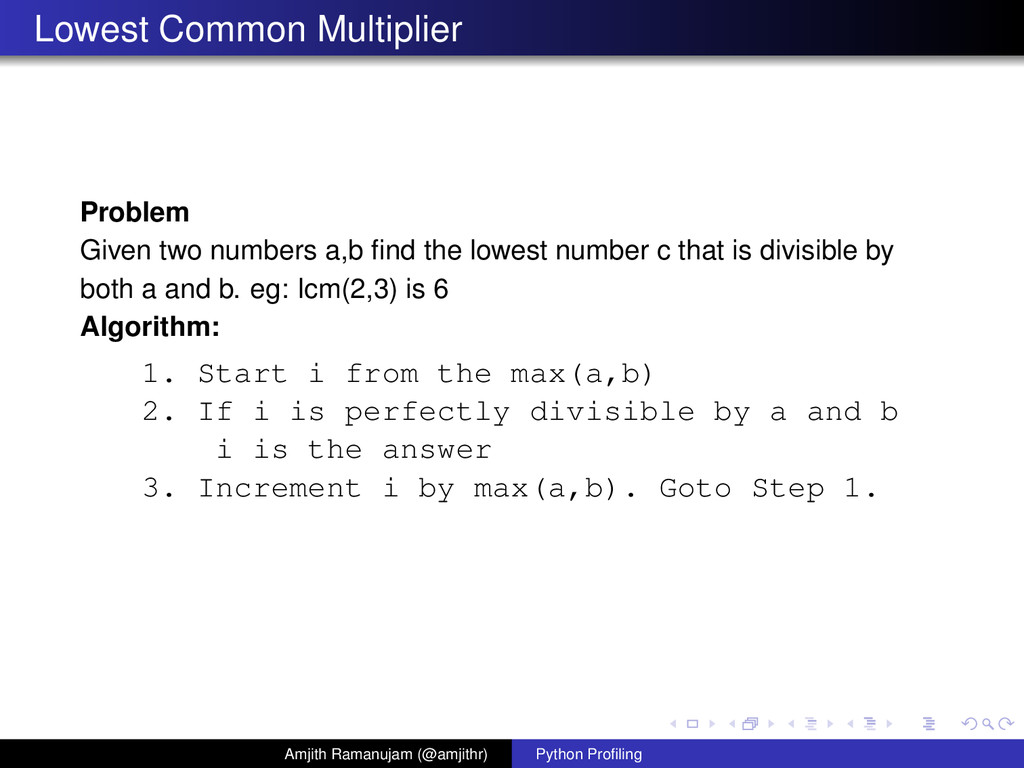
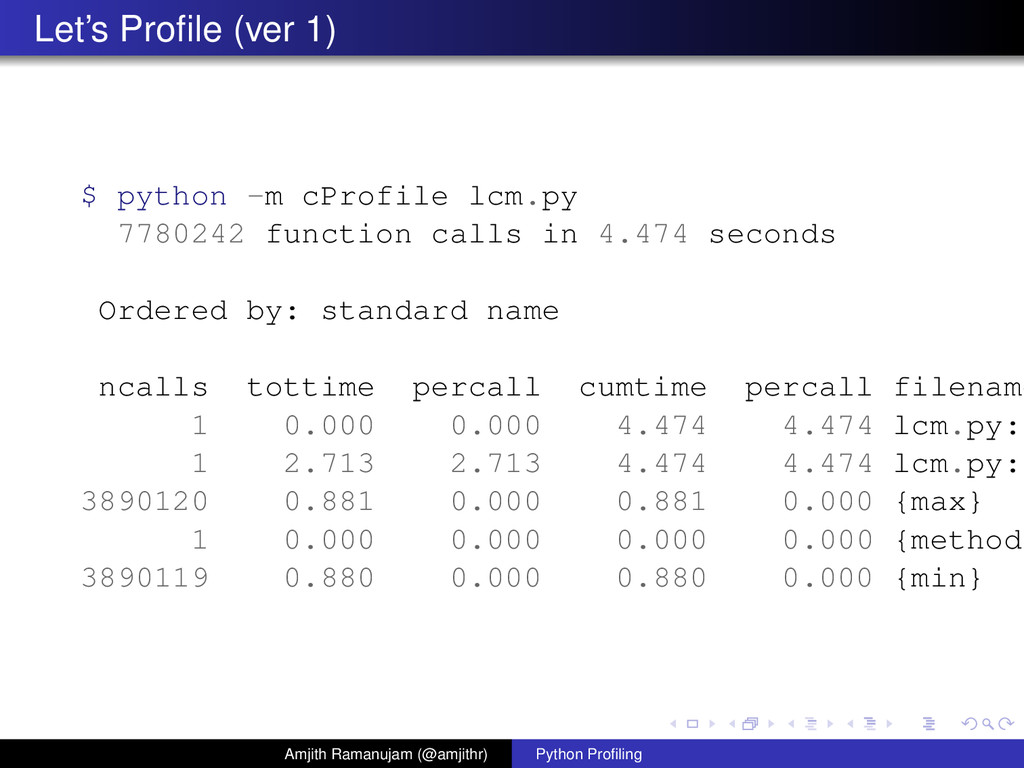
lowest number c that is divisible by both a and b. eg: lcm(2,3) is 6 Algorithm: 1. Start i from the max(a,b) 2. If i is perfectly divisible by a and b i is the answer 3. Increment i by max(a,b). Goto Step 1. Amjith Ramanujam (@amjithr) Python Profiling
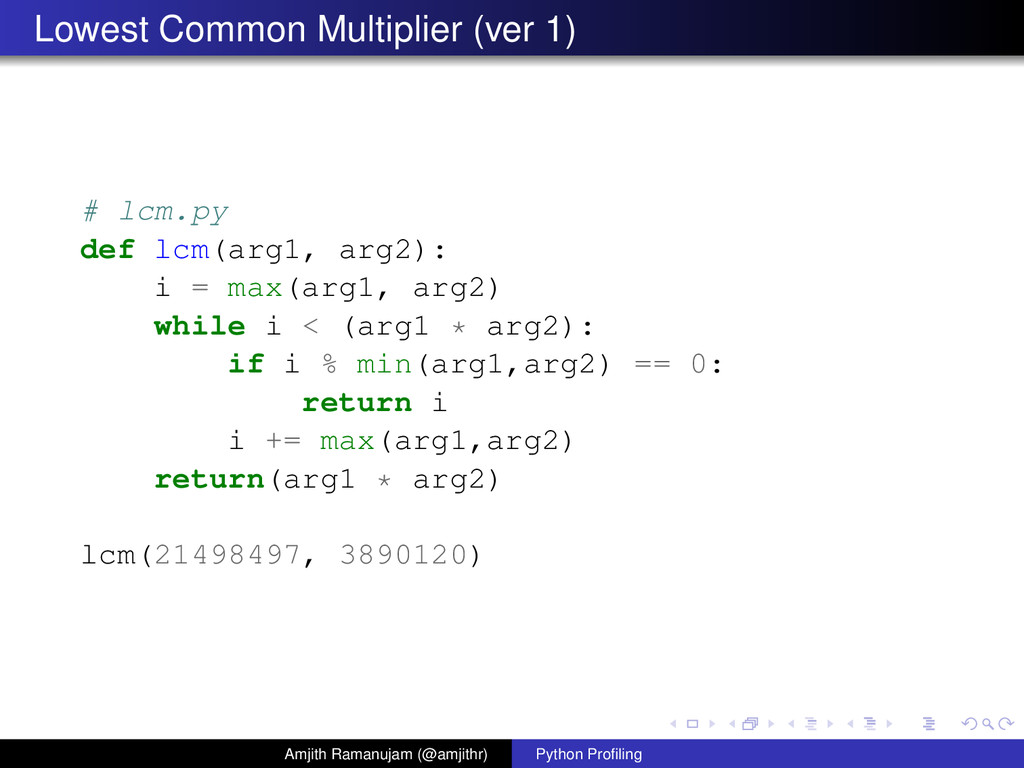
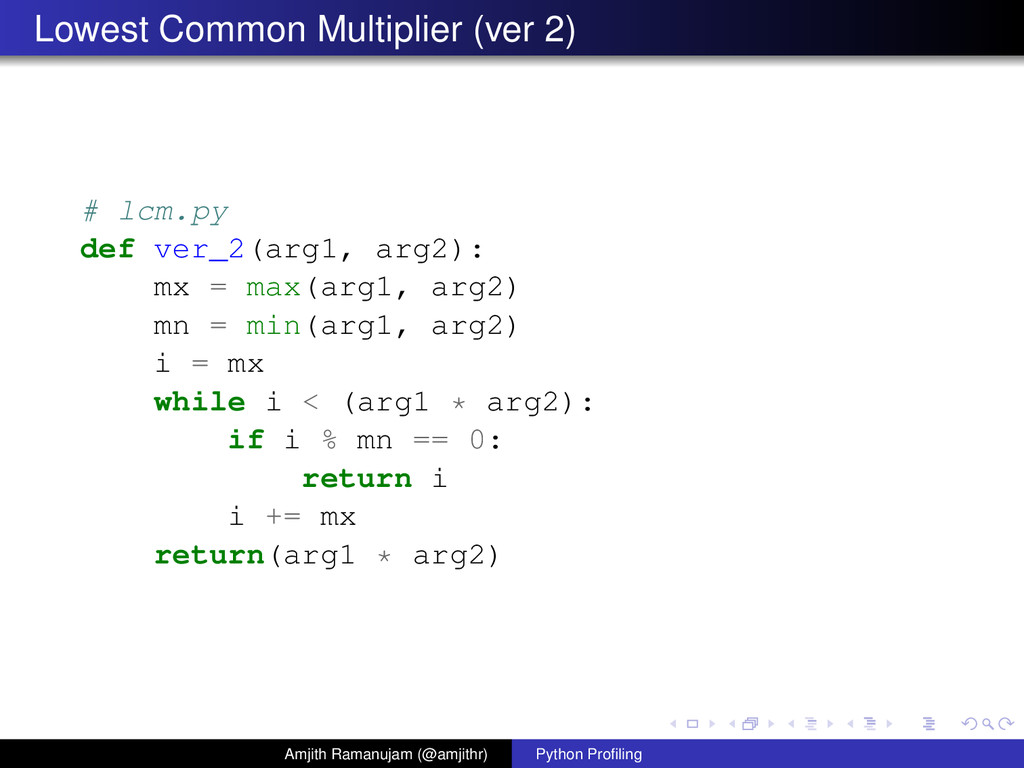
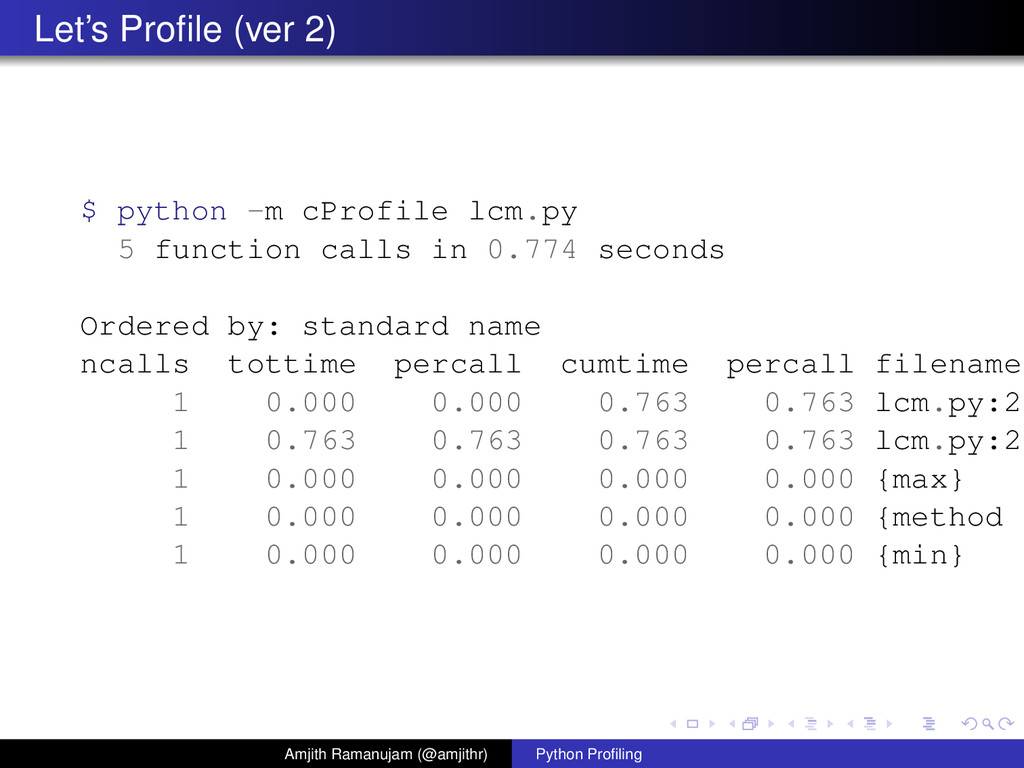
i = max(arg1, arg2) while i < (arg1 * arg2): if i % min(arg1,arg2) == 0: return i i += max(arg1,arg2) return(arg1 * arg2) lcm(21498497, 3890120) Amjith Ramanujam (@amjithr) Python Profiling
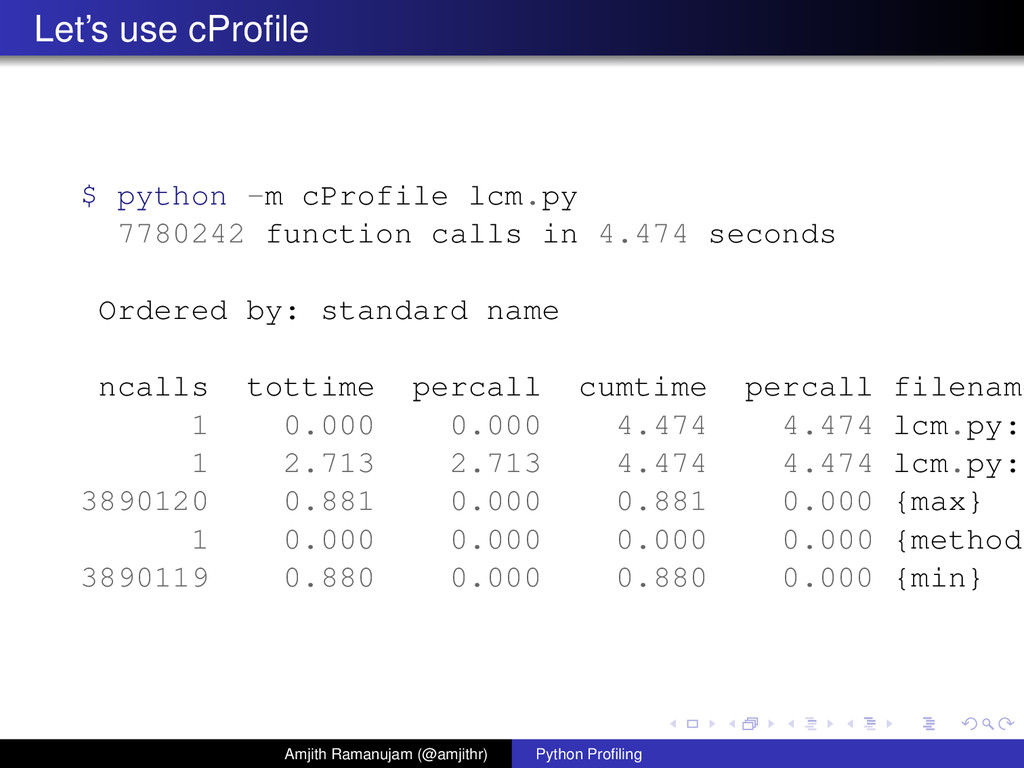
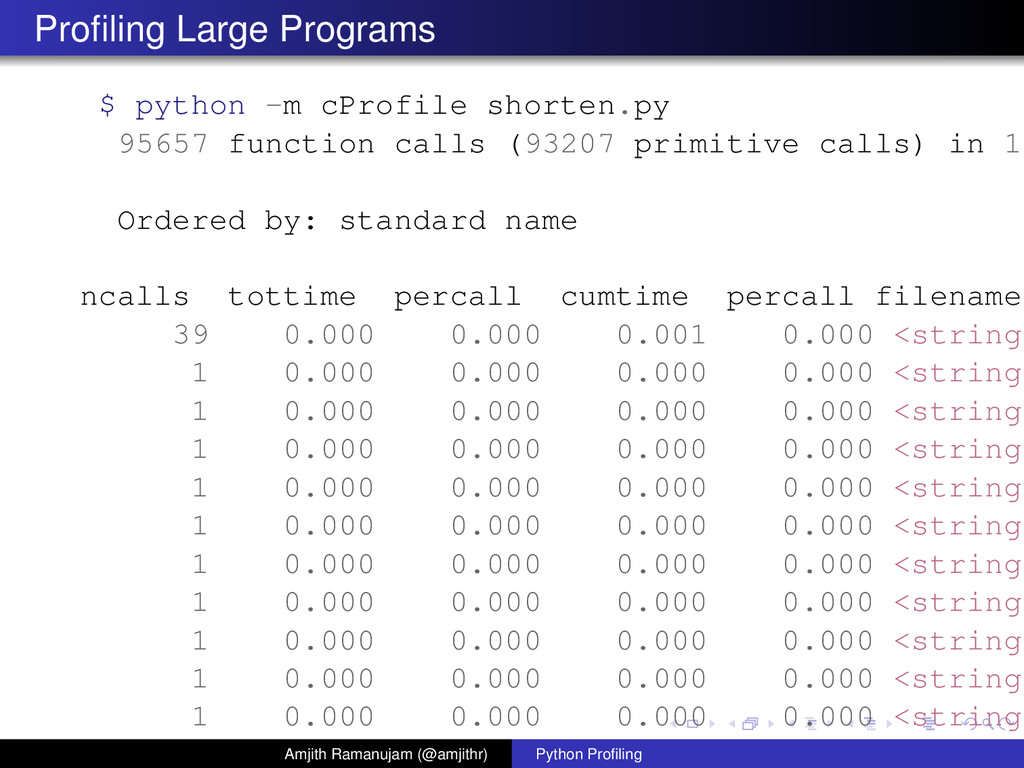
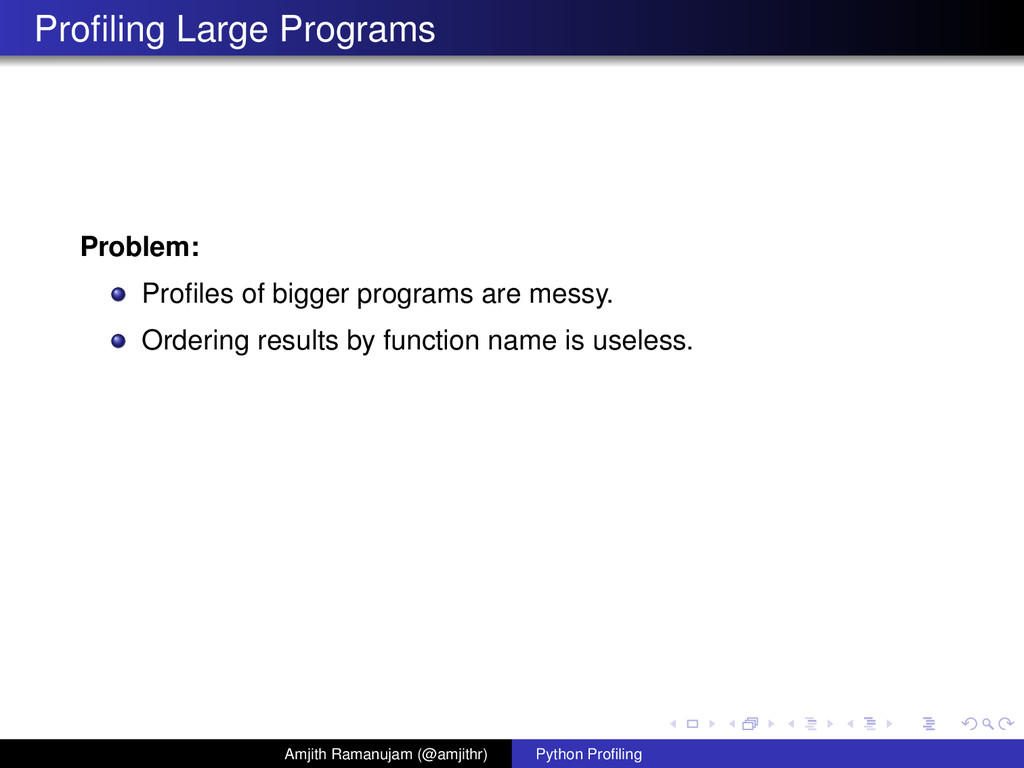
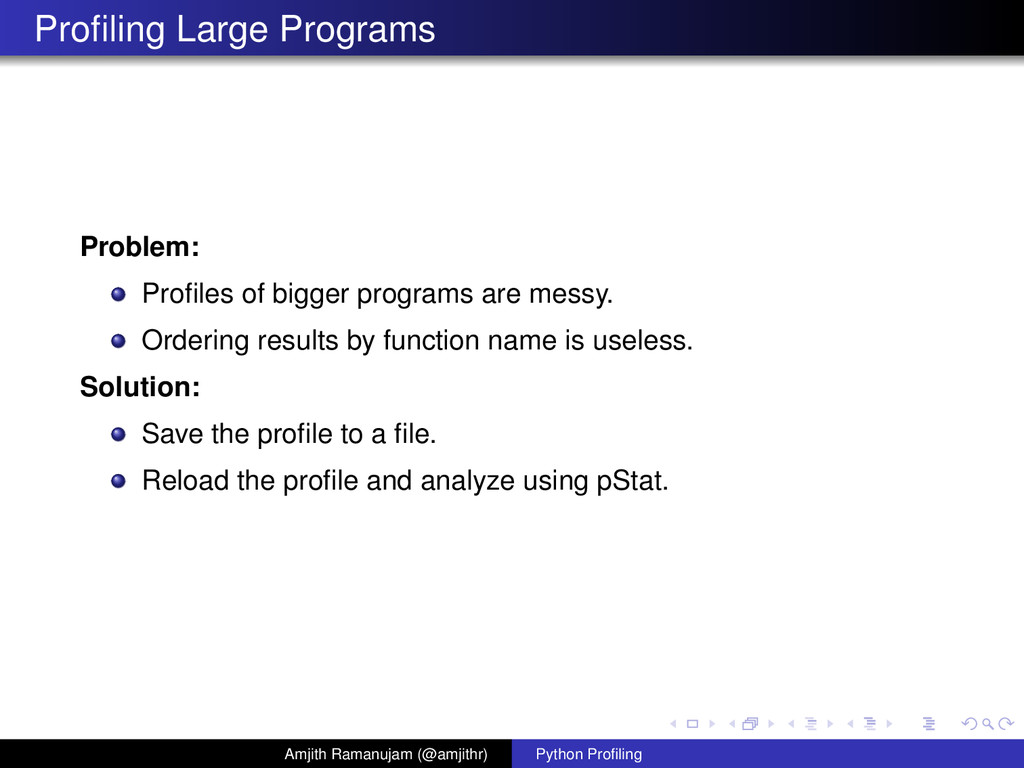
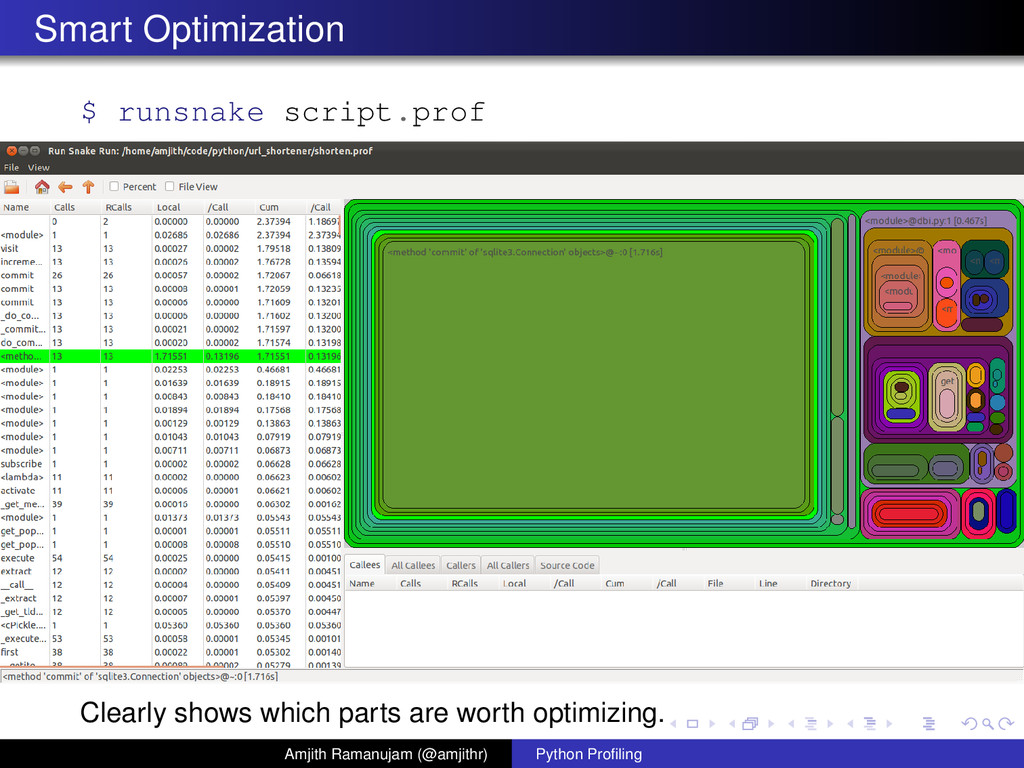
Ordering results by function name is useless. Solution: Save the profile to a file. Reload the profile and analyze using pStat. Amjith Ramanujam (@amjithr) Python Profiling
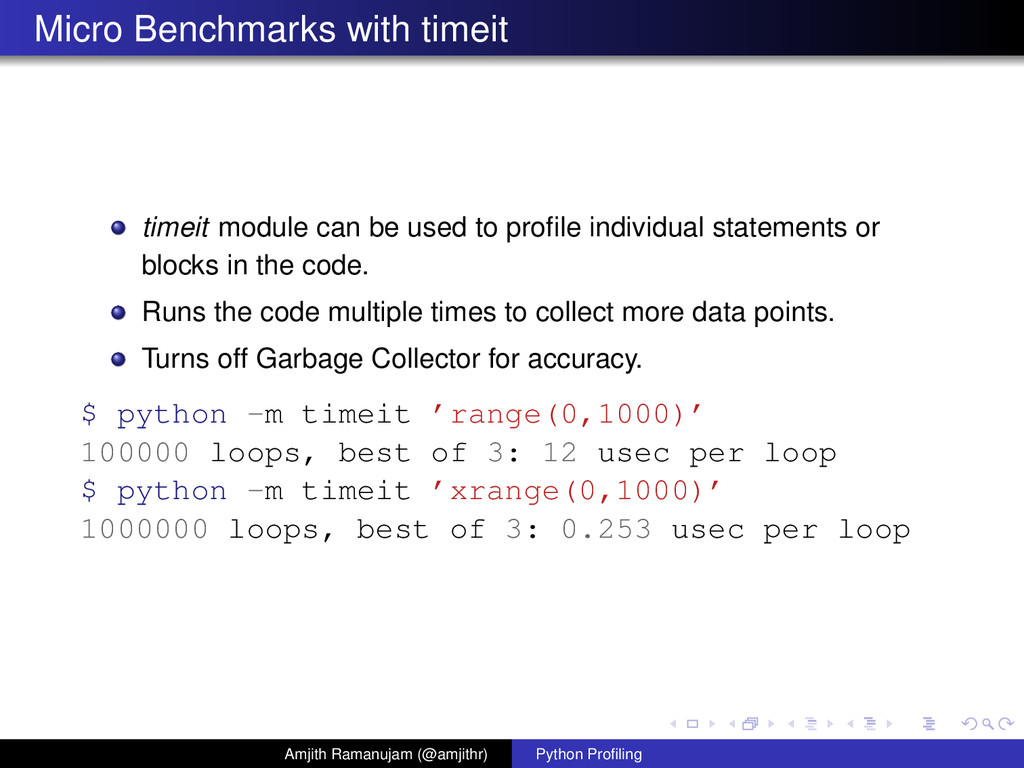
profile individual statements or blocks in the code. Runs the code multiple times to collect more data points. Turns off Garbage Collector for accuracy. $ python -m timeit ’range(0,1000)’ 100000 loops, best of 3: 12 usec per loop $ python -m timeit ’xrange(0,1000)’ 1000000 loops, best of 3: 0.253 usec per loop Amjith Ramanujam (@amjithr) Python Profiling
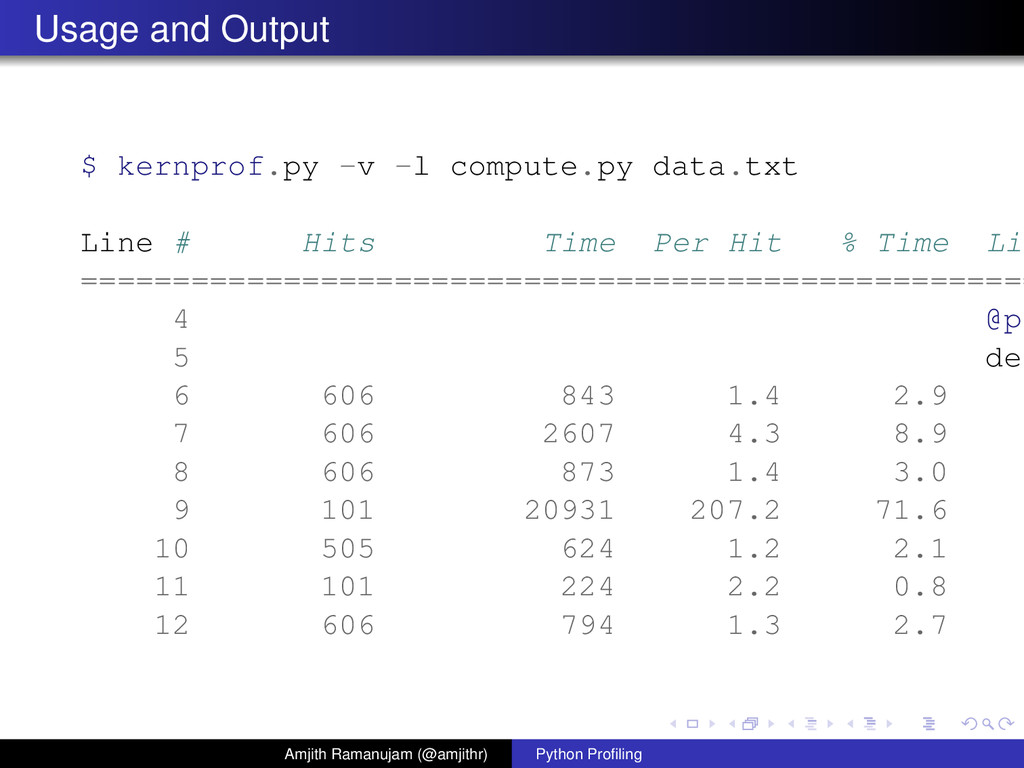
![Usage and Output @profile def compute(tokens): op_s = tokens[0] nums](https://files.speakerdeck.com/presentations/4fa405ac5f35f00022001678/slide_26.jpg)
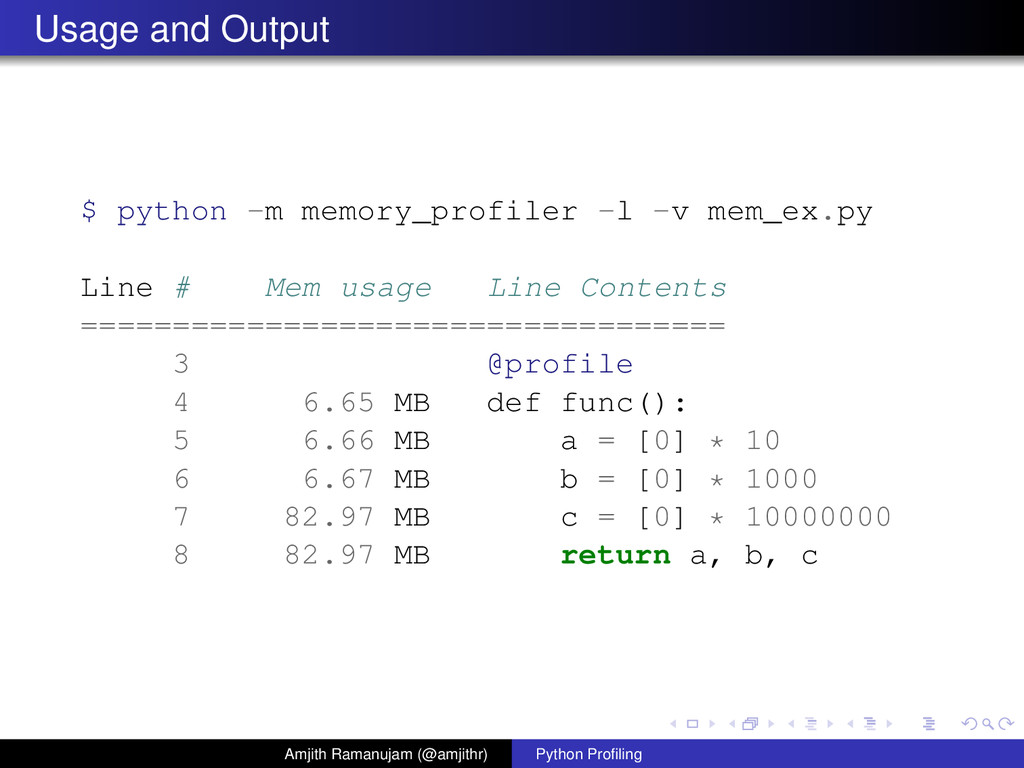
![Usage and Output @profile def func(): a = [0] *](https://files.speakerdeck.com/presentations/4fa405ac5f35f00022001678/slide_30.jpg)