Site: http://paperplanes.de
Travis CI: http://travis-ci.org
Riak Handbook: http://riakhandbook.com
Pingdom: http://pingdom.com
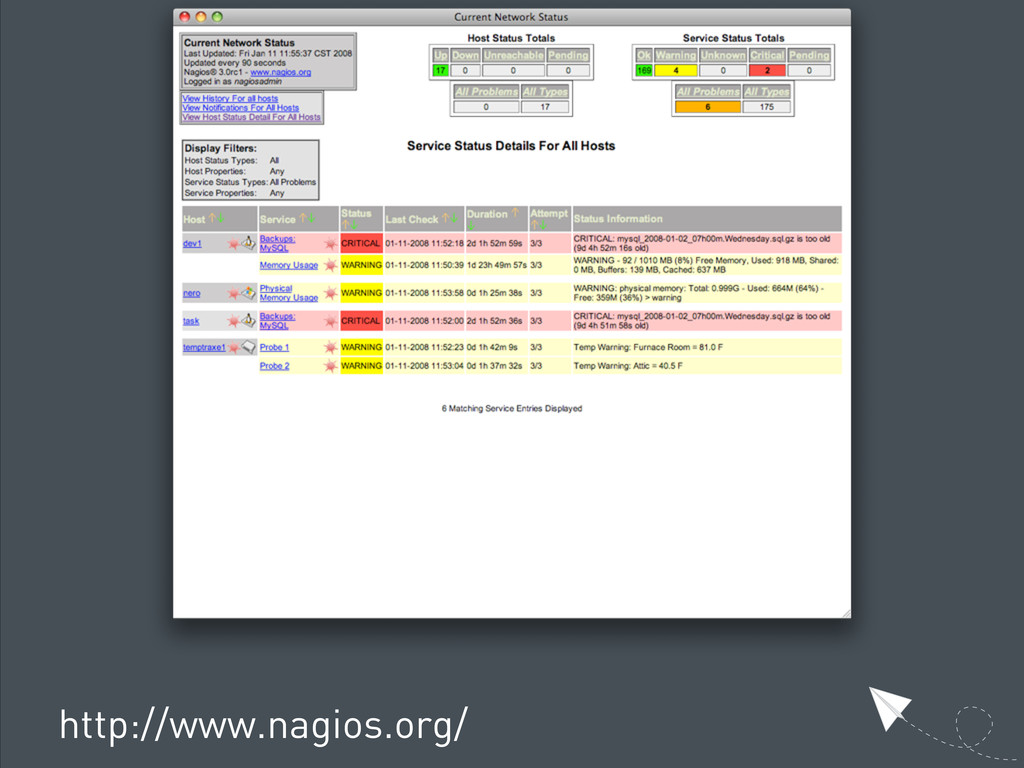
Nagios: http://nagios.org
Sensu: http://www.sonian.com/cloud-monitoring-sensu/
Sheriff: https://github.com/dawanda/sheriff
Monit: http://mmonit.com/monit/
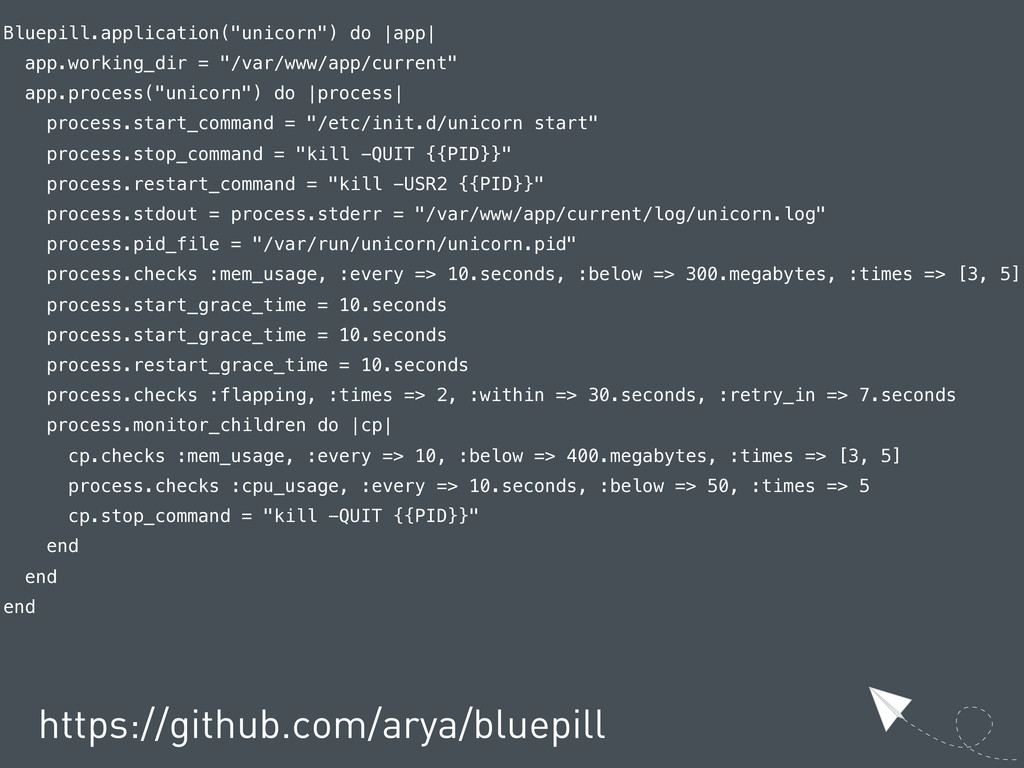
Bluepill: https://github.com/arya/bluepill
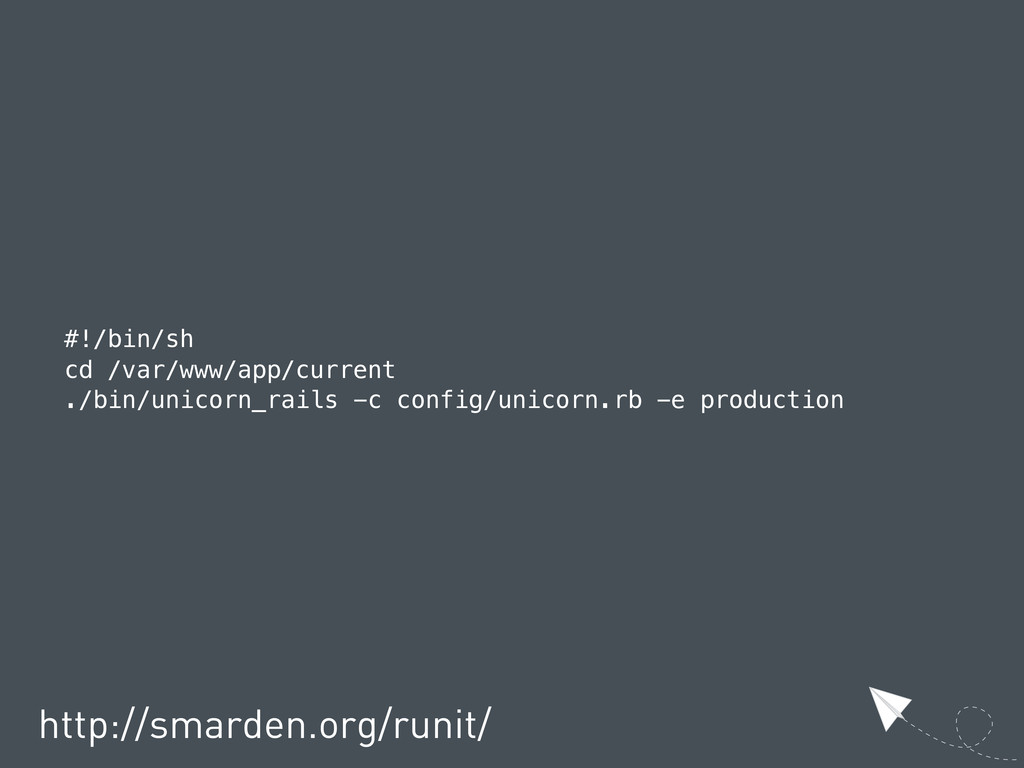
Runit: http://smarden.org/runit/
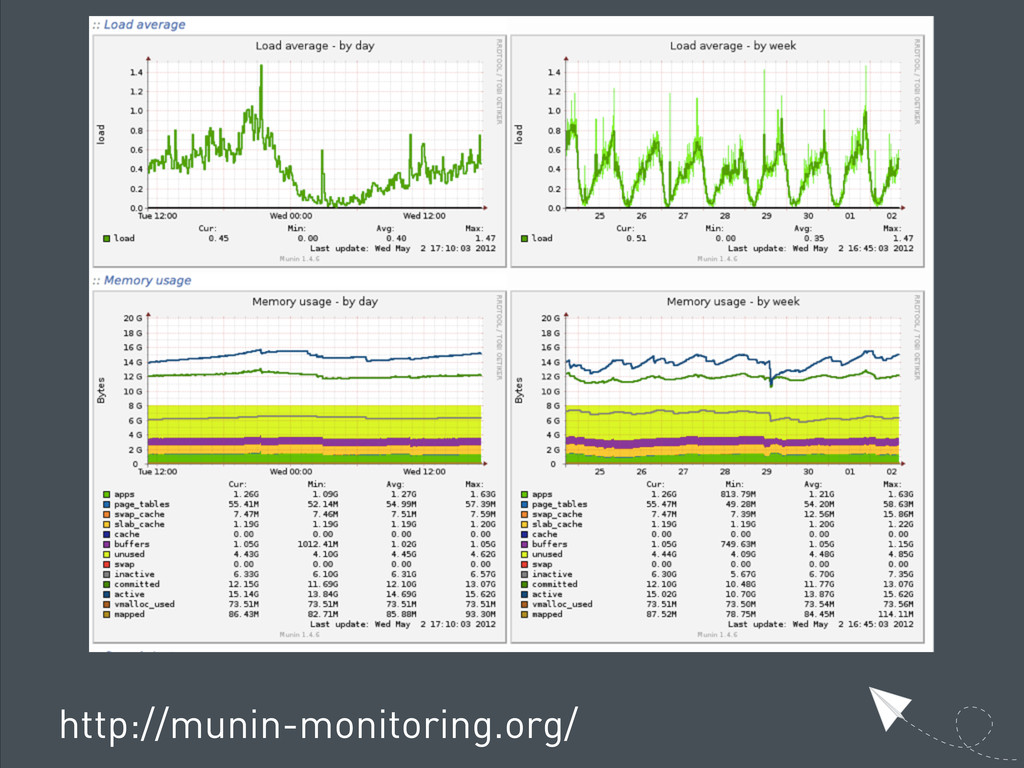
Munin: http://munin-monitoring.org/
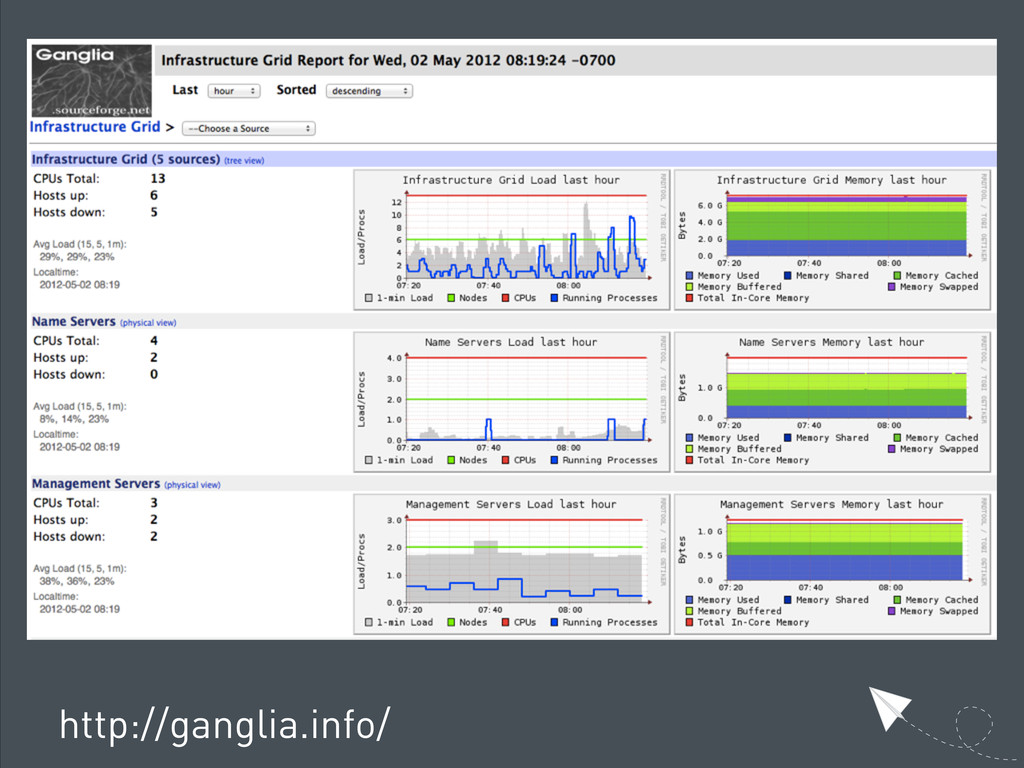
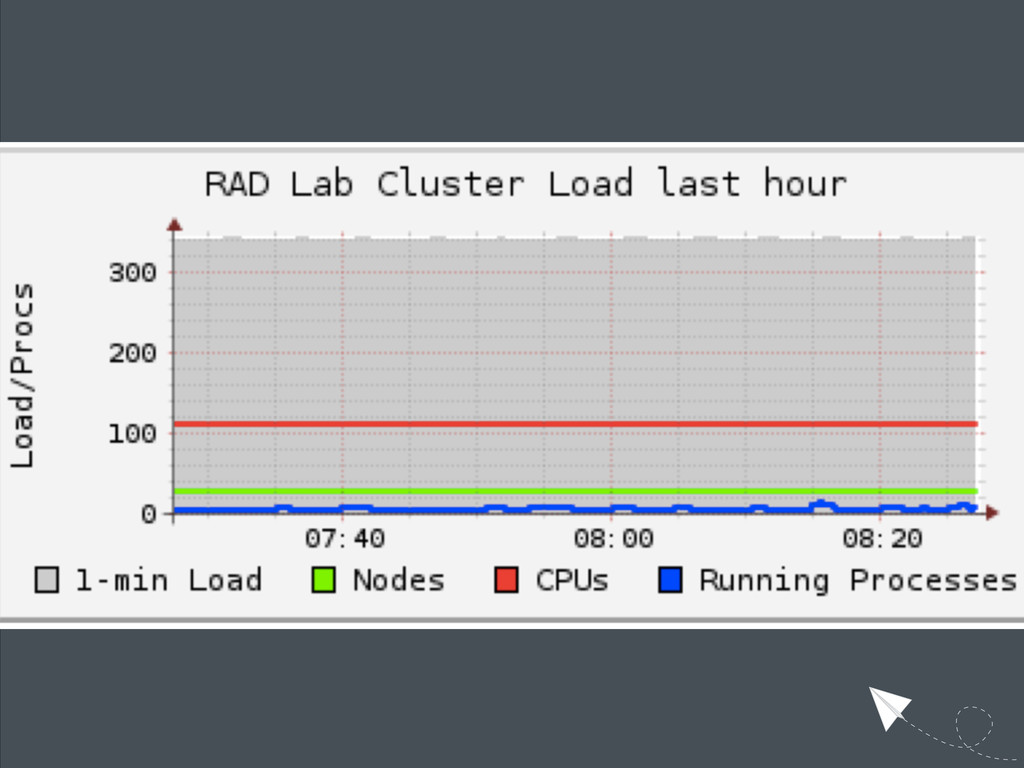
Ganglia: http://ganglia.info/
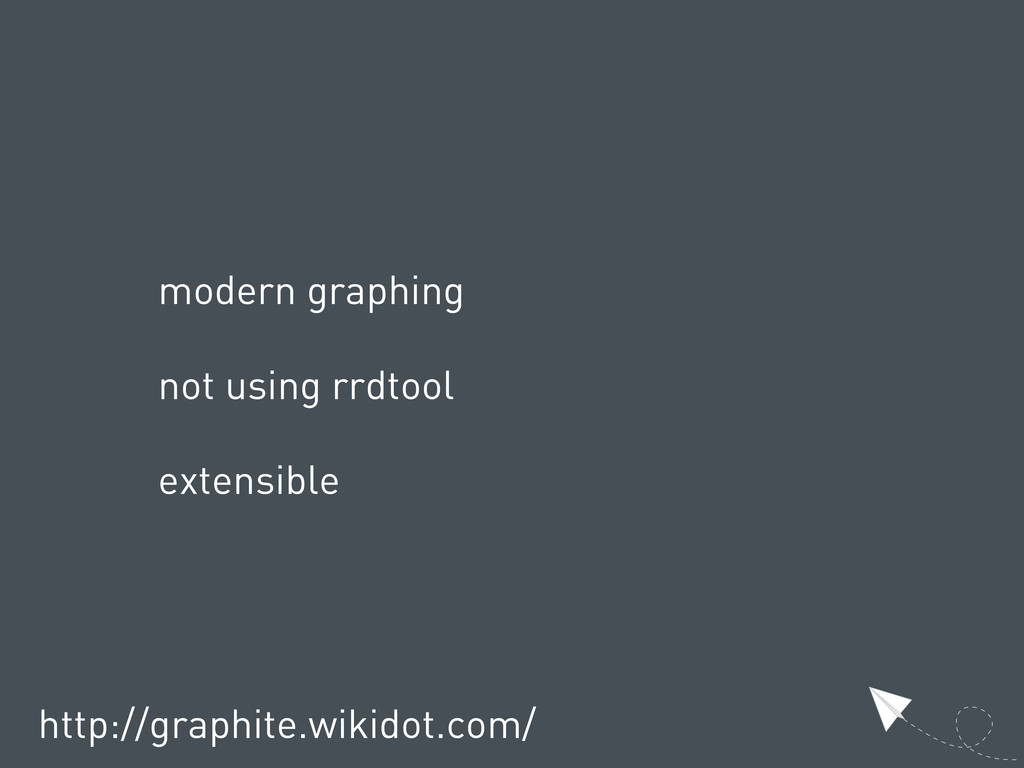
Graphite: http://graphite.wikidot.com
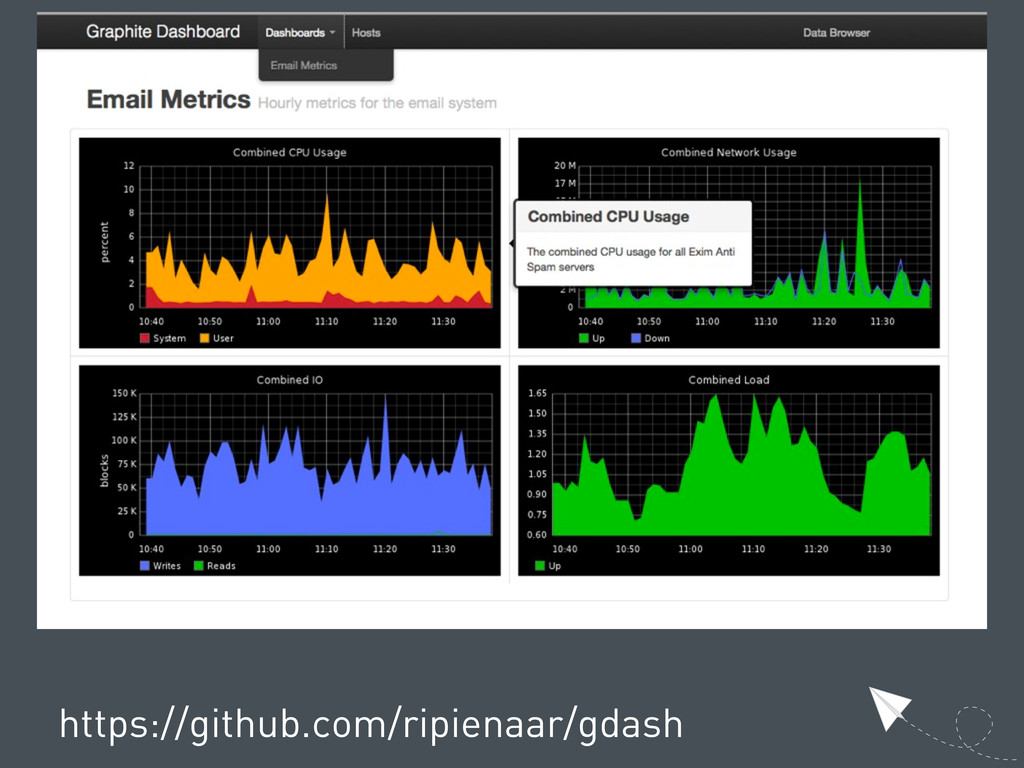
GDash: https://github.com/ripienaar/gdash
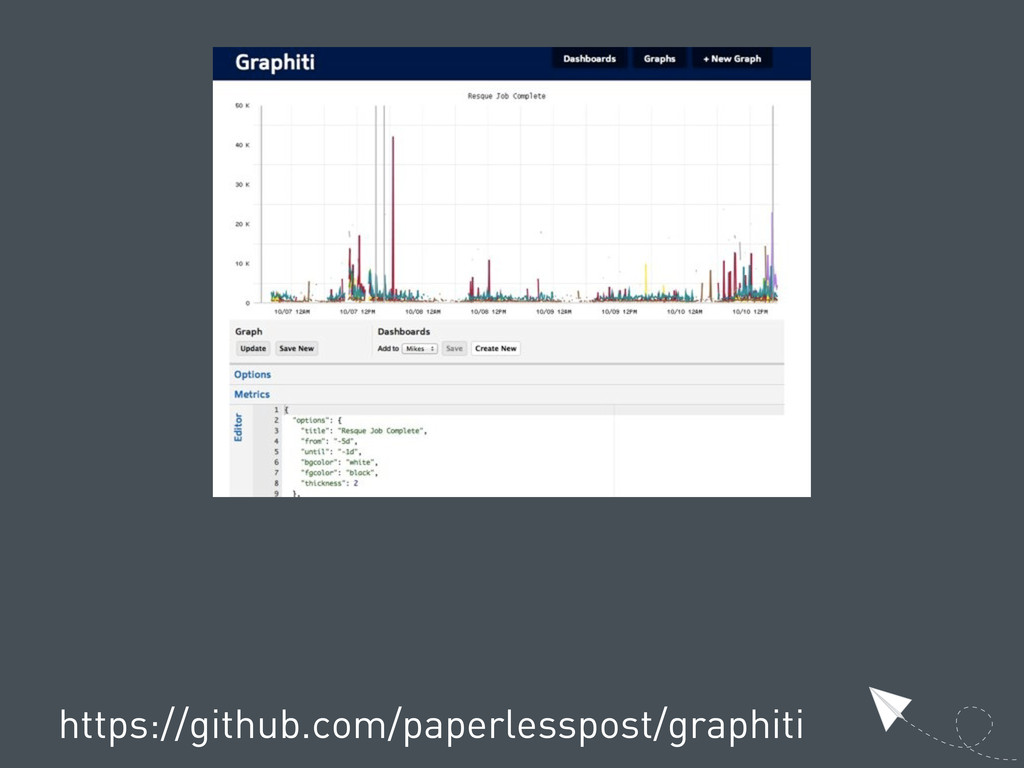
Graphiti: https://github.com/paperlesspost/graphiti
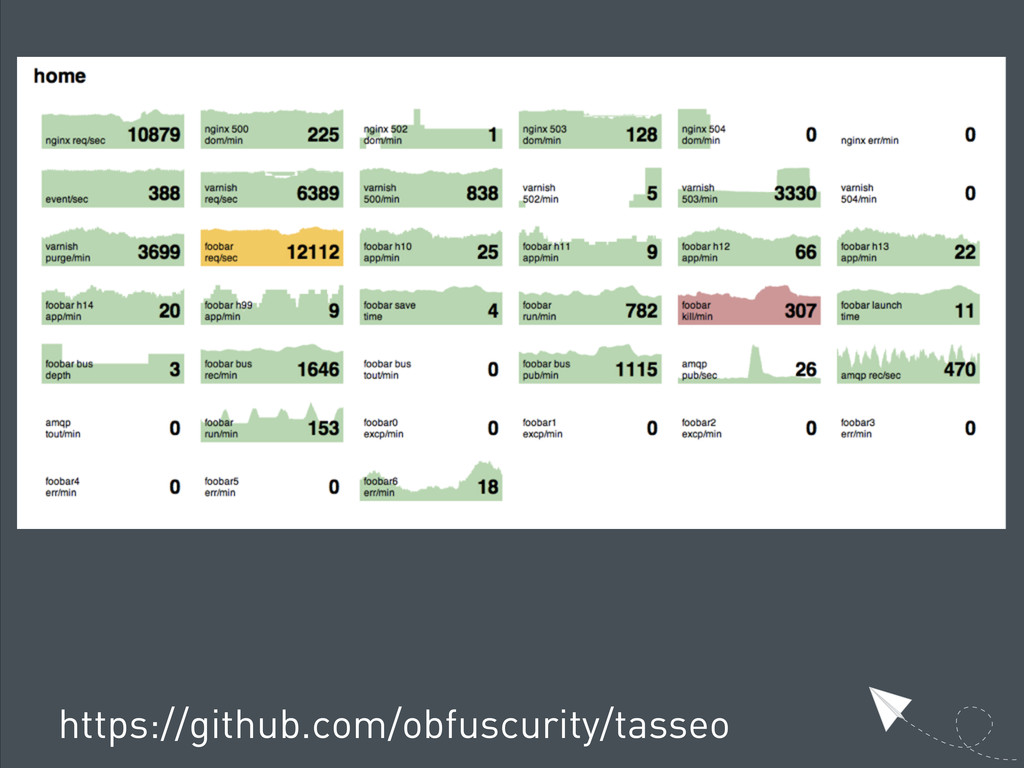
Tasseo: https://github.com/obfuscurity/tasseo
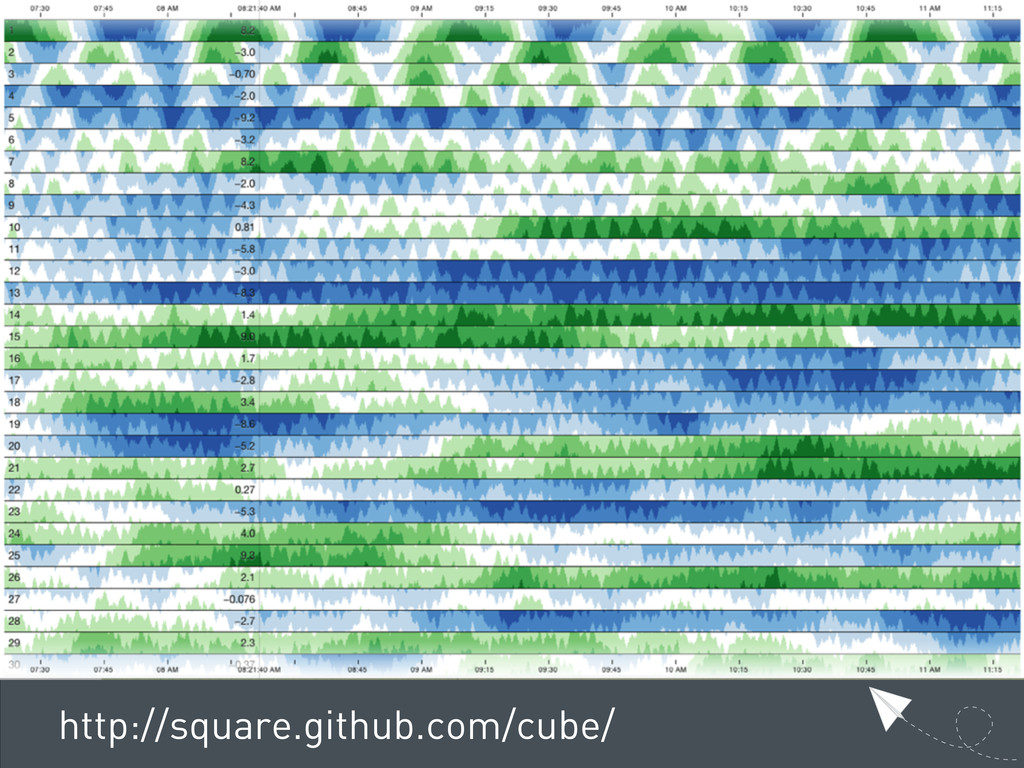
Cube: http://square.github.com/cube/
Cubism: http://square.github.com/cubism/
NewRelic: http://newrelic.com
Scout: http://scoutapp.com
Server Density: http://serverdensity.com
Boundary: http://boundary.com
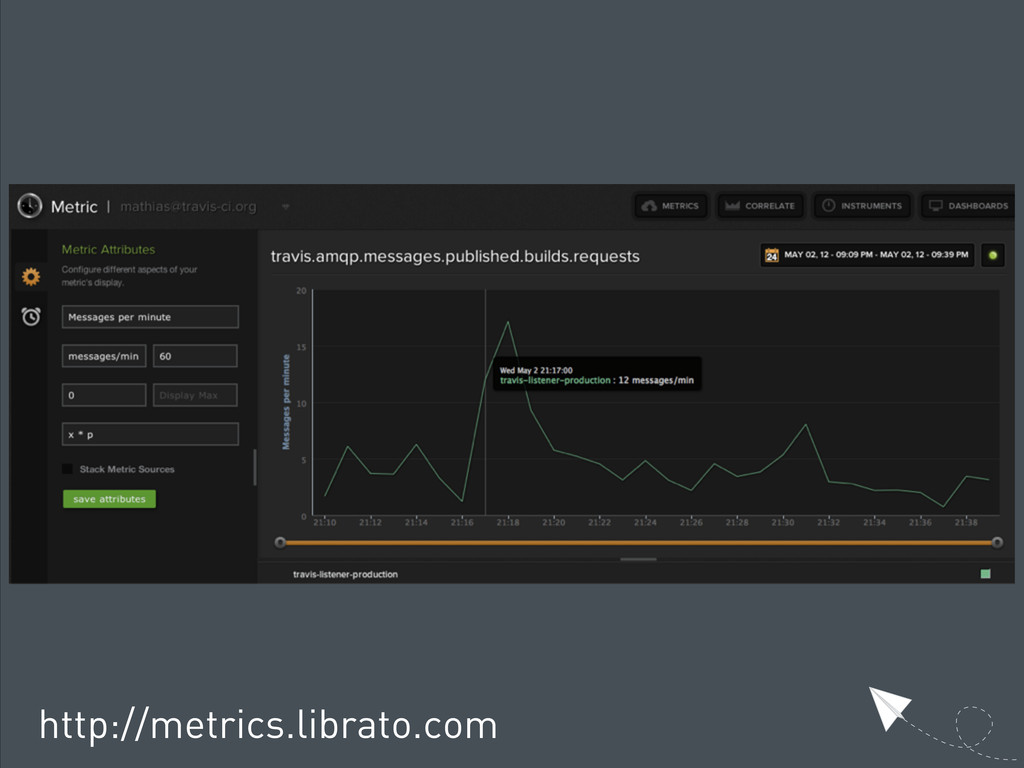
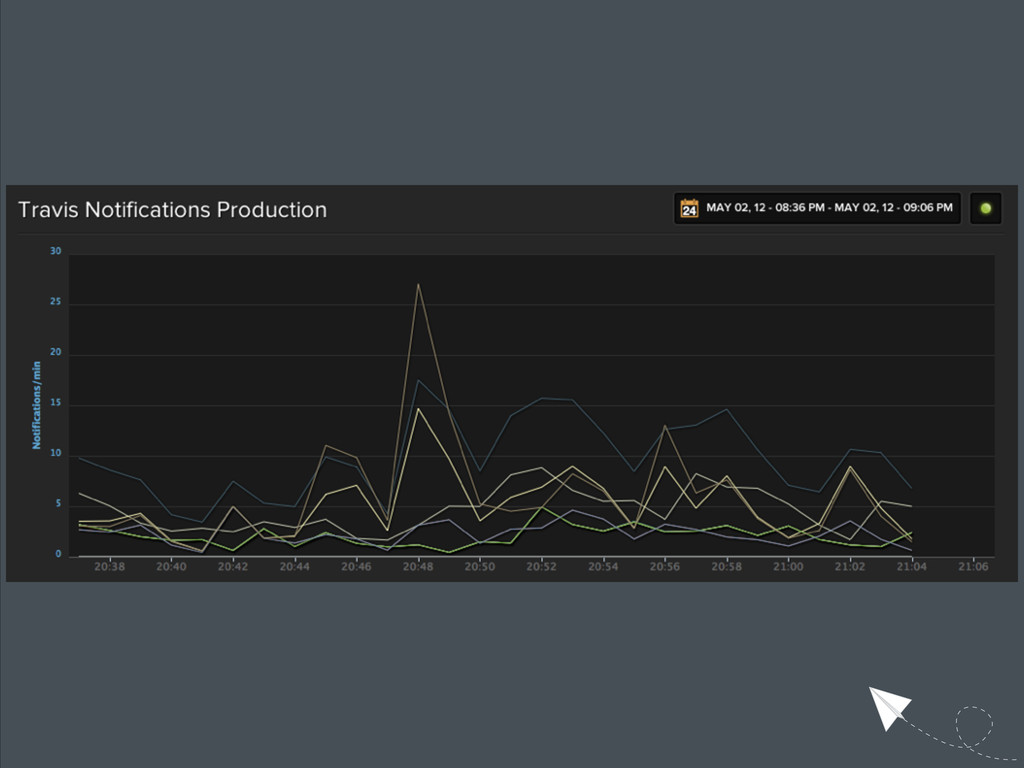
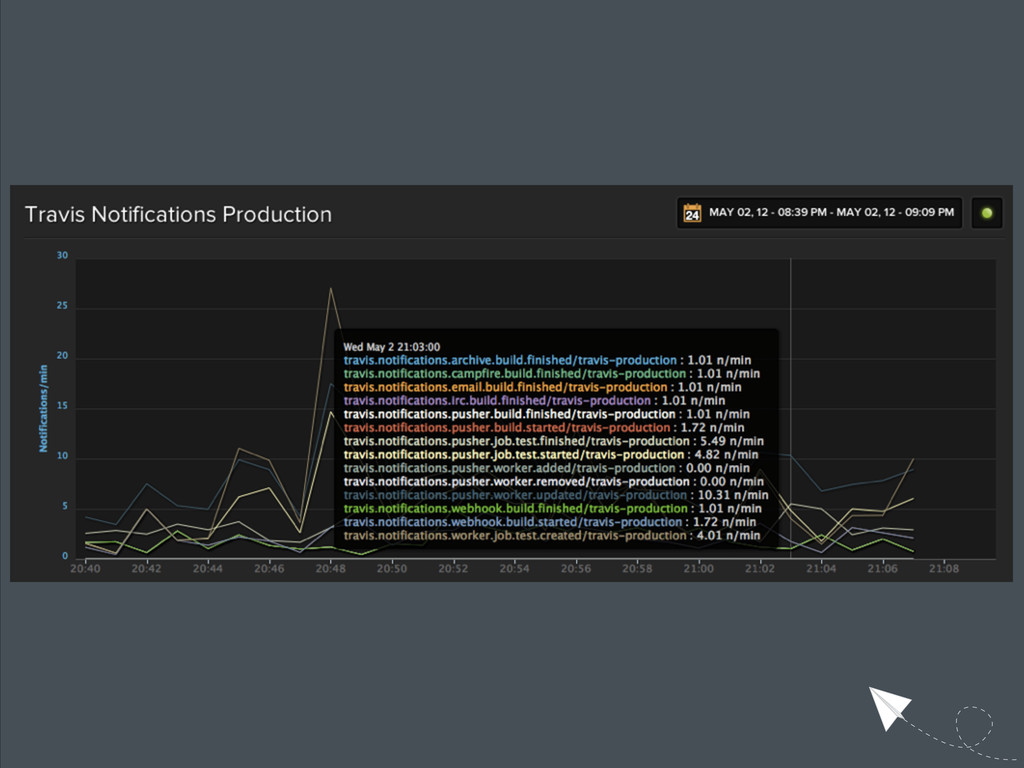
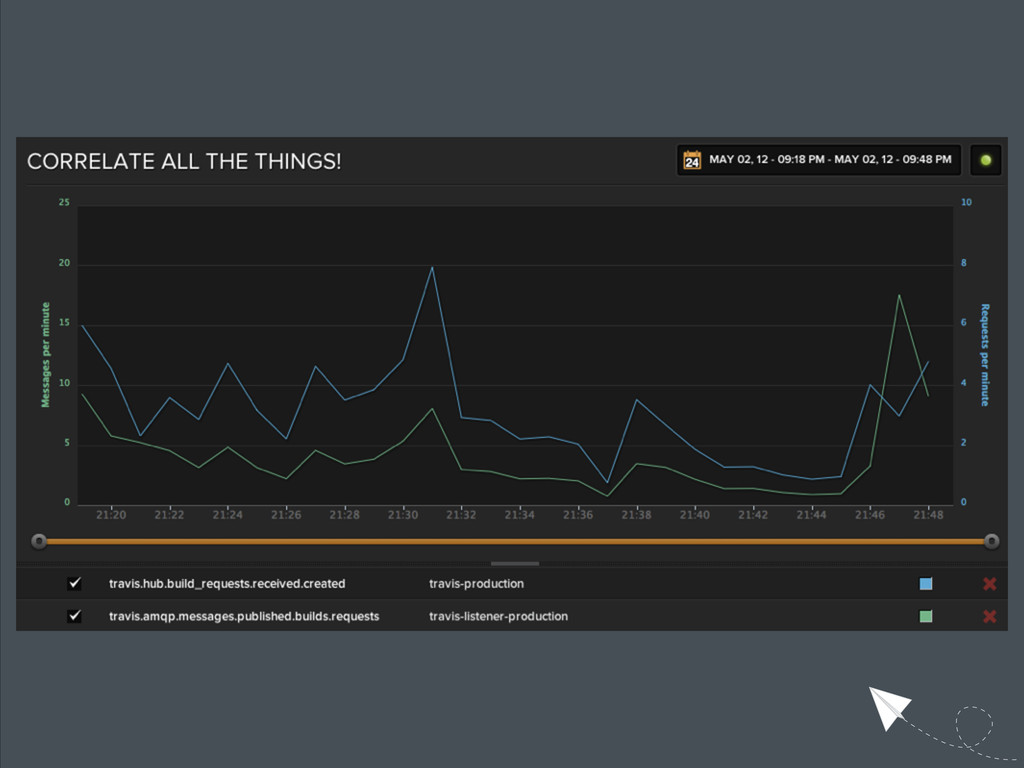
Librato Metrics: http://metrics.librato.com
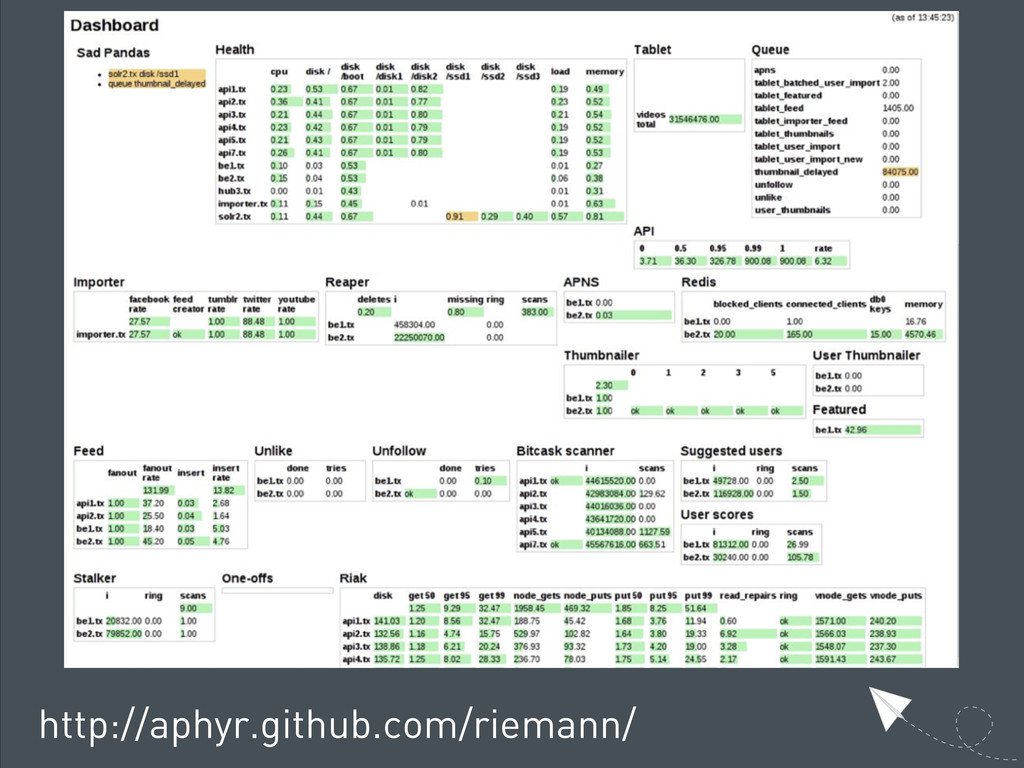
Riemann: http://aphyr.github.com/riemann/
StatsD: https://github.com/etsy/statsd
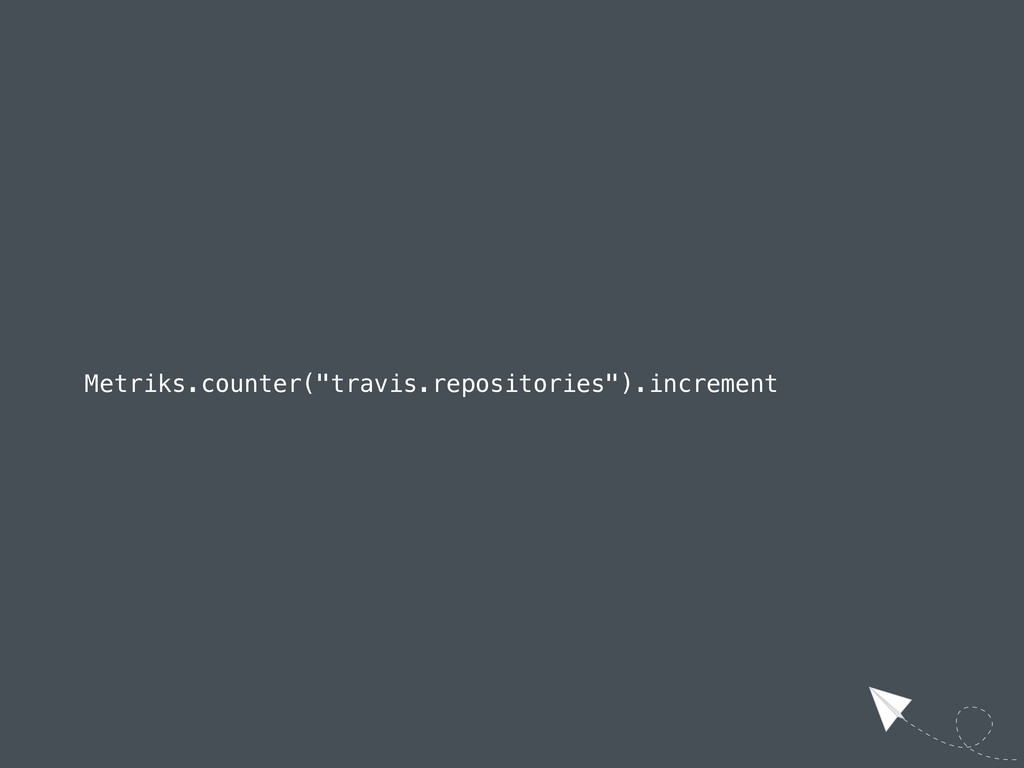
Metriks: https://github.com/eric/metriks
Logstash: http://logstash.net/
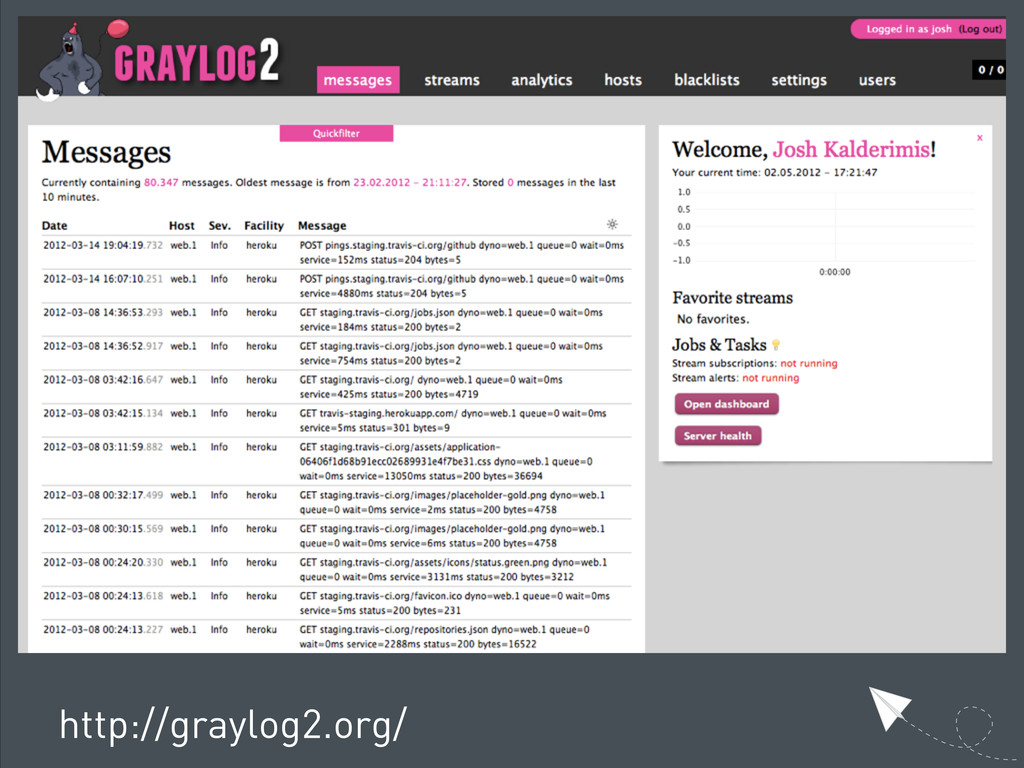
Graylog: http://graylog2.org/
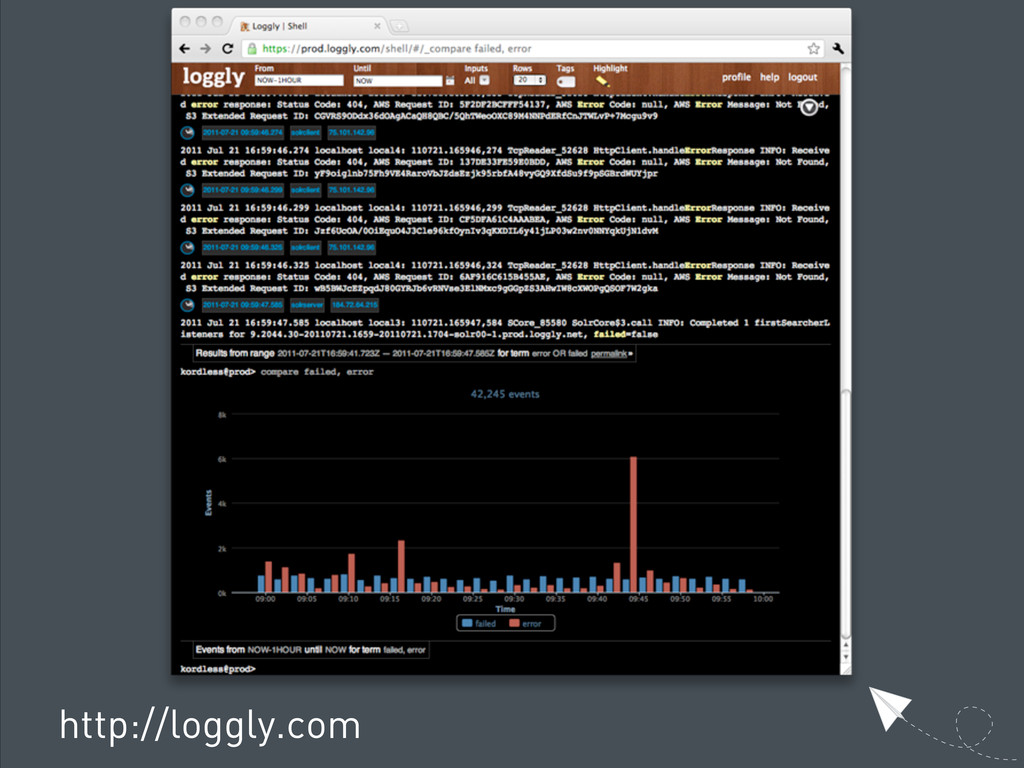
Loggly: http://loggly.com
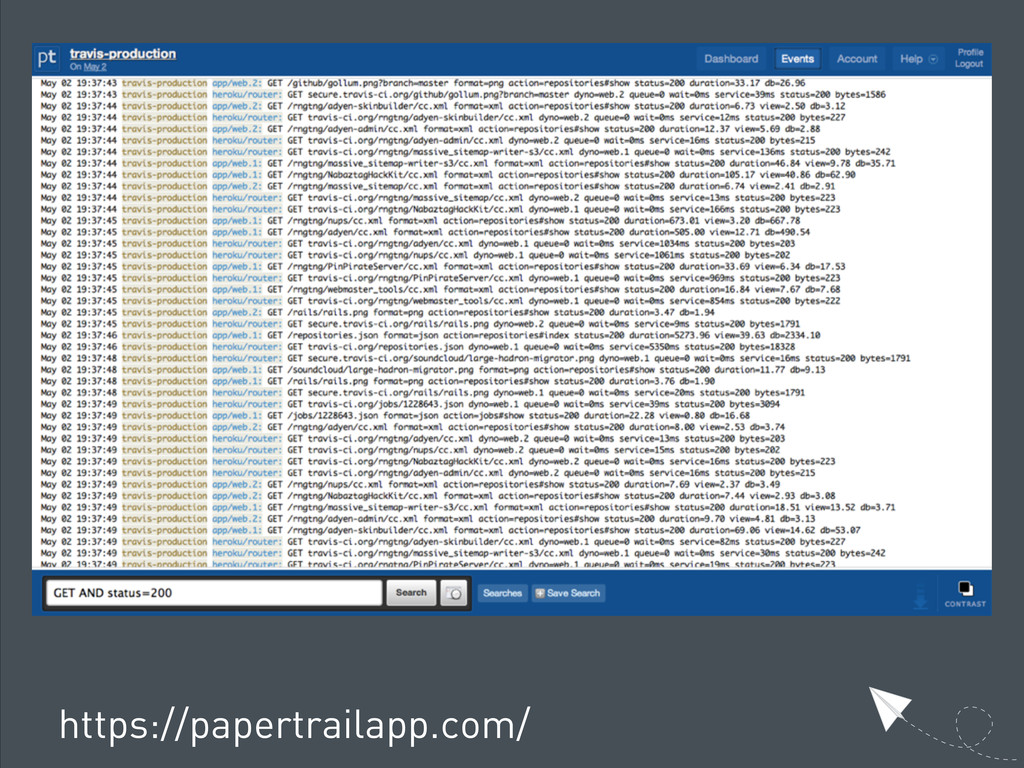
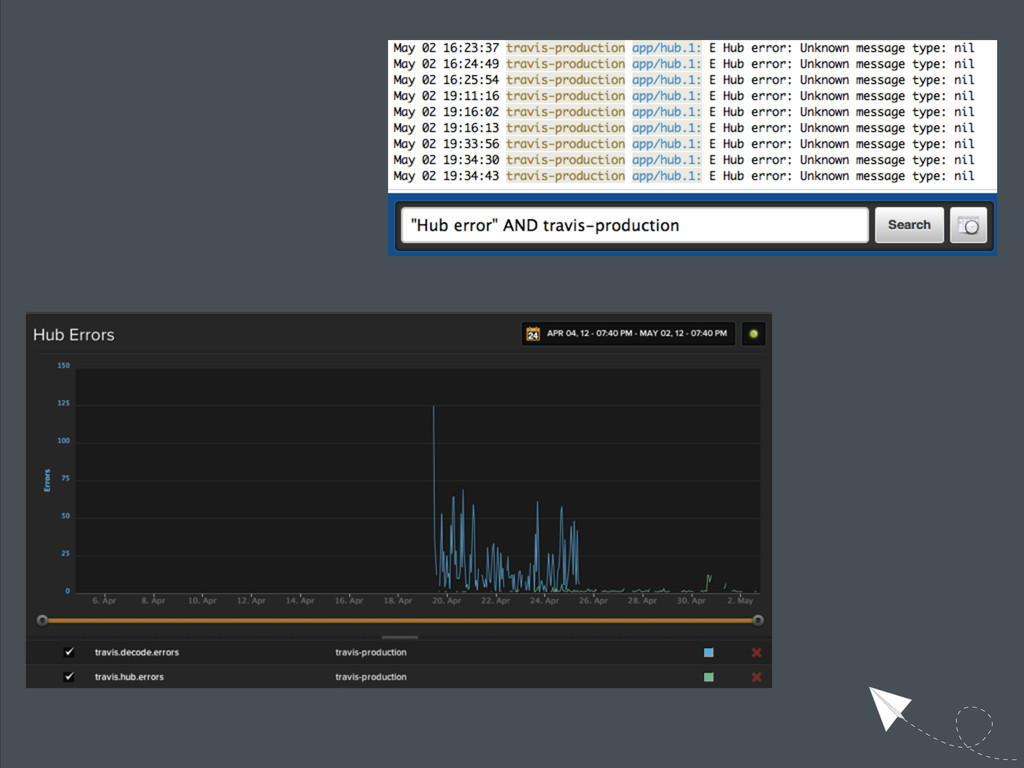
Papertrail: https://papertrailapp.com/
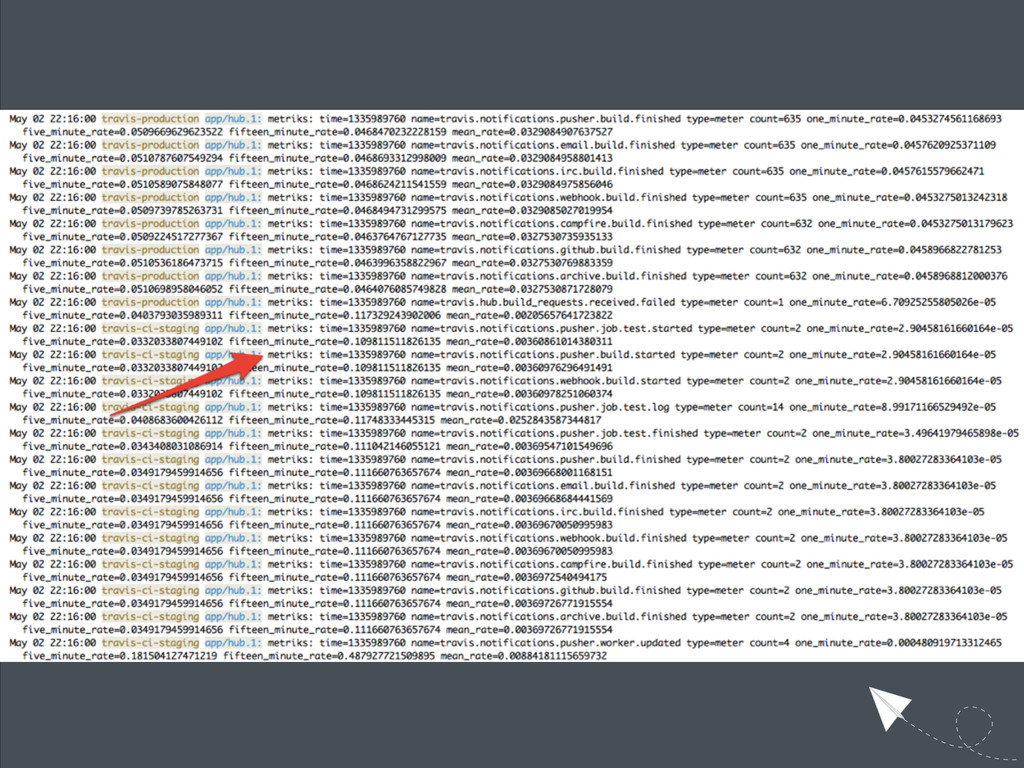
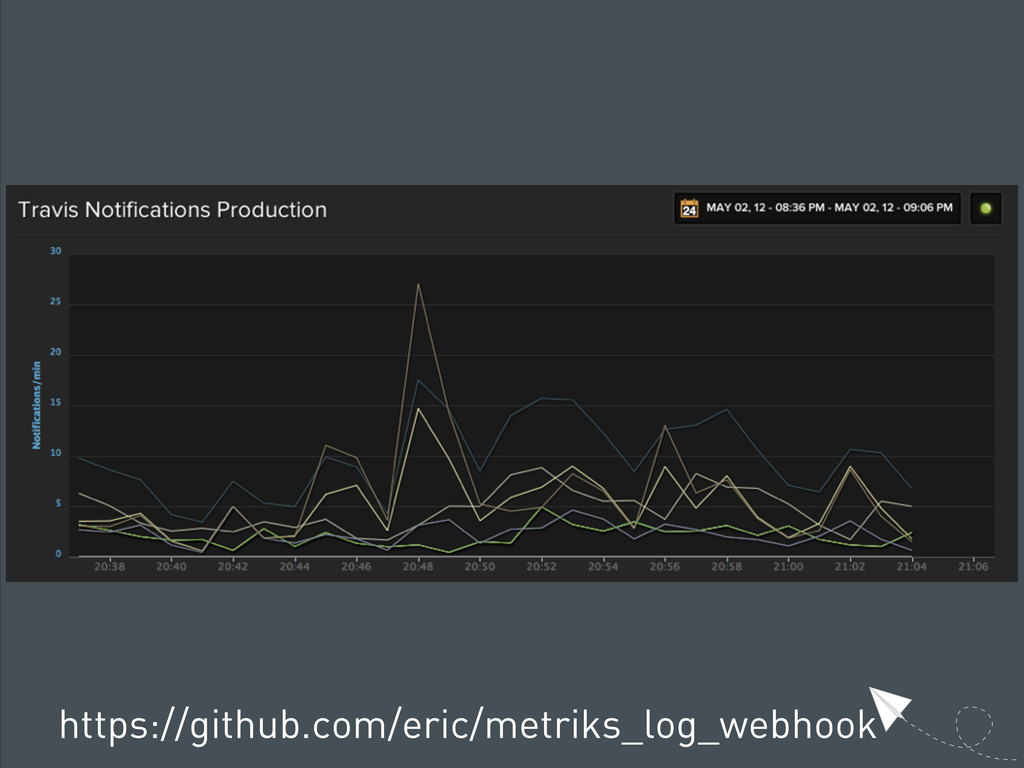
Metriks Log Webhook: https://github.com/eric/metriks_log_webhook
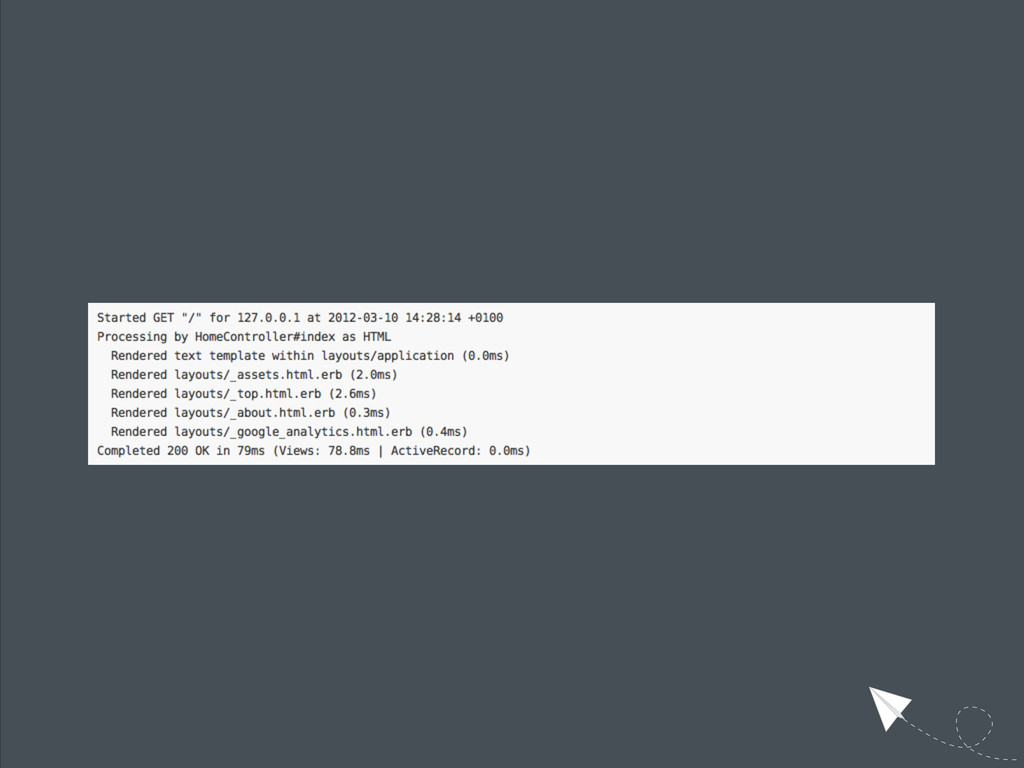
Lograge: https://github.com/mattmatt/lograge
Further reading:
http://www.paperplanes.de/2011/1/5/the_virtues_of_monitoring.html
http://about.travis-ci.org/blog/2012-04-02-metrics-monitoring-infrastructure-oh-my/
http://pivotallabs.com/talks/139-metrics-metrics-everywhere
http://bitmonkey.net/post/18854033582/introducing-metriks
http://code.flickr.com/blog/2008/10/27/counting-timing/