Upgrade to Pro
— share decks privately, control downloads, hide ads and more …
Speaker Deck
Features
Speaker Deck
PRO
Sign in
Sign up for free
Search
Search
Data Driven Performance Optimisation
Search
Sponsored
·
SiteGround - Reliable hosting with speed, security, and support you can count on.
→
Stefan Baumgartner
June 10, 2015
Technology
2
500
Data Driven Performance Optimisation
Which key metrics should we choose to get an idea on our site's performance?
Stefan Baumgartner
June 10, 2015
Tweet
Share
More Decks by Stefan Baumgartner
See All by Stefan Baumgartner
Idiomatic Rust
ddprrt
0
130
Automating UI development
ddprrt
0
160
The hero's journey in JavaScript frameworks
ddprrt
0
710
Get a grid for flex' sake
ddprrt
1
560
Technical Writing
ddprrt
0
560
Web performance optimisation for single page applications
ddprrt
1
750
The Super Mario Bros. Principle - Extended Edition
ddprrt
0
160
HTTP/2 is coming! Unbundle all the things?!?
ddprrt
4
610
The Super Mario Bros. Principle
ddprrt
2
590
Other Decks in Technology
See All in Technology
Amazon S3 Vectorsを使って資格勉強用AIエージェントを構築してみた
usanchuu
3
450
Context Engineeringの取り組み
nutslove
0
340
モダンUIでフルサーバーレスなAIエージェントをAmplifyとCDKでサクッとデプロイしよう
minorun365
4
180
顧客との商談議事録をみんなで読んで顧客解像度を上げよう
shibayu36
0
220
GSIが複数キー対応したことで、俺達はいったい何が嬉しいのか?
smt7174
3
150
Digitization部 紹介資料
sansan33
PRO
1
6.8k
MCPでつなぐElasticsearchとLLM - 深夜の障害対応を楽にしたい / Bridging Elasticsearch and LLMs with MCP
sashimimochi
0
160
会社紹介資料 / Sansan Company Profile
sansan33
PRO
15
400k
Frontier Agents (Kiro autonomous agent / AWS Security Agent / AWS DevOps Agent) の紹介
msysh
3
170
StrandsとNeptuneを使ってナレッジグラフを構築する
yakumo
1
110
制約が導く迷わない設計 〜 信頼性と運用性を両立するマイナンバー管理システムの実践 〜
bwkw
3
920
Agile Leadership Summit Keynote 2026
m_seki
1
590
Featured
See All Featured
エンジニアに許された特別な時間の終わり
watany
106
230k
Accessibility Awareness
sabderemane
0
51
Lightning Talk: Beautiful Slides for Beginners
inesmontani
PRO
1
440
Exploring the Power of Turbo Streams & Action Cable | RailsConf2023
kevinliebholz
37
6.3k
Avoiding the “Bad Training, Faster” Trap in the Age of AI
tmiket
0
76
Code Review Best Practice
trishagee
74
20k
個人開発の失敗を避けるイケてる考え方 / tips for indie hackers
panda_program
122
21k
GitHub's CSS Performance
jonrohan
1032
470k
A designer walks into a library…
pauljervisheath
210
24k
Become a Pro
speakerdeck
PRO
31
5.8k
Max Prin - Stacking Signals: How International SEO Comes Together (And Falls Apart)
techseoconnect
PRO
0
84
Chasing Engaging Ingredients in Design
codingconduct
0
110
Transcript
Data Driven Performance Optimisation Stefan Baumgartner | @ddprrt
ruxit.com
None
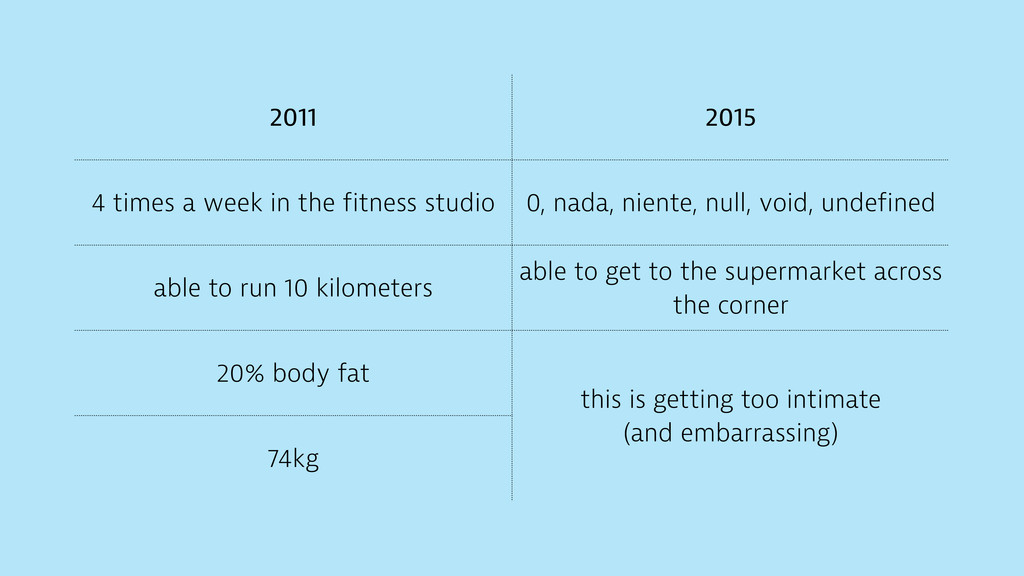
2011 2015 4 times a week in the fitness studio
0, nada, niente, null, void, undefined able to run 10 kilometers able to get to the supermarket across the corner 20% body fat this is getting too intimate (and embarrassing) 74kg
Faster than a speeding bullet?
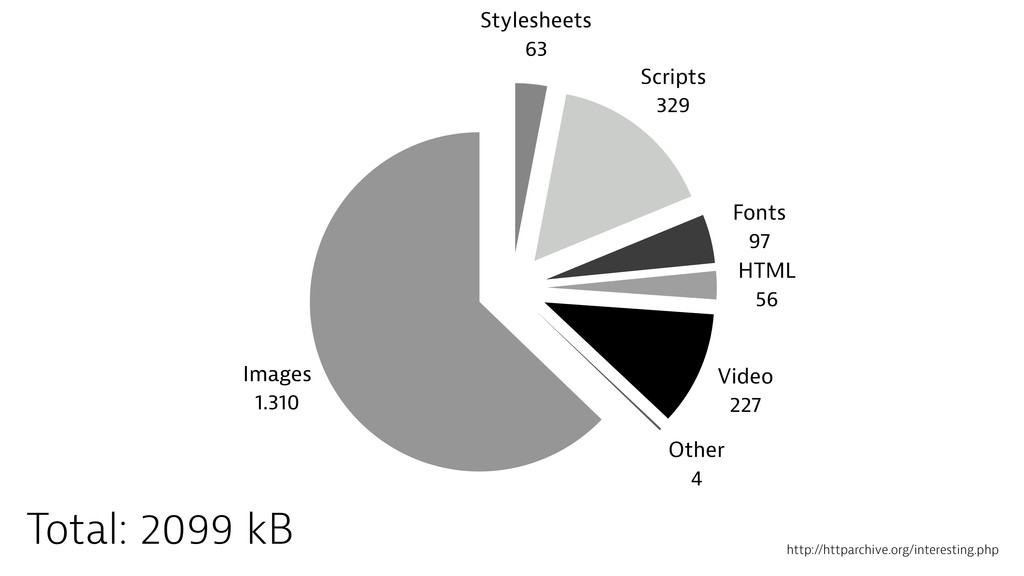
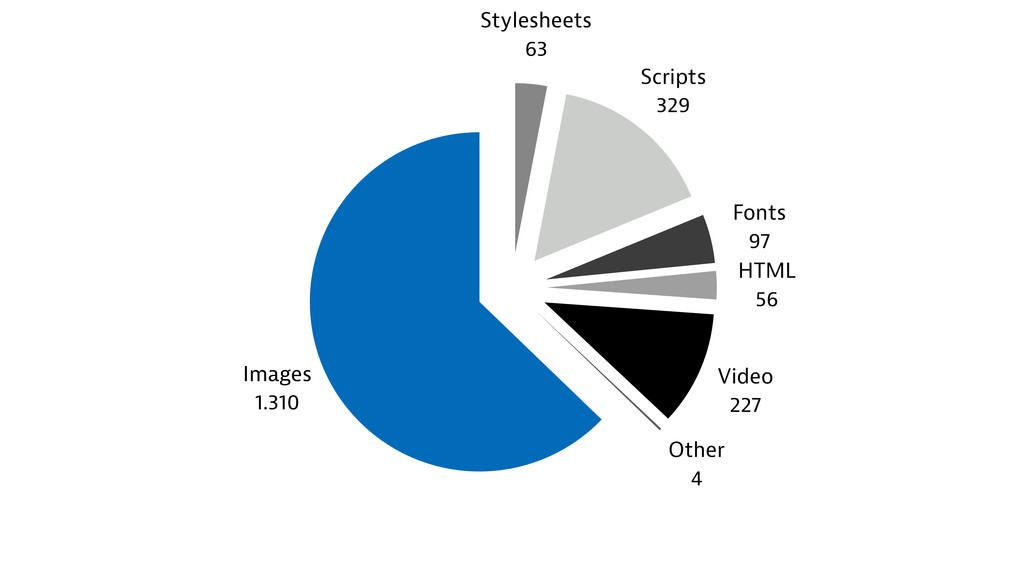
Our websites are too heavy!!
Images 1.310 Other 4 Video 227 HTML 56 Fonts 97
Scripts 329 Stylesheets 63 http://httparchive.org/interesting.php Total: 2099 kB
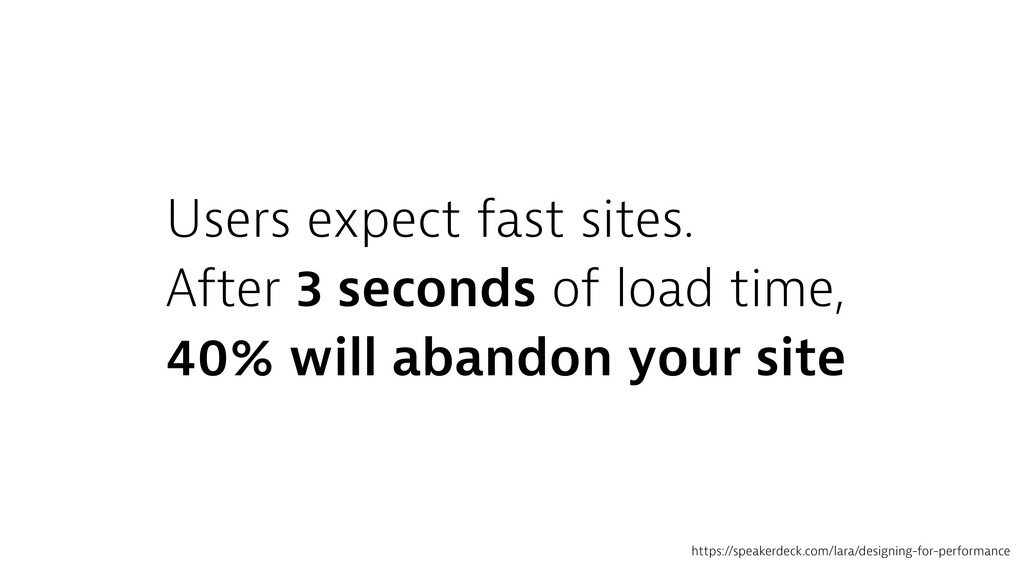
Users expect fast sites. After 3 seconds of load time,
40% will abandon your site https://speakerdeck.com/lara/designing-for-performance
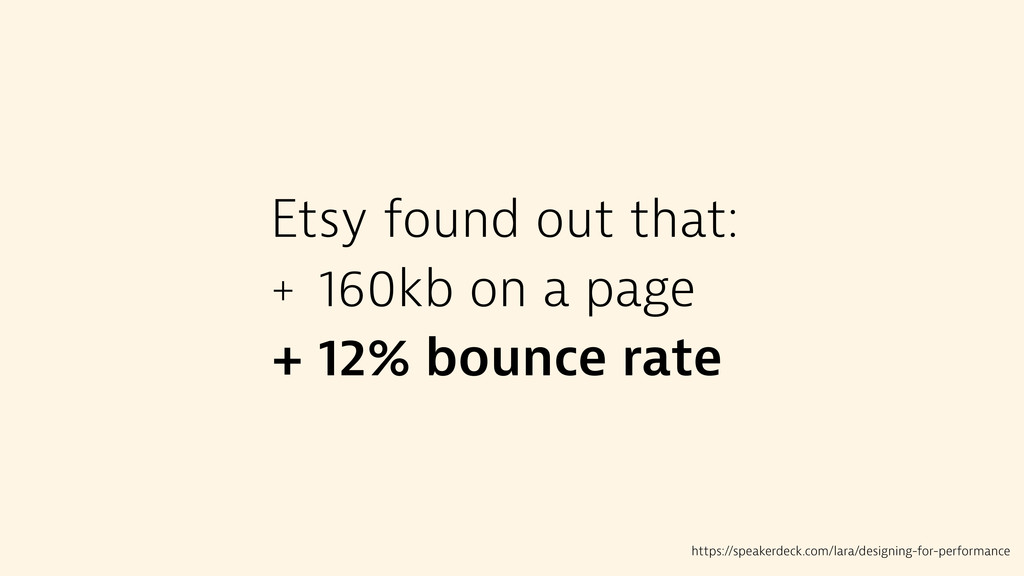
Etsy found out that: + 160kb on a page +
12% bounce rate https://speakerdeck.com/lara/designing-for-performance
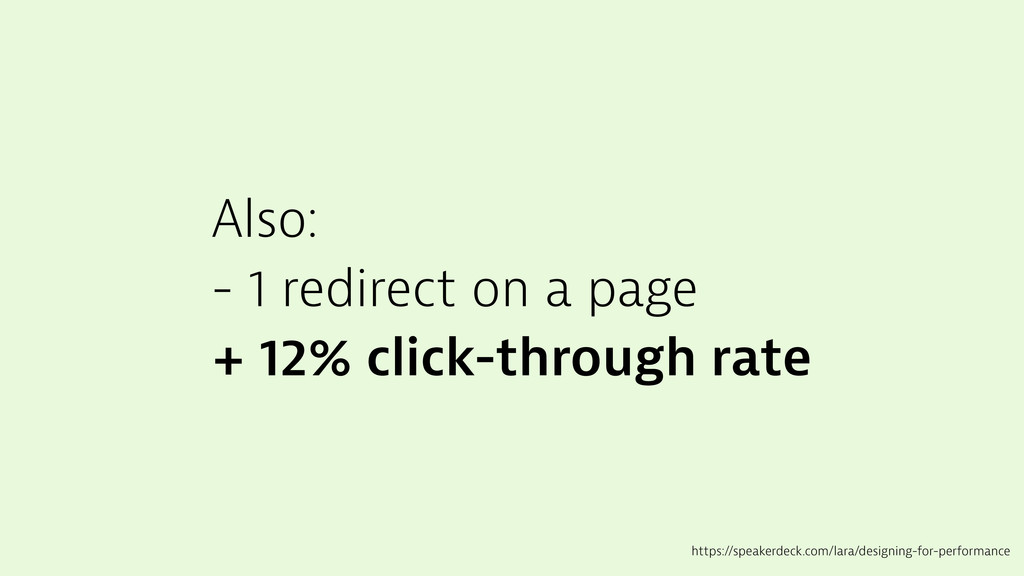
Also: - 1 redirect on a page + 12% click-through
rate https://speakerdeck.com/lara/designing-for-performance
Performance matters!
But what should we be aiming for?
We need good, reliable and replicable key metrics
1 Pageweight
“Weight” is an easy one: The bigger your site is,
the more it has to transfer over the wire.
So the goal is: Reduce weight!
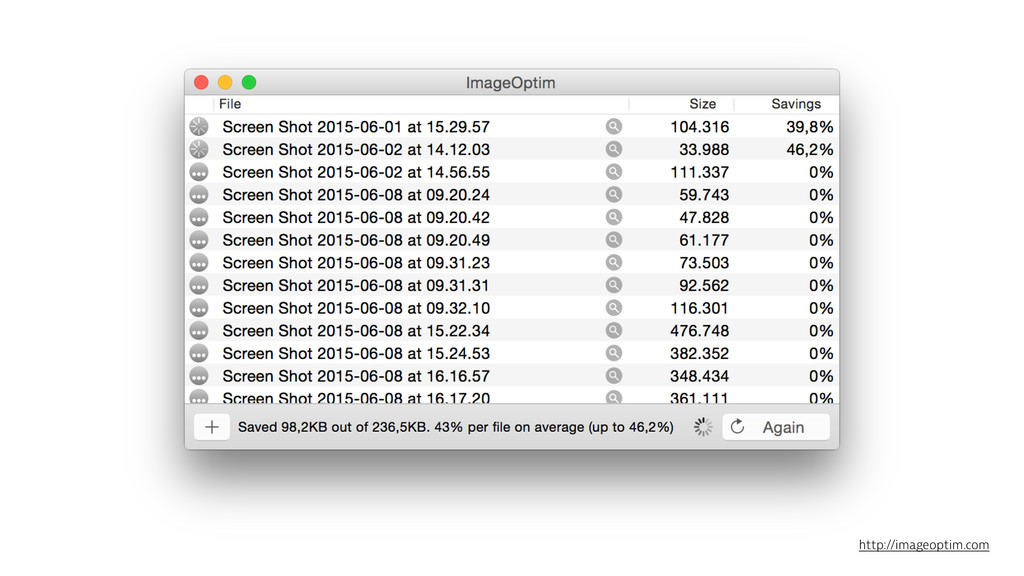
Images 1.310 Other 4 Video 227 HTML 56 Fonts 97
Scripts 329 Stylesheets 63
http://imageoptim.com
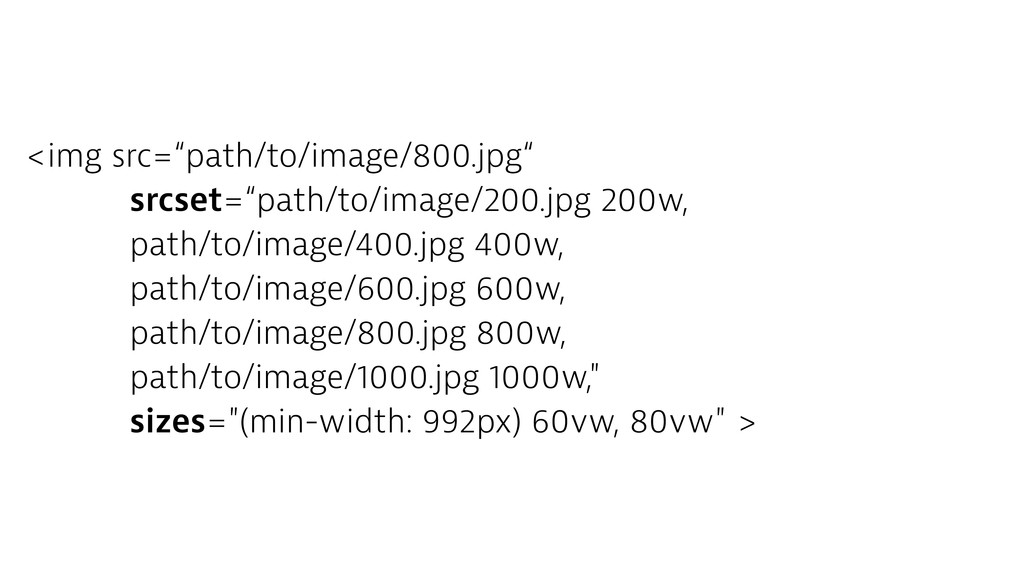
<img src=“path/to/image/800.jpg“ srcset=“path/to/image/200.jpg 200w, path/to/image/400.jpg 400w, path/to/image/600.jpg 600w, path/to/image/800.jpg 800w,
path/to/image/1000.jpg 1000w," sizes="(min-width: 992px) 60vw, 80vw" >
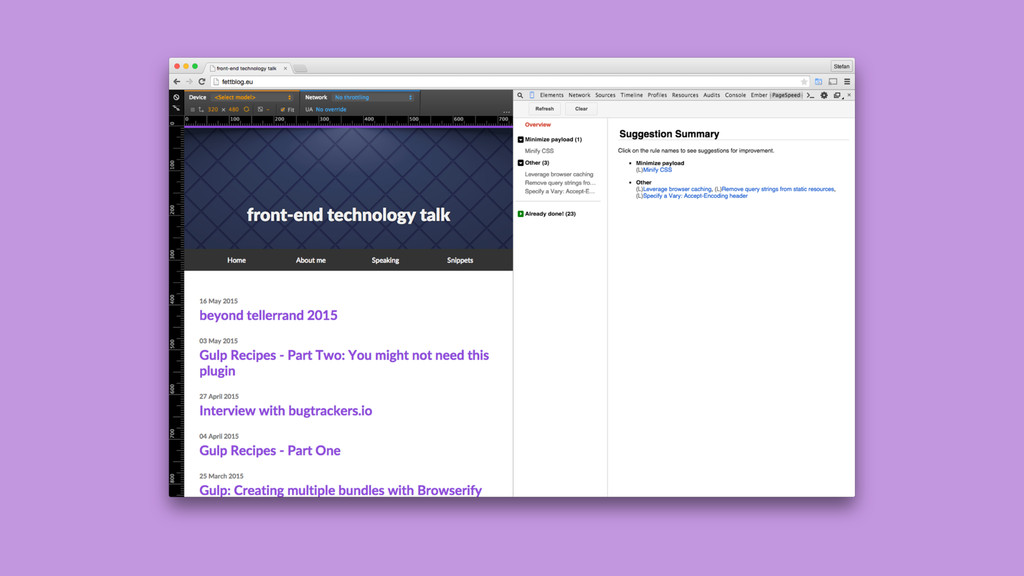
How to keep track?
None
None
https://github.com/macbre/phantomas
http://www.filamentgroup.com/lab/weight-wait.html
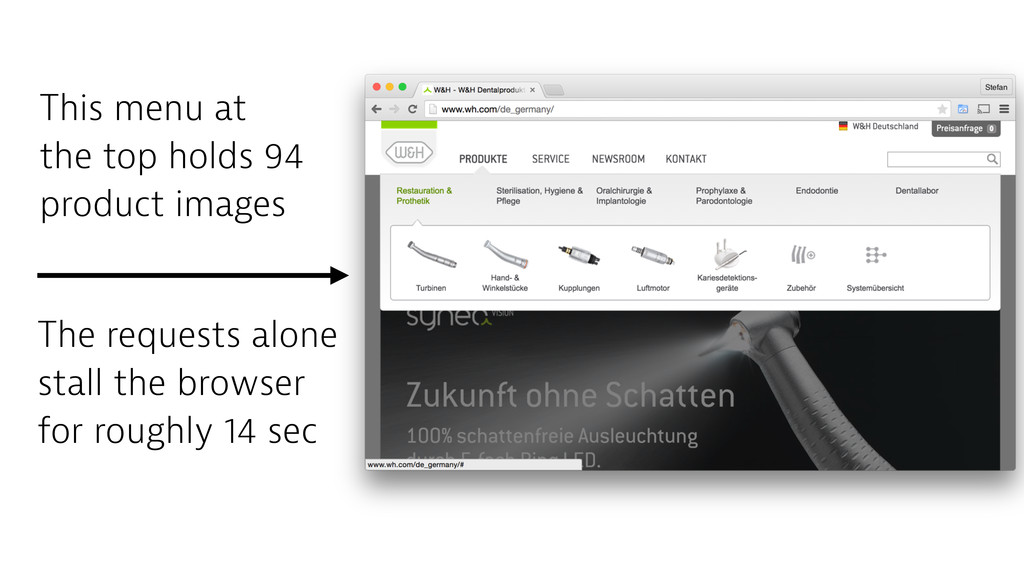
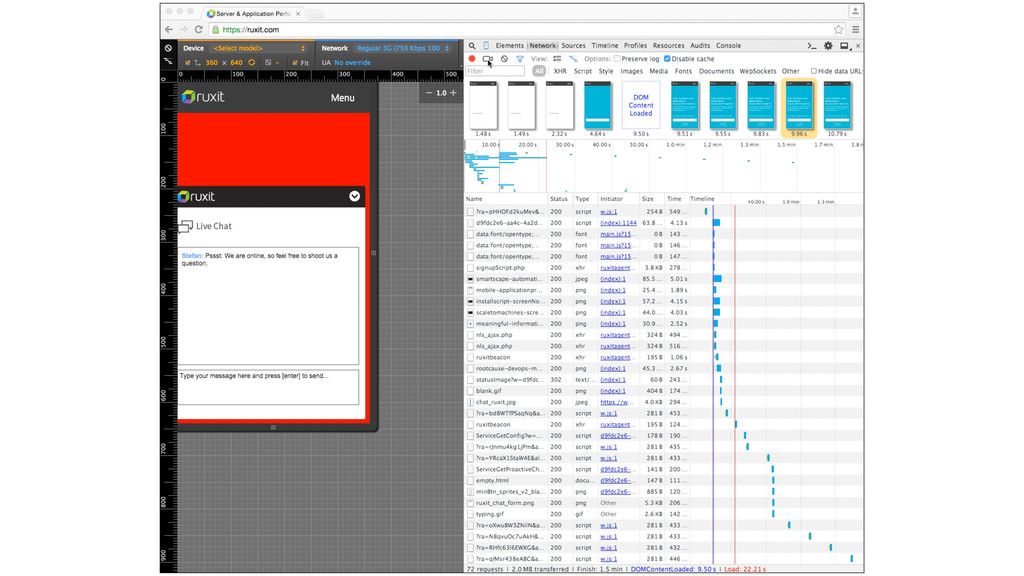
This menu at the top holds 94 product images The
requests alone stall the browser for roughly 14 sec
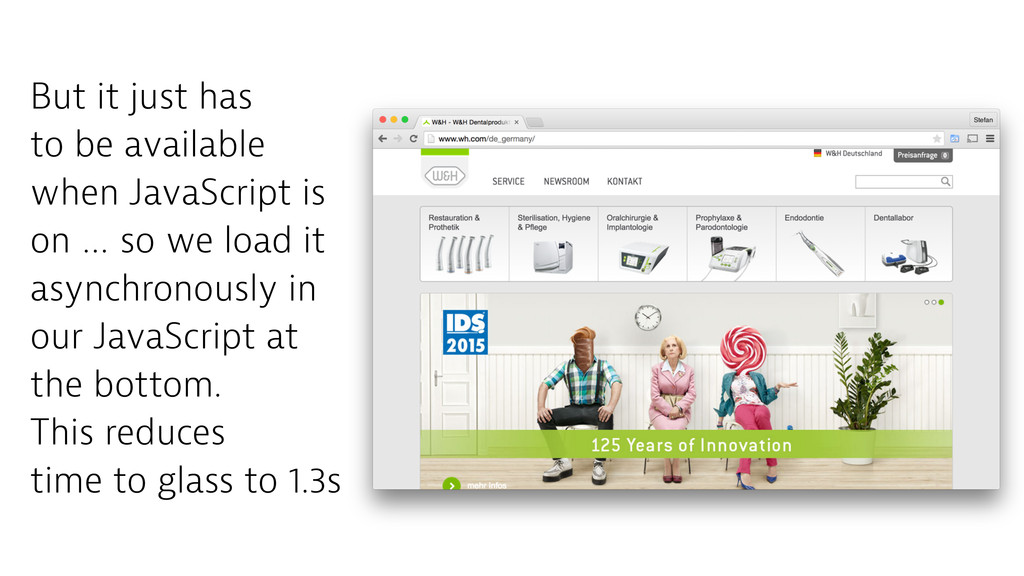
But it just has to be available when JavaScript is
on … so we load it asynchronously in our JavaScript at the bottom. This reduces time to glass to 1.3s
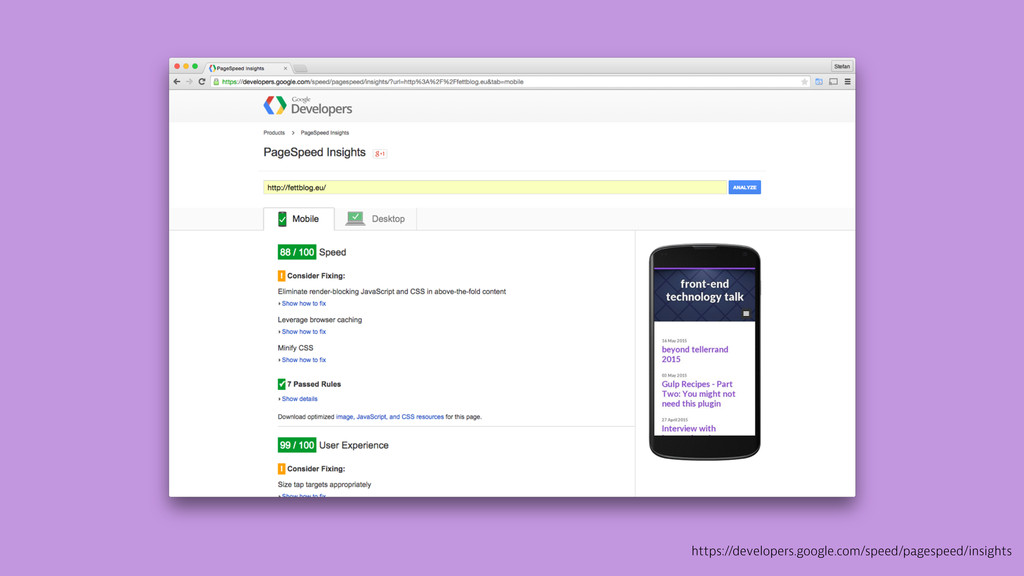
2 Page Speed Score
“Page Speed Score” tells you if you’ve followed a series
of best practices for every component of your website
None
https://developers.google.com/speed/pagespeed/insights
Eliminate render-blocking JS and CSS Optimize images Minify HTML, CSS,
JavaScript
Reduce server response time Leverage browser caching Avoid landing page
redirects Enable compression
None
None
None
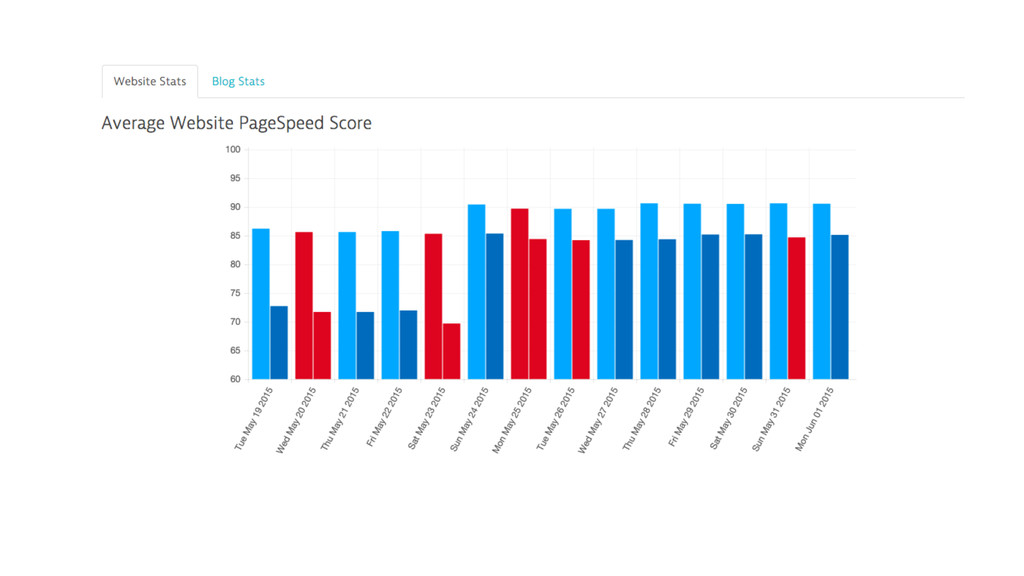
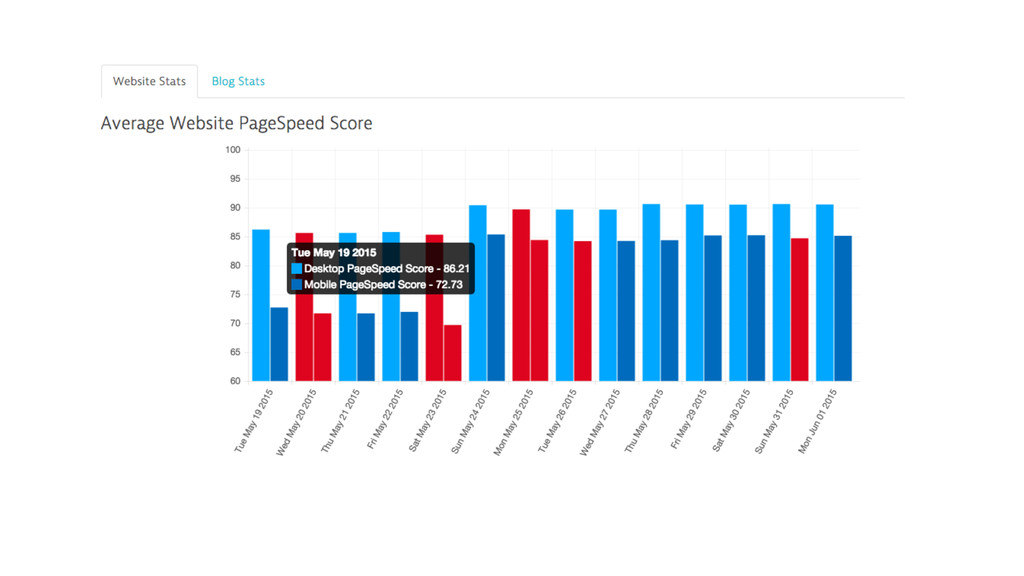
How safe is Page Speed Score?
blog.catchpoint.com/2011/12/27/biggest_misconception_about_google_page_speed/
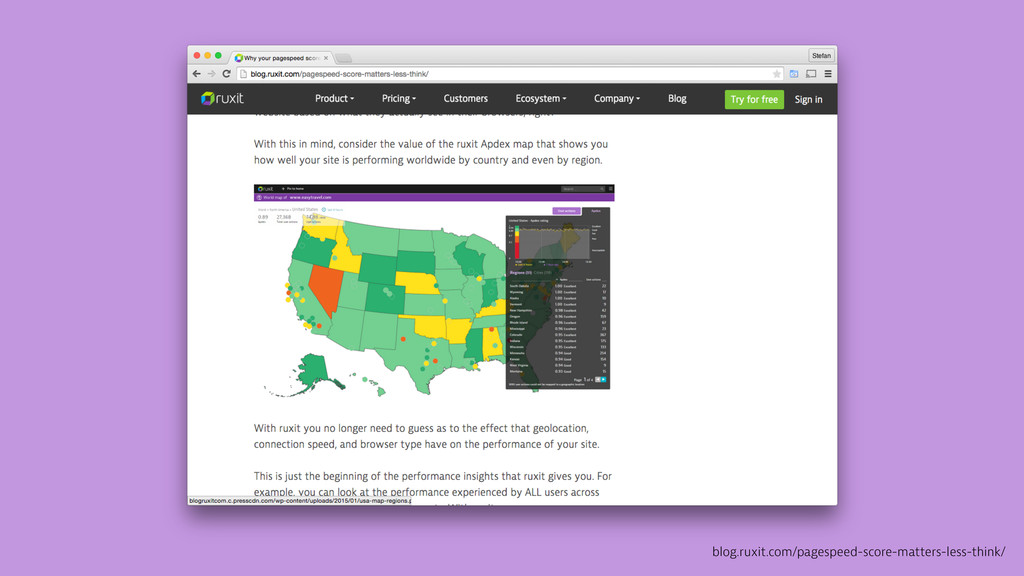
blog.ruxit.com/pagespeed-score-matters-less-think/
http://mobiforge.com/research-analysis/googles-mobile-friendly-test-can-spruce-goose-really-fly
None
None
None
What the …?
Solution: Page Speed Score is a good indicator on your
dev style … but we need more!
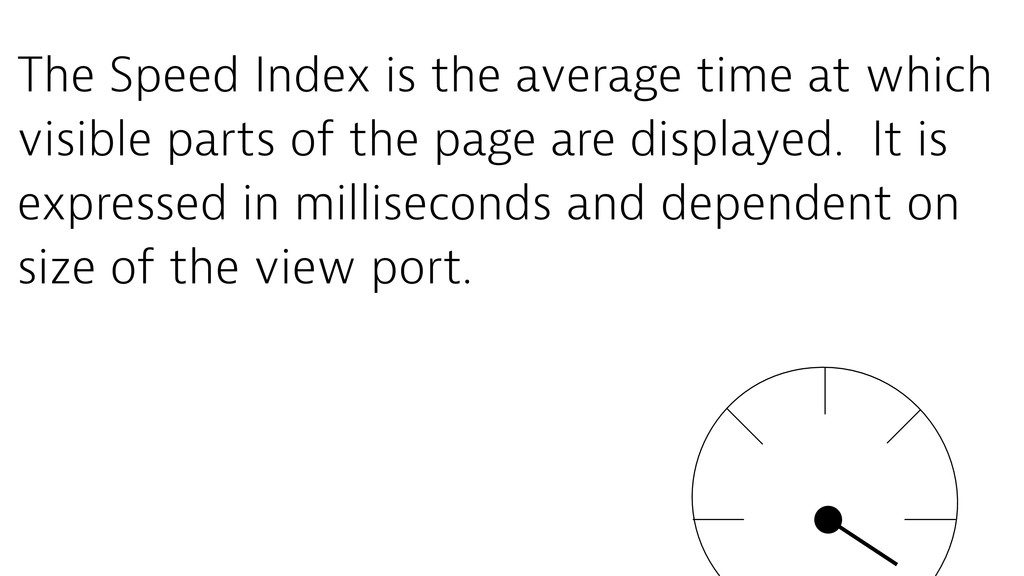
3 Speed Index
The Speed Index is the average time at which visible
parts of the page are displayed. It is expressed in milliseconds and dependent on size of the view port.
∫ 1 - visuallycomplete/100 0 end
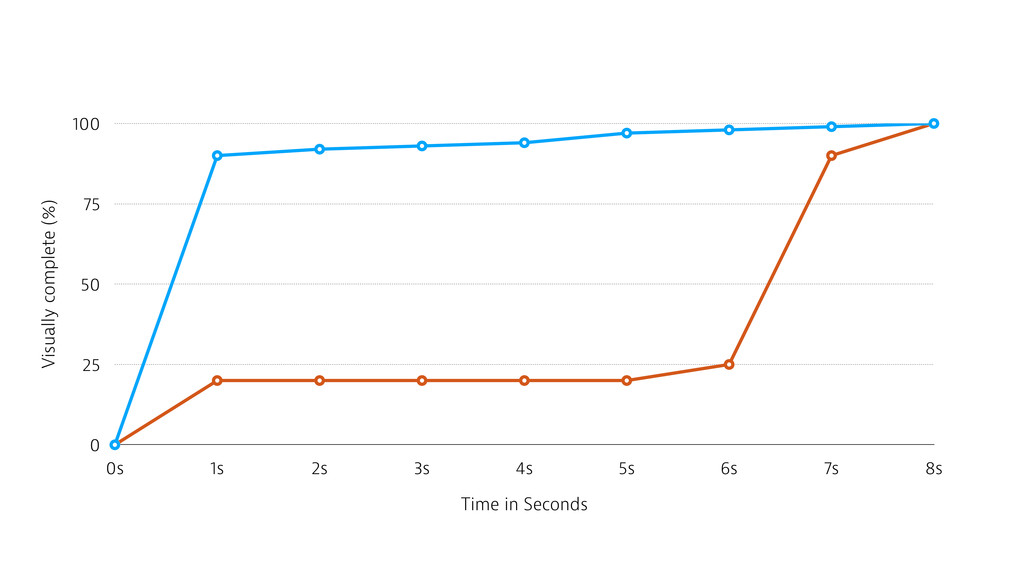
What does this mean?
Visually complete (%) 0 25 50 75 100 Time in
Seconds 0s 1s 2s 3s 4s 5s 6s 7s 8s
Visually complete (%) 0 25 50 75 100 Time in
Seconds 0s 1s 2s 3s 4s 5s 6s 7s 8s
Visually complete (%) 0 25 50 75 100 Time in
Seconds 0s 1s 2s 3s 4s 5s 6s 7s 8s
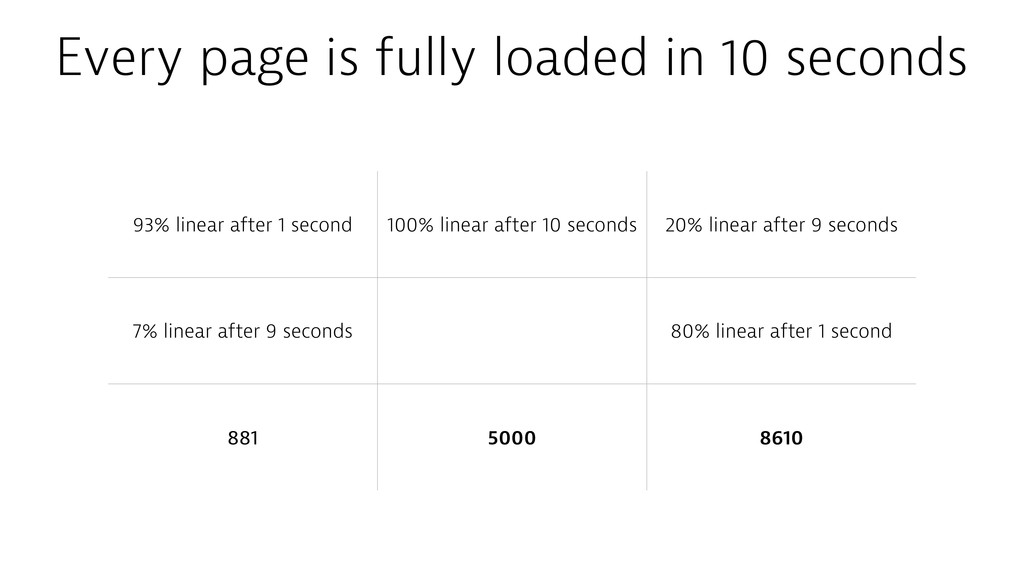
Every page is fully loaded in 10 seconds 93% linear
after 1 second 100% linear after 10 seconds 20% linear after 9 seconds 7% linear after 9 seconds 80% linear after 1 second 881 5000 8610
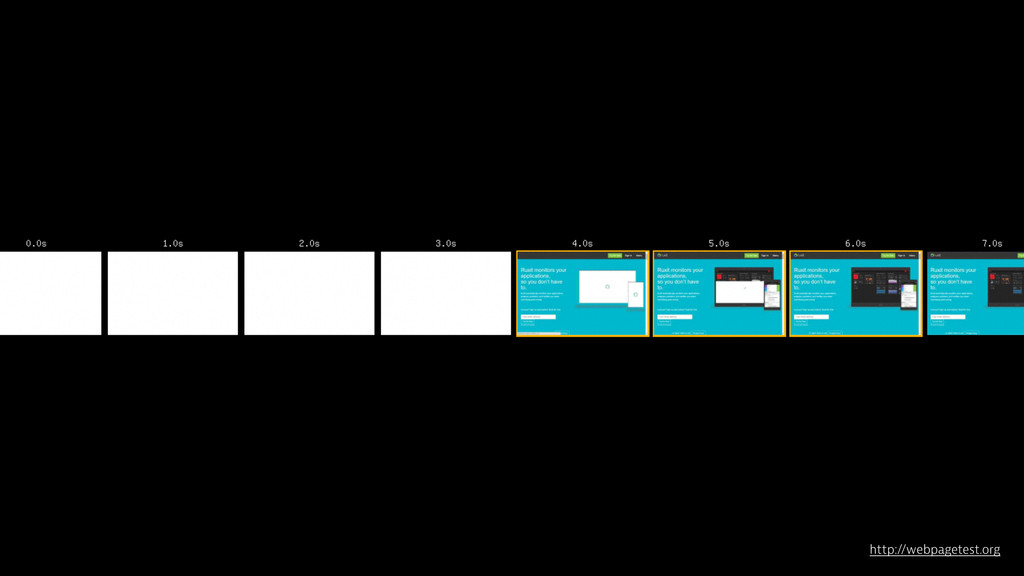
The lower Speed Index: The lower the better
http://webpagetest.org
None
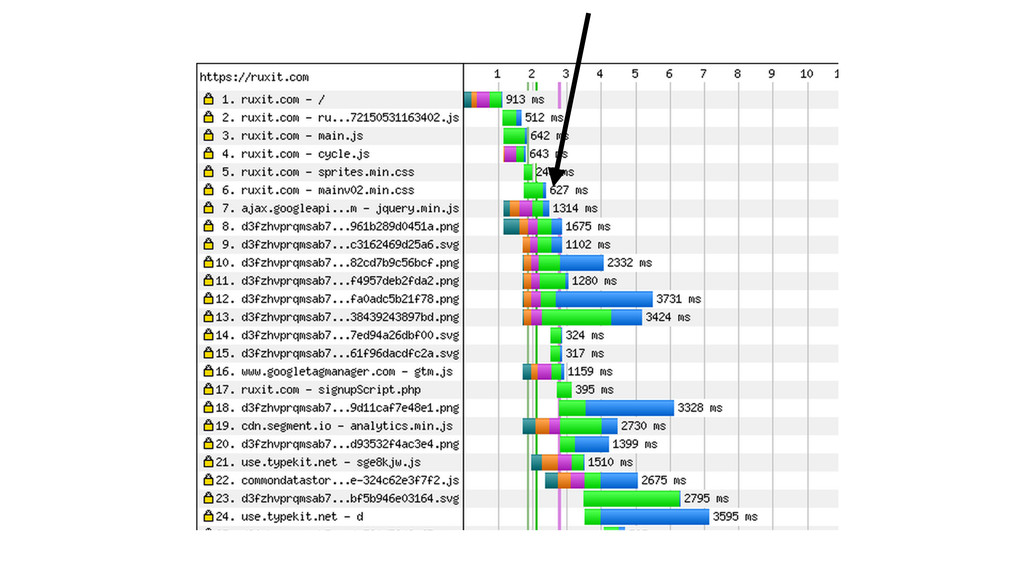
Critical CSS
None
This is where the content is loaded So let’s show
the user everything we’ve got so far
None
CSS is blocking. That means: No content shown until the
whole CSS is loaded
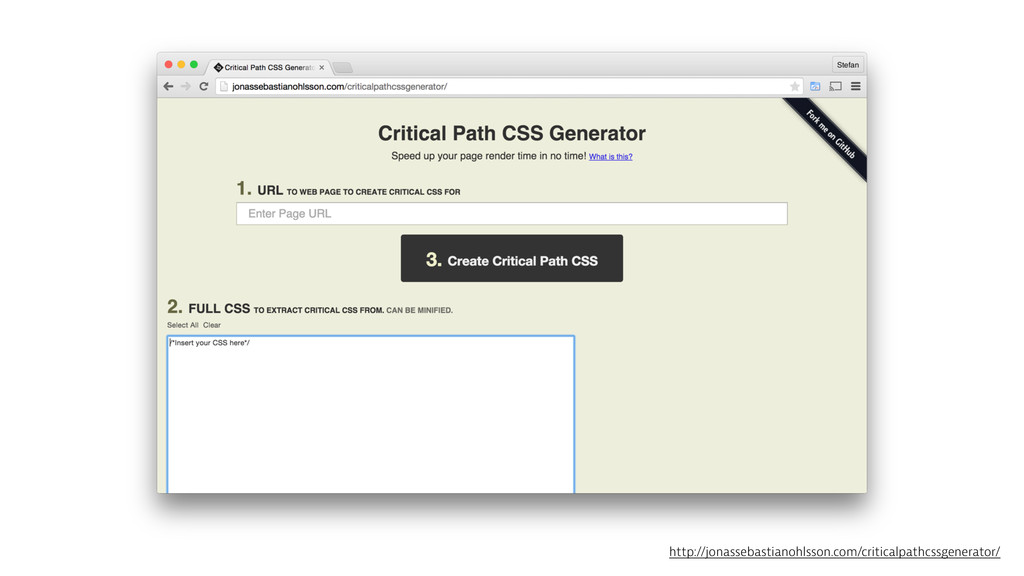
Open up your website at the desired viewport. Look at
the above the fold content.
Open a headless browser to find the CSS for that
content.
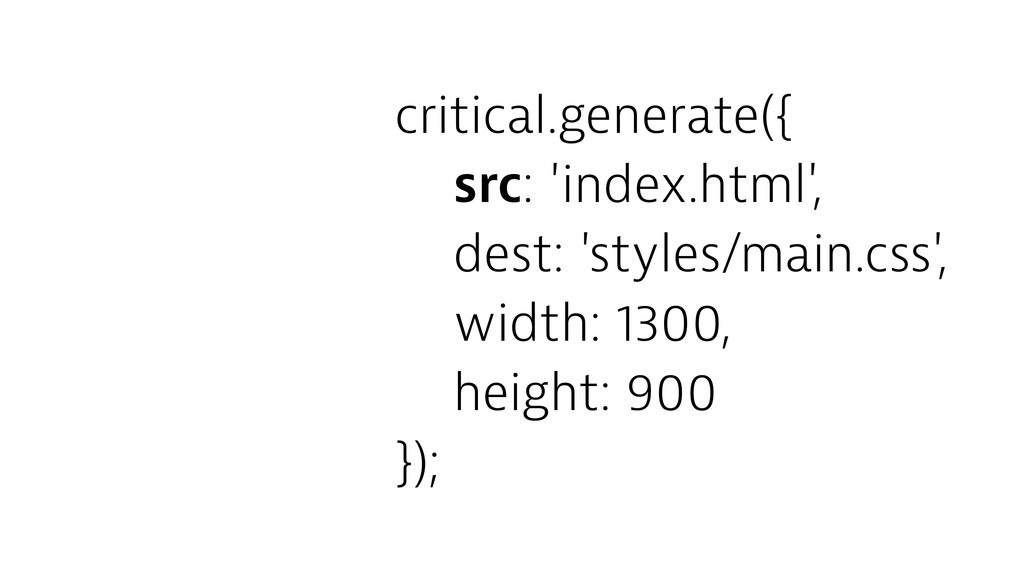
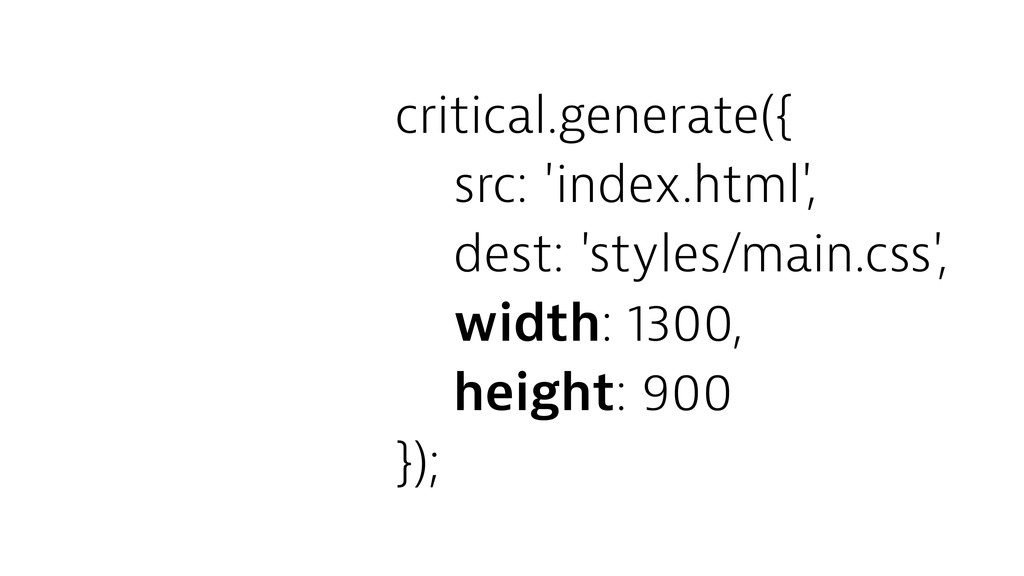
npm install --save-dev critical
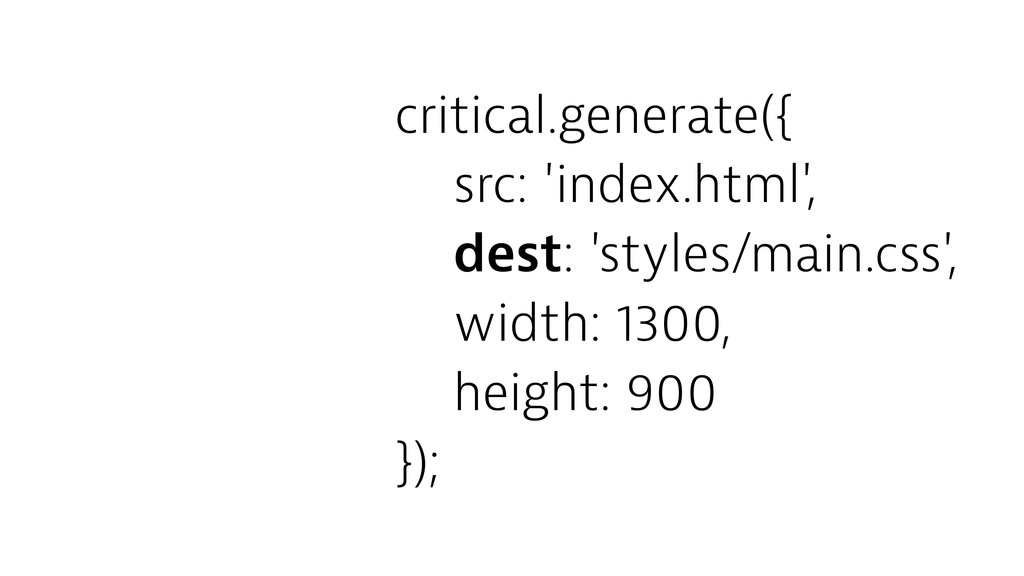
critical.generate({ src: 'index.html', dest: 'styles/main.css', width: 1300, height: 900 });
critical.generate({ src: 'index.html', dest: 'styles/main.css', width: 1300, height: 900 });
critical.generate({ src: 'index.html', dest: 'styles/main.css', width: 1300, height: 900 });
http://jonassebastianohlsson.com/criticalpathcssgenerator/
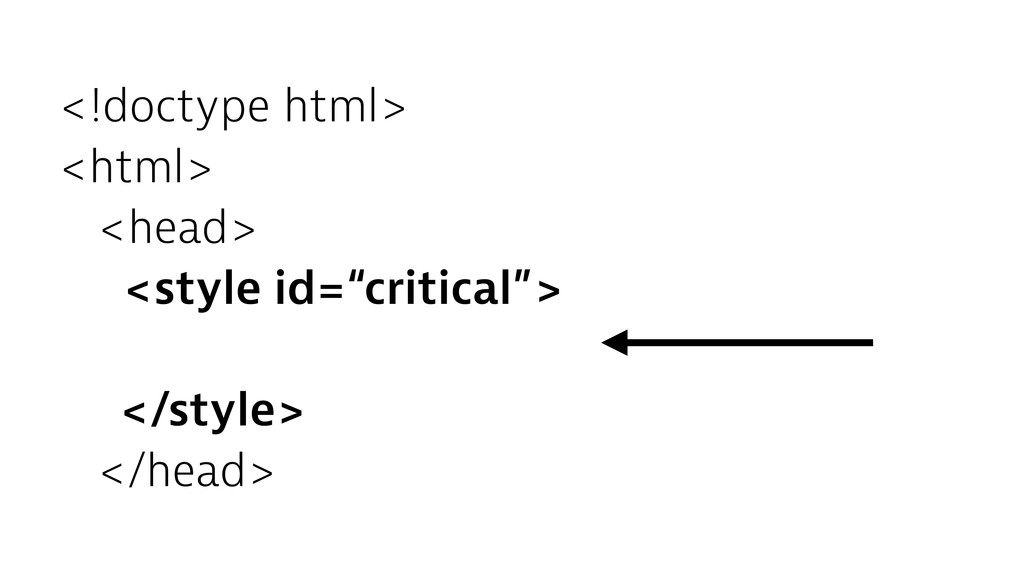
<!doctype html> <html> <head> <style id=“critical”> </style> </head>
<script id=“load-main-css"> var ms=document.createElement(“link"); ms.rel=“stylesheet"; ms.href=“http://path/to/main.min.css”; document.getElementsByTagName(“head”)[0].appendChild(ms); </script>
None
None
One more optimisation
None
What happened?
On loading a new page… why should we (even if
it’s cached) check everything again and again?
Just load the things we need and tell the browser
where we are without loading all the burden
As an enhancement!
if(window.history && history.pushState) { … }
$('body').on('click', '#content a:not([href*=#]):not([href^=http])', function(e) { e.preventDefault(); retrieveContent(this.href); });
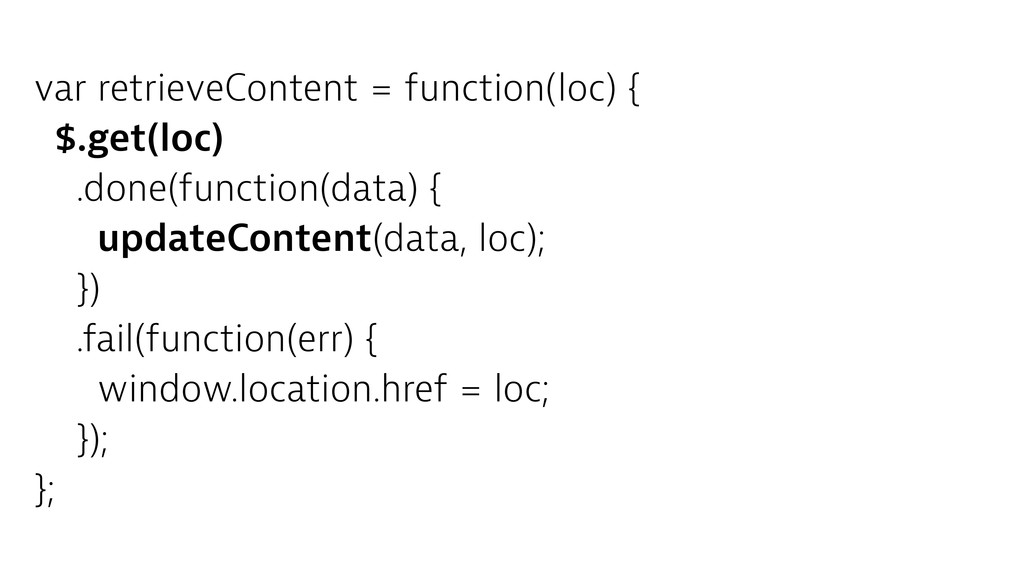
var retrieveContent = function(loc) { $.get(loc) .done(function(data) { updateContent(data, loc);
}) .fail(function(err) { window.location.href = loc; }); };
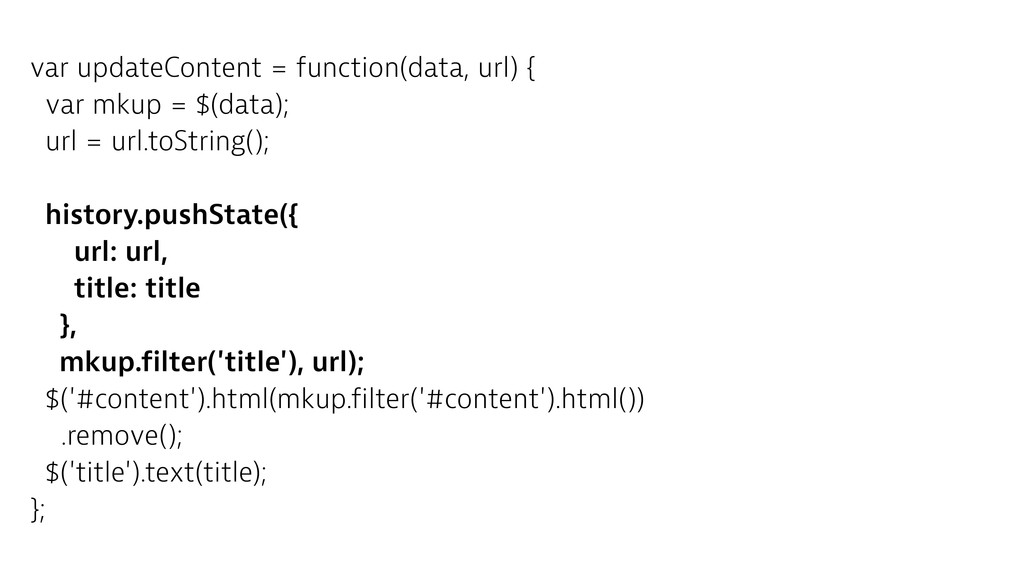
var updateContent = function(data, url) { var mkup = $(data);
url = url.toString(); history.pushState({ url: url, title: title }, mkup.filter('title'), url); $('#content').html(mkup.filter('#content').html()) .remove(); $('title').text(title); };
Speed Index equals regular Speed Index of the site without
JS and CSS
Take it even further…
Do contents change during the period of a session?
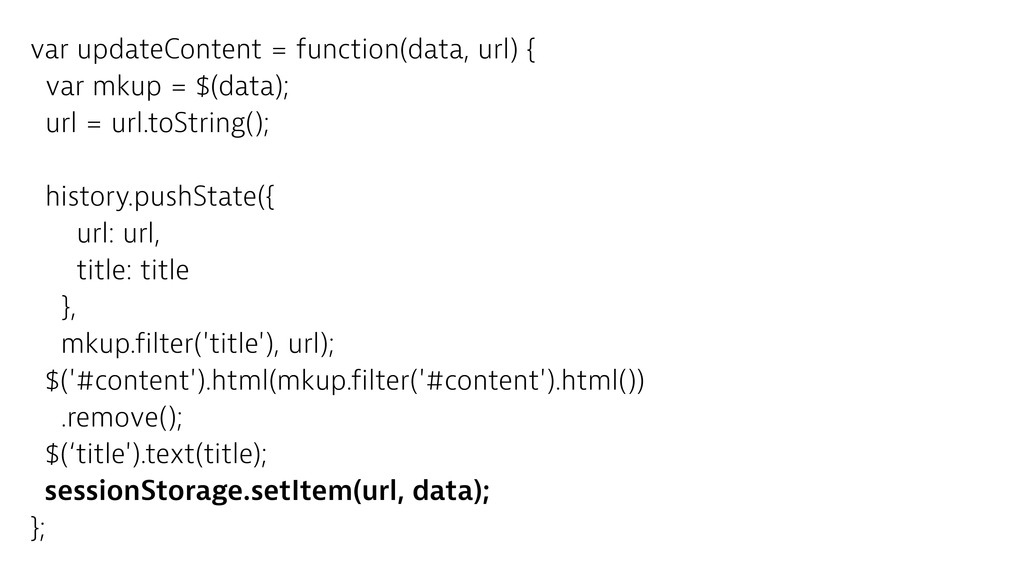
var updateContent = function(data, url) { var mkup = $(data);
url = url.toString(); history.pushState({ url: url, title: title }, mkup.filter('title'), url); $('#content').html(mkup.filter('#content').html()) .remove(); $(‘title').text(title); sessionStorage.setItem(url, data); };
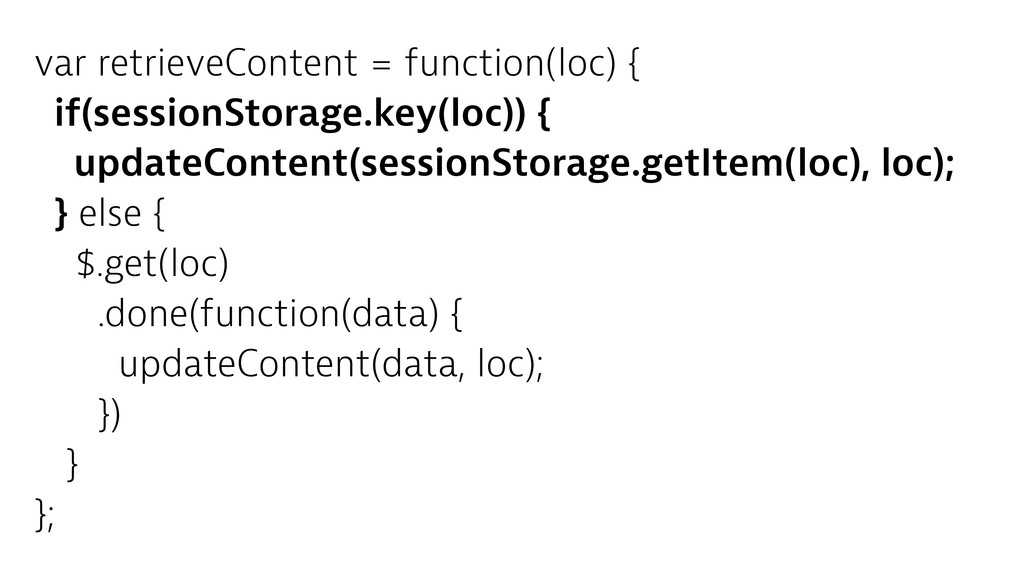
var retrieveContent = function(loc) { if(sessionStorage.key(loc)) { updateContent(sessionStorage.getItem(loc), loc); }
else { $.get(loc) .done(function(data) { updateContent(data, loc); }) } };
Speed Index? Probably 0
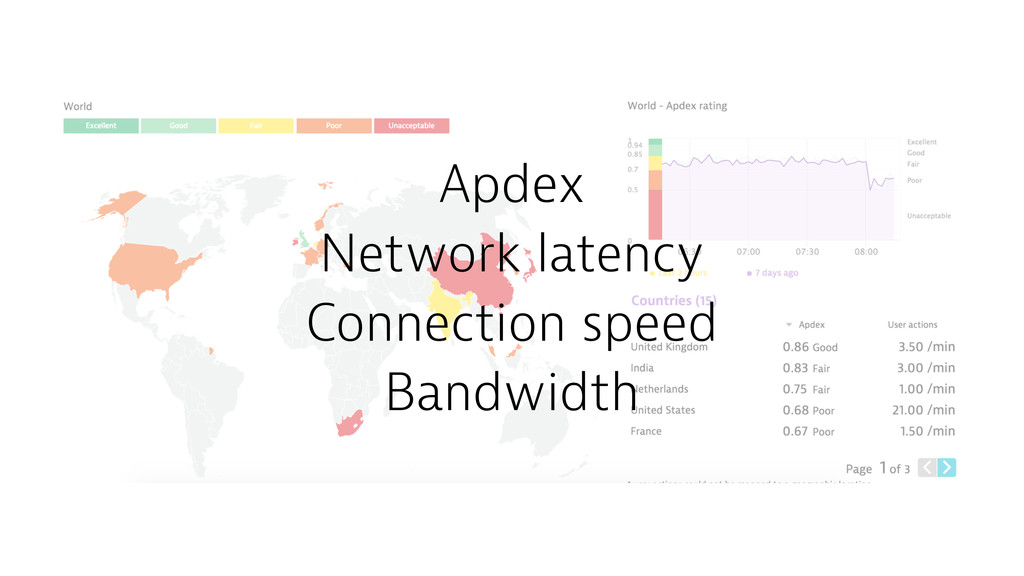
+ What’s more?
Apdex Network latency Connection speed Bandwidth
THX! @ddprrt - fettblog.eu - workingdraft.de
![<script id=“load-main-css"> var ms=document.createElement(“link"); ms.rel=“stylesheet"; ms.href=“http://path/to/main.min.css”; document.getElementsByTagName(“head”)[0].appendChild(ms); </script>](https://files.speakerdeck.com/presentations/141f992e14304d3db39f54a9d5249d81/slide_68.jpg)
![$('body').on('click', '#content a:not([href*=#]):not([href^=http])', function(e) { e.preventDefault(); retrieveContent(this.href); });](https://files.speakerdeck.com/presentations/141f992e14304d3db39f54a9d5249d81/slide_78.jpg)