2015 Market Trend Data Analysis Regional Analysis Mobile game market keeps a rapid increase, with an expected market size of 42.92 billion Yuan in 2015 . Rapid market growth led by demographic dividend is diminishing and mobile game users are steadily growing. In 2015, China’s mobile gamers are expected to reach 386 million. Offline vs. online game is approximately 7:3; role-play and card games are the mainstream in online games. Match 3 and endless runner games are the majority in offline games. IP-based games take up 48.35% in online mobile games; and besides Three kingdom and Westward Journey, animation serves as the biggest IP source. Active Player: 61% players spend less than 30 min per day; 50% gamers play less than 3 times per day. Retention: Role-play games have higher retention rate, card and casual puzzle games have the best user viscosity. Paying Rate: Role-play games has the best performance in paying rate, ARPU and LTV, and shooting games increase most rapidly in paying indicators. Guangdong Province has the most game players; third-tier cities and below enjoy the fastest growth of mobile gamers, however, the number of players in first-tier cities is decreasing. Mobile gamers in first-tier cities make more spending on games than in other cities; gamers in second- tier cities have the highest game frequency and game time; and third-tier cities have large potential.
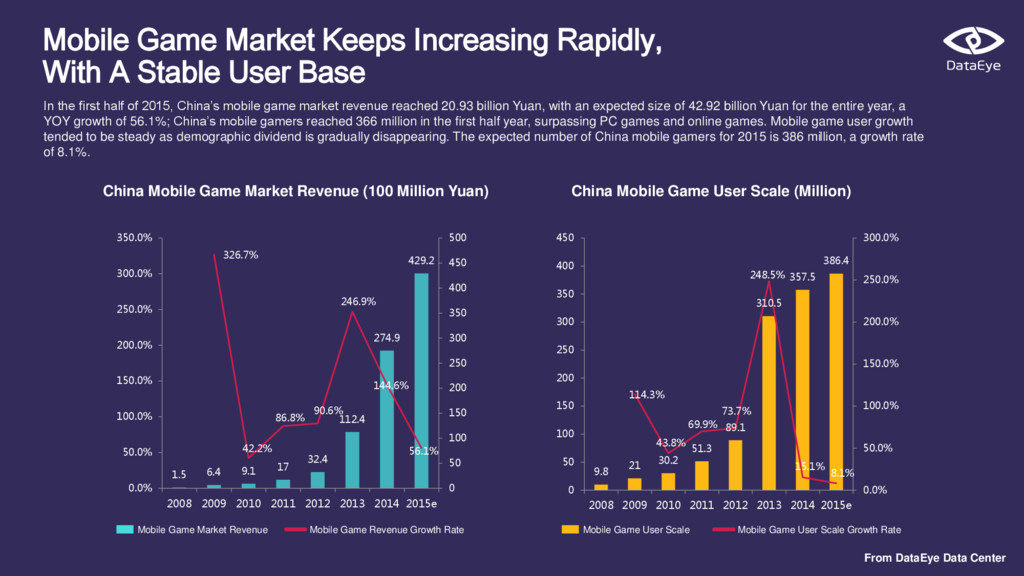
With A Stable User Base In the first half of 2015, China’s mobile game market revenue reached 20.93 billion Yuan, with an expected size of 42.92 billion Yuan for the entire year, a YOY growth of 56.1%; China’s mobile gamers reached 366 million in the first half year, surpassing PC games and online games. Mobile game user growth tended to be steady as demographic dividend is gradually disappearing. The expected number of China mobile gamers for 2015 is 386 million, a growth rate of 8.1%. 1.5 6.4 9.1 17 32.4 112.4 274.9 429.2 326.7% 42.2% 86.8% 90.6% 246.9% 144.6% 56.1% 0 50 100 150 200 250 300 350 400 450 500 0.0% 50.0% 100.0% 150.0% 200.0% 250.0% 300.0% 350.0% 2008 2009 2010 2011 2012 2013 2014 2015e 9.8 21 30.2 51.3 89.1 310.5 357.5 386.4 114.3% 43.8% 69.9% 73.7% 248.5% 15.1% 8.1% 0.0% 50.0% 100.0% 150.0% 200.0% 250.0% 300.0% 0 50 100 150 200 250 300 350 400 450 2008 2009 2010 2011 2012 2013 2014 2015e China Mobile Game Market Revenue (100 Million Yuan) China Mobile Game User Scale (Million) Mobile Game Market Revenue Mobile Game Revenue Growth Rate Mobile Game User Scale Mobile Game User Scale Growth Rate
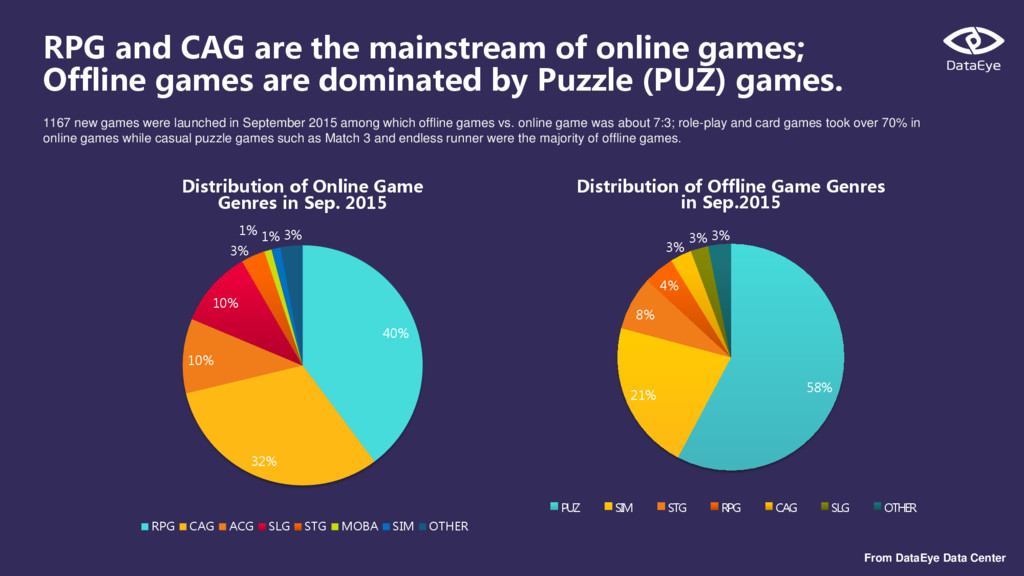
of online games; Offline games are dominated by Puzzle (PUZ) games. 1167 new games were launched in September 2015 among which offline games vs. online game was about 7:3; role-play and card games took over 70% in online games while casual puzzle games such as Match 3 and endless runner were the majority of offline games. 58% 21% 8% 4% 3% 3% 3% Distribution of Offline Game Genres in Sep.2015 PUZ SIM STG RPG CAG SLG OTHER 40% 32% 10% 10% 3% 1% 1% 3% Distribution of Online Game Genres in Sep. 2015 RPG CAG ACG SLG STG MOBA SIM OTHER
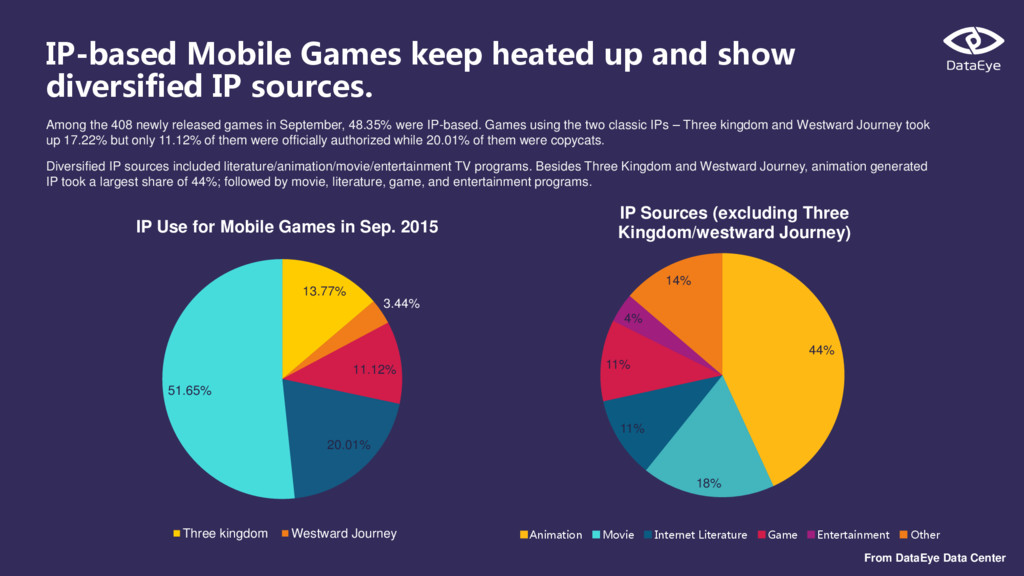
and show diversified IP sources. Among the 408 newly released games in September, 48.35% were IP-based. Games using the two classic IPs – Three kingdom and Westward Journey took up 17.22% but only 11.12% of them were officially authorized while 20.01% of them were copycats. Diversified IP sources included literature/animation/movie/entertainment TV programs. Besides Three Kingdom and Westward Journey, animation generated IP took a largest share of 44%; followed by movie, literature, game, and entertainment programs. 44% 18% 11% 11% 4% 14% IP Sources (excluding Three Kingdom/westward Journey) 13.77% 3.44% 11.12% 20.01% 51.65% IP Use for Mobile Games in Sep. 2015 Three kingdom Westward Journey Animation Movie Internet Literature Game Entertainment Other
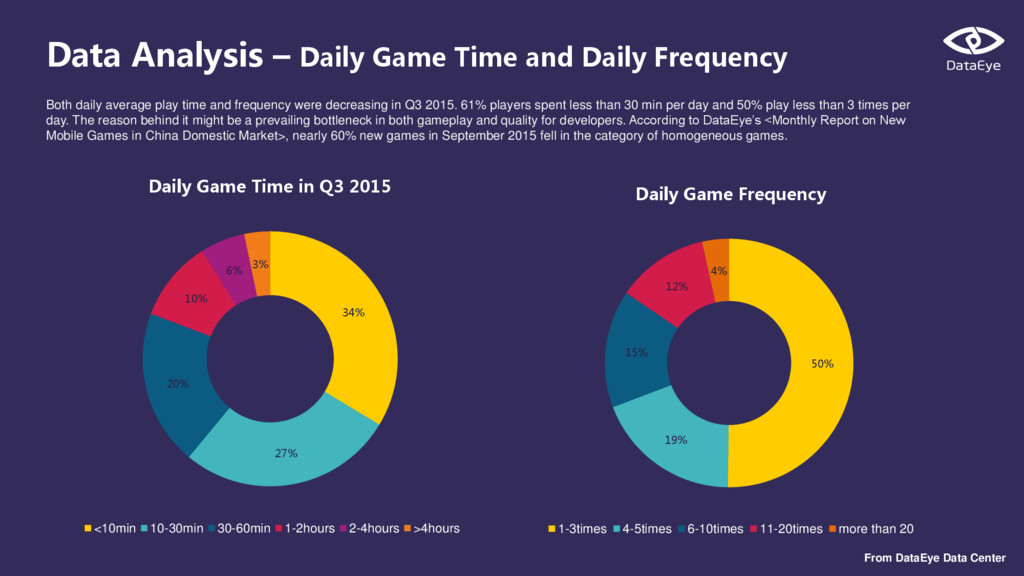
and Daily Frequency Both daily average play time and frequency were decreasing in Q3 2015. 61% players spent less than 30 min per day and 50% play less than 3 times per day. The reason behind it might be a prevailing bottleneck in both gameplay and quality for developers. According to DataEye’s <Monthly Report on New Mobile Games in China Domestic Market>, nearly 60% new games in September 2015 fell in the category of homogeneous games. 34% 27% 20% 10% 6% 3% Daily Game Time in Q3 2015 <10min 10-30min 30-60min 1-2hours 2-4hours >4hours 50% 19% 15% 12% 4% Daily Game Frequency 1-3times 4-5times 6-10times 11-20times more than 20
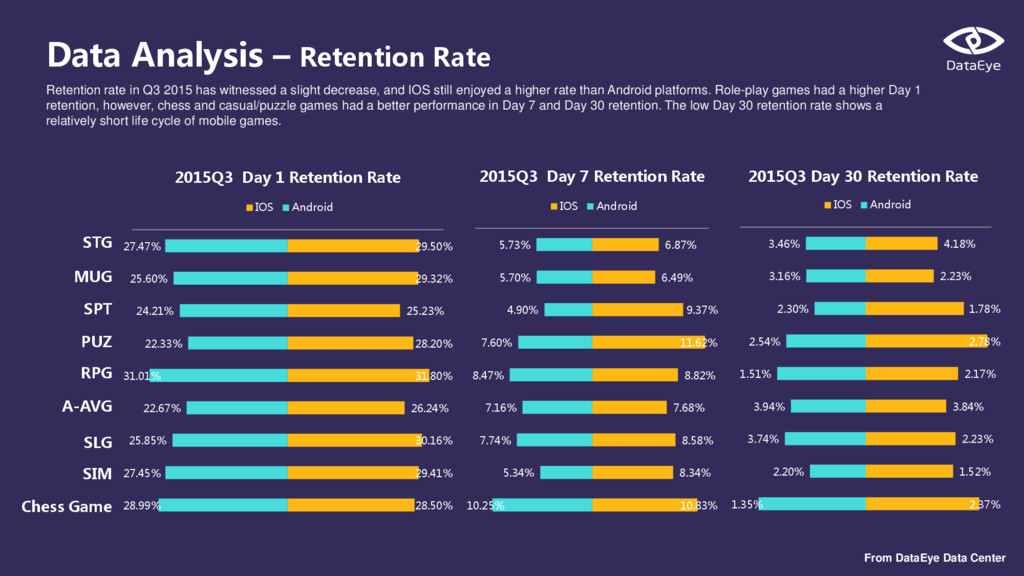
rate in Q3 2015 has witnessed a slight decrease, and IOS still enjoyed a higher rate than Android platforms. Role-play games had a higher Day 1 retention, however, chess and casual/puzzle games had a better performance in Day 7 and Day 30 retention. The low Day 30 retention rate shows a relatively short life cycle of mobile games. STG MUG SPT PUZ RPG A-AVG SLG SIM Chess Game 28.50% 29.41% 30.16% 26.24% 31.80% 28.20% 25.23% 29.32% 29.50% 28.99% 27.45% 25.85% 22.67% 31.01% 22.33% 24.21% 25.60% 27.47% 2015Q3 Day 1 Retention Rate IOS Android 10.83% 8.34% 8.58% 7.68% 8.82% 11.62% 9.37% 6.49% 6.87% 10.25% 5.34% 7.74% 7.16% 8.47% 7.60% 4.90% 5.70% 5.73% IOS Android 2015Q3 Day 7 Retention Rate 2.37% 1.52% 2.23% 3.84% 2.17% 2.78% 1.78% 2.23% 4.18% 1.35% 2.20% 3.74% 3.94% 1.51% 2.54% 2.30% 3.16% 3.46% IOS Android 2015Q3 Day 30 Retention Rate
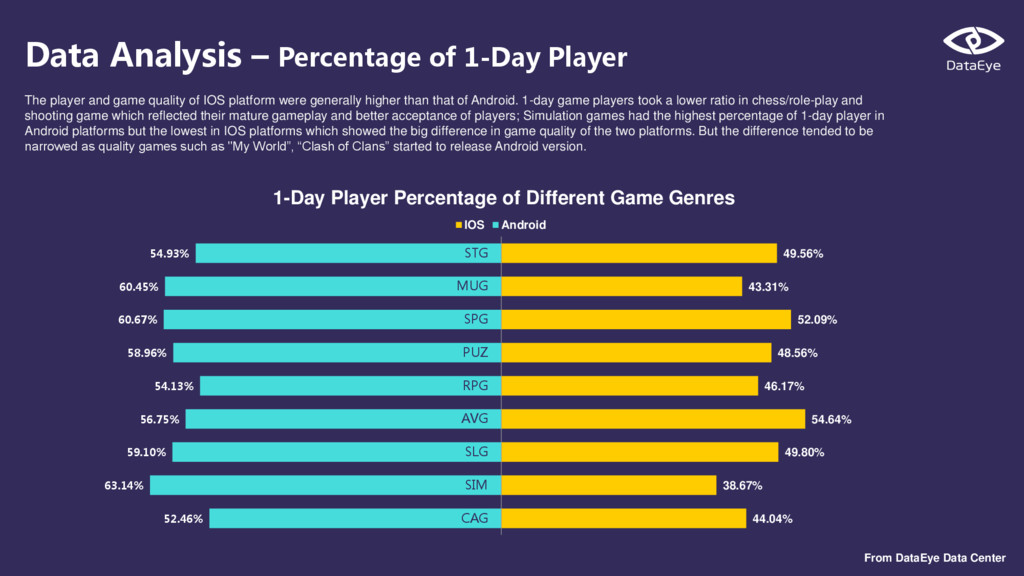
Player The player and game quality of IOS platform were generally higher than that of Android. 1-day game players took a lower ratio in chess/role-play and shooting game which reflected their mature gameplay and better acceptance of players; Simulation games had the highest percentage of 1-day player in Android platforms but the lowest in IOS platforms which showed the big difference in game quality of the two platforms. But the difference tended to be narrowed as quality games such as "My World”, “Clash of Clans” started to release Android version. 44.04% 38.67% 49.80% 54.64% 46.17% 48.56% 52.09% 43.31% 49.56% 52.46% 63.14% 59.10% 56.75% 54.13% 58.96% 60.67% 60.45% 54.93% CAG SIM SLG AVG RPG PUZ SPG MUG STG 1-Day Player Percentage of Different Game Genres IOS Android
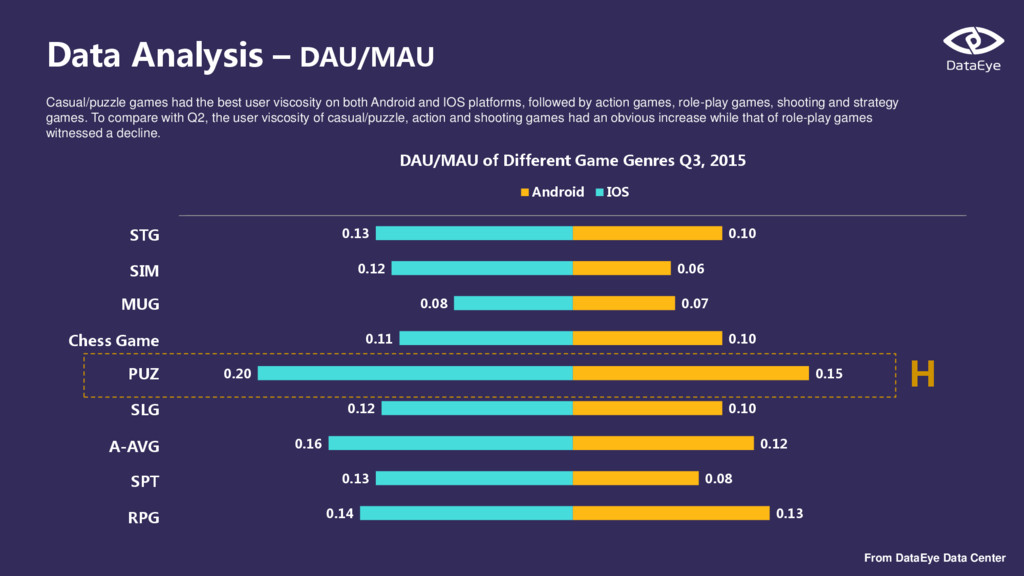
had the best user viscosity on both Android and IOS platforms, followed by action games, role-play games, shooting and strategy games. To compare with Q2, the user viscosity of casual/puzzle, action and shooting games had an obvious increase while that of role-play games witnessed a decline. STG SIM MUG Chess Game PUZ SLG A-AVG SPT RPG 0.13 0.08 0.12 0.10 0.15 0.10 0.07 0.06 0.10 0.14 0.13 0.16 0.12 0.20 0.11 0.08 0.12 0.13 DAU/MAU of Different Game Genres Q3, 2015 Android IOS H
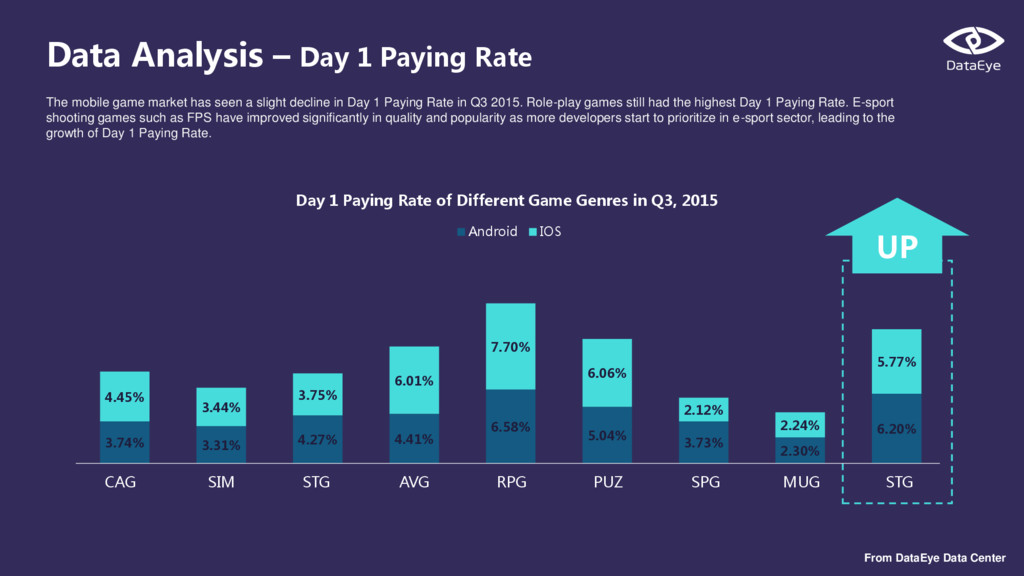
Rate The mobile game market has seen a slight decline in Day 1 Paying Rate in Q3 2015. Role-play games still had the highest Day 1 Paying Rate. E-sport shooting games such as FPS have improved significantly in quality and popularity as more developers start to prioritize in e-sport sector, leading to the growth of Day 1 Paying Rate. 3.74% 3.31% 4.27% 4.41% 6.58% 5.04% 3.73% 2.30% 6.20% 4.45% 3.44% 3.75% 6.01% 7.70% 6.06% 2.12% 2.24% 5.77% Day 1 Paying Rate of Different Game Genres in Q3, 2015 Android IOS UP CAG SIM STG AVG RPG PUZ SPG MUG STG
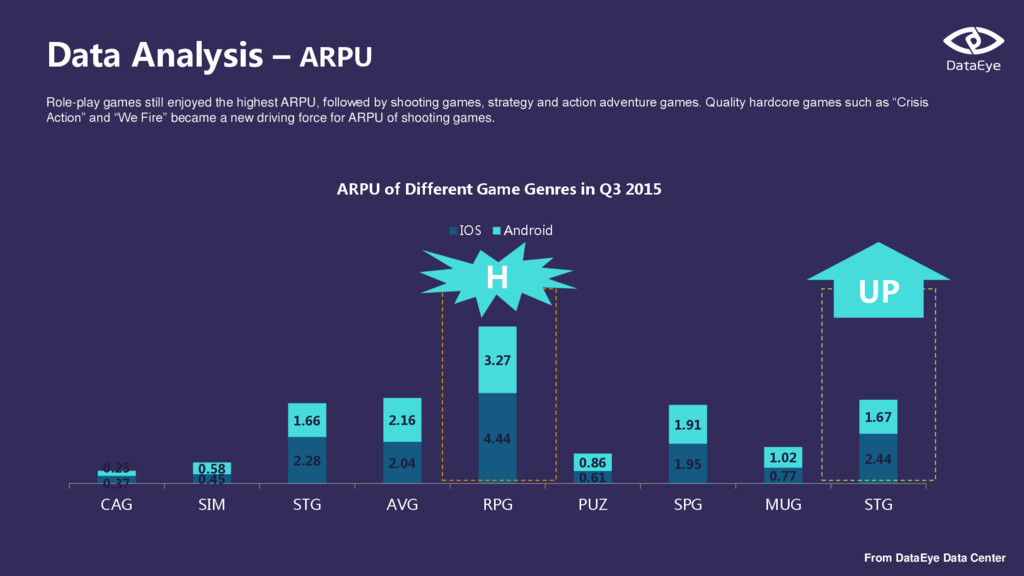
still enjoyed the highest ARPU, followed by shooting games, strategy and action adventure games. Quality hardcore games such as “Crisis Action” and “We Fire” became a new driving force for ARPU of shooting games. 0.37 0.45 2.28 2.04 4.44 0.61 1.95 0.77 2.44 0.25 0.58 1.66 2.16 3.27 0.86 1.91 1.02 1.67 CAG SIM STG AVG RPG PUZ SPG MUG STG IOS Android ARPU of Different Game Genres in Q3 2015 UP H
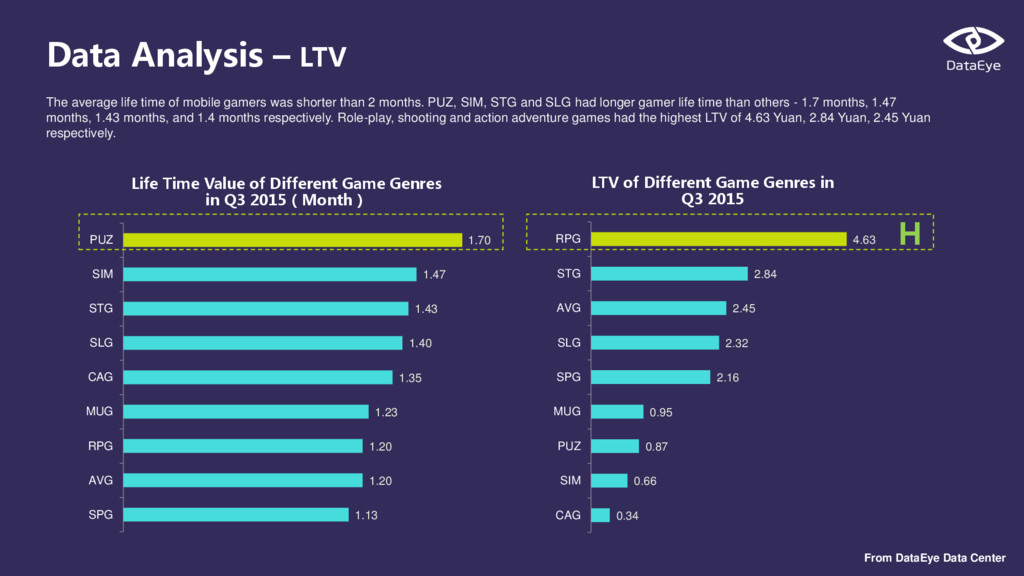
1.43 1.47 1.70 SPG AVG RPG MUG CAG SLG STG SIM PUZ Life Time Value of Different Game Genres in Q3 2015(Month) Data Analysis – LTV The average life time of mobile gamers was shorter than 2 months. PUZ, SIM, STG and SLG had longer gamer life time than others - 1.7 months, 1.47 months, 1.43 months, and 1.4 months respectively. Role-play, shooting and action adventure games had the highest LTV of 4.63 Yuan, 2.84 Yuan, 2.45 Yuan respectively. 0.34 0.66 0.87 0.95 2.16 2.32 2.45 2.84 4.63 CAG SIM PUZ MUG SPG SLG AVG STG RPG LTV of Different Game Genres in Q3 2015 H
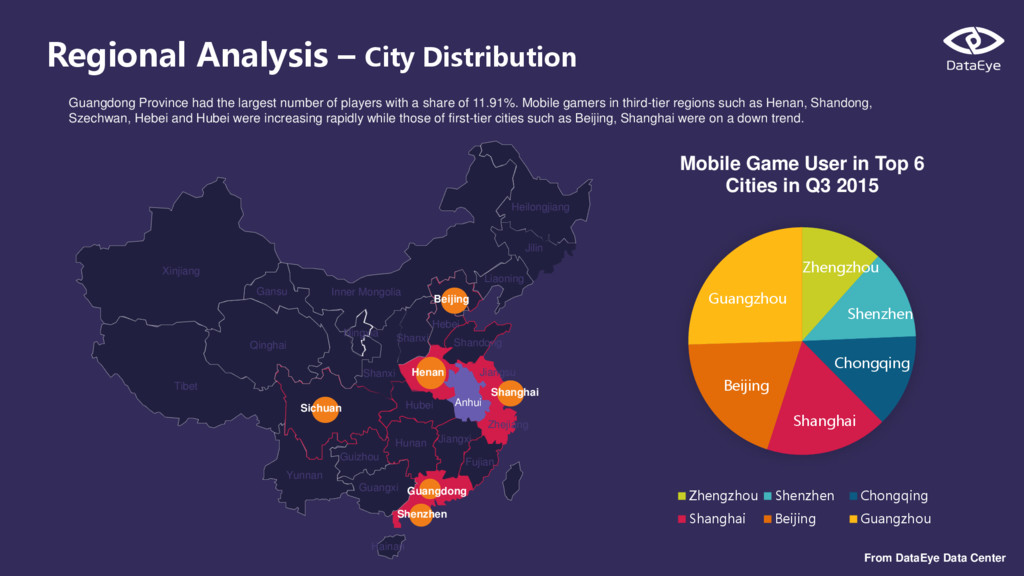
Province had the largest number of players with a share of 11.91%. Mobile gamers in third-tier regions such as Henan, Shandong, Szechwan, Hebei and Hubei were increasing rapidly while those of first-tier cities such as Beijing, Shanghai were on a down trend. Zhengzhou Shenzhen Chongqing Shanghai Beijing Guangzhou Mobile Game User in Top 6 Cities in Q3 2015 Zhengzhou Shenzhen Chongqing Shanghai Beijing Guangzhou Hainan Heilongjiang Jilin Liaoning Hebei Shandong Fujian Jiangxi Anhui Hubei Hunan Guangxi Shanxi Inner Mongolia Shanxi Ningxia Gansu Qinghai Guizhou Yunnan Tibet Xinjiang Jiangsu Zhejiang Beijing Shanghai Henan Guangdong Shenzhen Sichuan
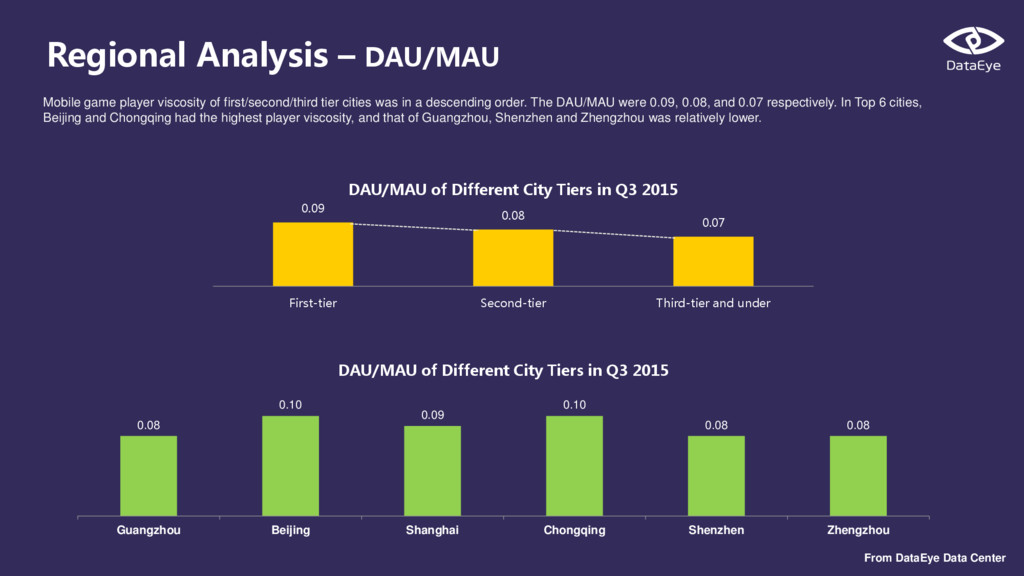
player viscosity of first/second/third tier cities was in a descending order. The DAU/MAU were 0.09, 0.08, and 0.07 respectively. In Top 6 cities, Beijing and Chongqing had the highest player viscosity, and that of Guangzhou, Shenzhen and Zhengzhou was relatively lower. 0.09 0.08 0.07 First-tier Second-tier Third-tier and under DAU/MAU of Different City Tiers in Q3 2015 0.08 0.10 0.09 0.10 0.08 0.08 Guangzhou Beijing Shanghai Chongqing Shenzhen Zhengzhou DAU/MAU of Different City Tiers in Q3 2015
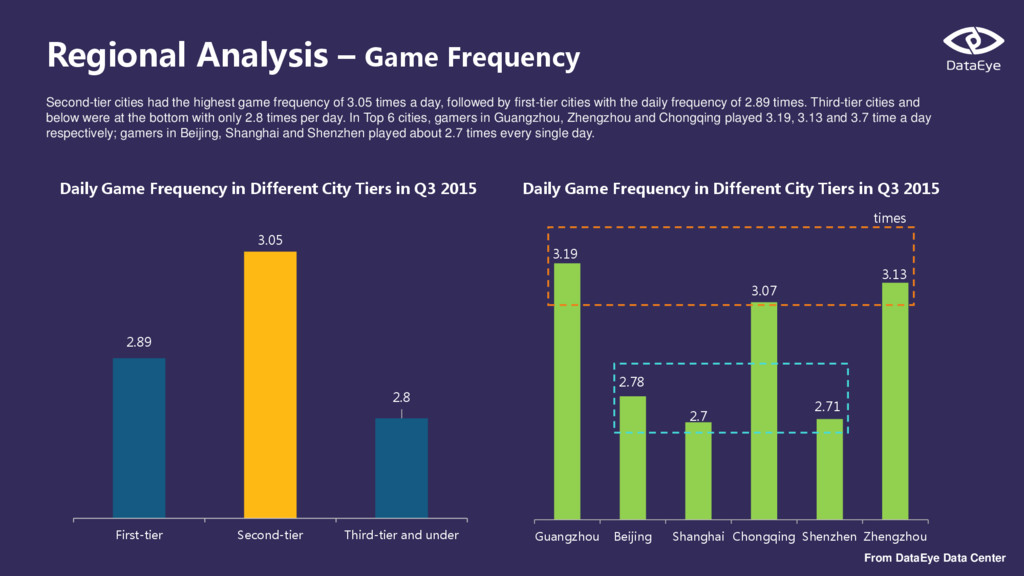
Guangzhou Beijing Shanghai Chongqing Shenzhen Zhengzhou Regional Analysis – Game Frequency Second-tier cities had the highest game frequency of 3.05 times a day, followed by first-tier cities with the daily frequency of 2.89 times. Third-tier cities and below were at the bottom with only 2.8 times per day. In Top 6 cities, gamers in Guangzhou, Zhengzhou and Chongqing played 3.19, 3.13 and 3.7 time a day respectively; gamers in Beijing, Shanghai and Shenzhen played about 2.7 times every single day. times 2.89 3.05 2.8 First-tier Second-tier Third-tier and under Daily Game Frequency in Different City Tiers in Q3 2015 Daily Game Frequency in Different City Tiers in Q3 2015
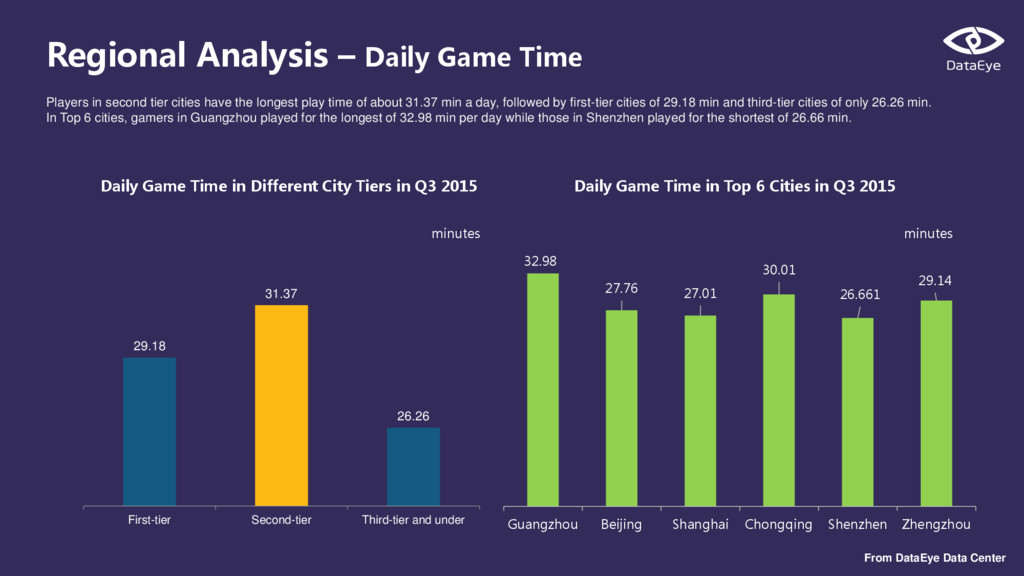
Players in second tier cities have the longest play time of about 31.37 min a day, followed by first-tier cities of 29.18 min and third-tier cities of only 26.26 min. In Top 6 cities, gamers in Guangzhou played for the longest of 32.98 min per day while those in Shenzhen played for the shortest of 26.66 min. 29.18 31.37 26.26 First-tier Second-tier Third-tier and under minutes 32.98 27.76 27.01 30.01 26.661 29.14 Guangzhou Beijing Shanghai Chongqing Shenzhen Zhengzhou Daily Game Time in Top 6 Cities in Q3 2015 minutes Daily Game Time in Different City Tiers in Q3 2015
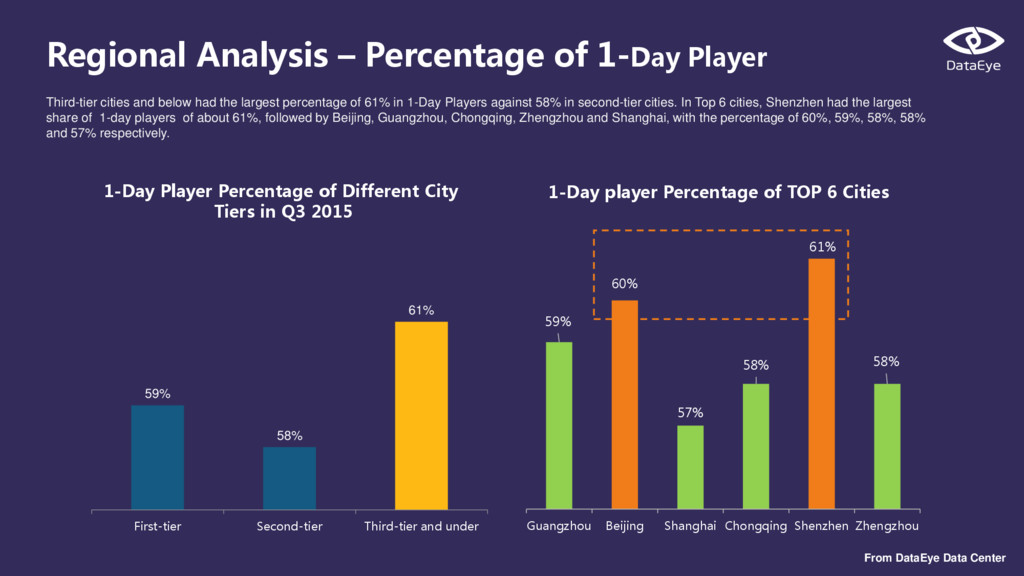
Guangzhou Beijing Shanghai Chongqing Shenzhen Zhengzhou Regional Analysis – Percentage of 1-Day Player Third-tier cities and below had the largest percentage of 61% in 1-Day Players against 58% in second-tier cities. In Top 6 cities, Shenzhen had the largest share of 1-day players of about 61%, followed by Beijing, Guangzhou, Chongqing, Zhengzhou and Shanghai, with the percentage of 60%, 59%, 58%, 58% and 57% respectively. 59% 58% 61% First-tier Second-tier Third-tier and under 1-Day player Percentage of TOP 6 Cities 1-Day Player Percentage of Different City Tiers in Q3 2015
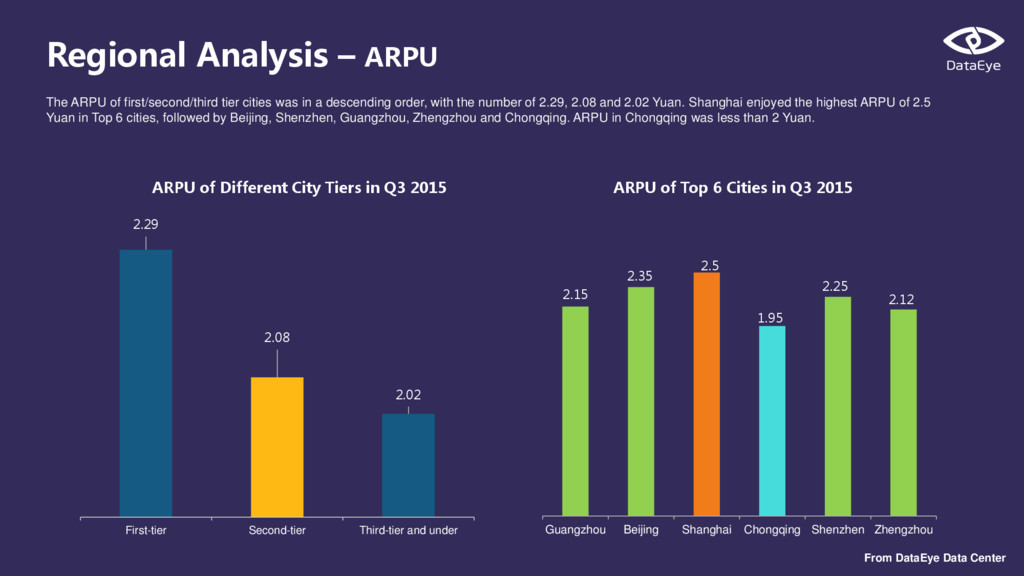
of first/second/third tier cities was in a descending order, with the number of 2.29, 2.08 and 2.02 Yuan. Shanghai enjoyed the highest ARPU of 2.5 Yuan in Top 6 cities, followed by Beijing, Shenzhen, Guangzhou, Zhengzhou and Chongqing. ARPU in Chongqing was less than 2 Yuan. 2.29 2.08 2.02 First-tier Second-tier Third-tier and under ARPU of Different City Tiers in Q3 2015 2.15 2.35 2.5 1.95 2.25 2.12 Guangzhou Beijing Shanghai Chongqing Shenzhen Zhengzhou ARPU of Top 6 Cities in Q3 2015
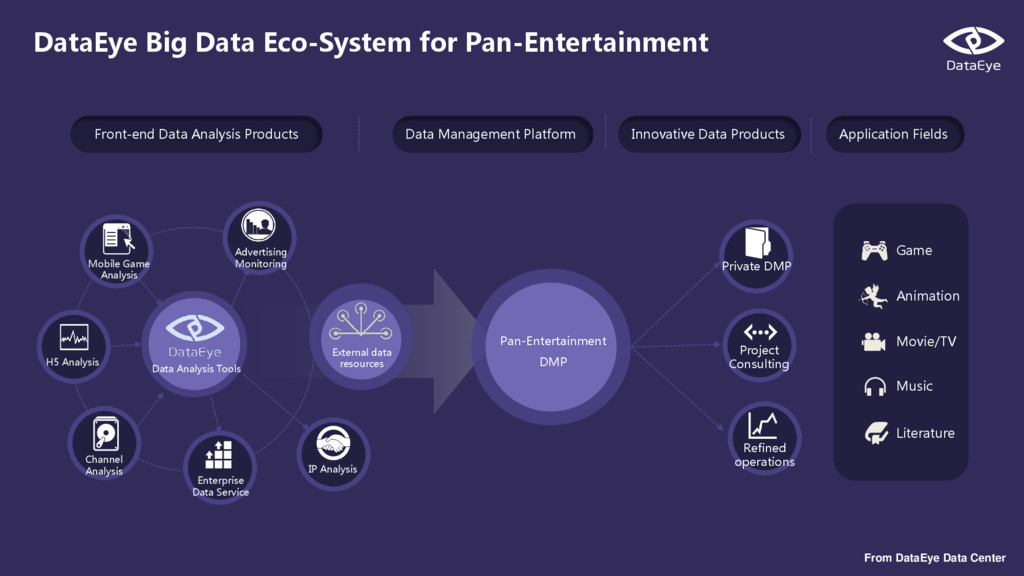
External data resources H5 Analysis Mobile Game Analysis Enterprise Data Service IP Analysis Advertising Monitoring Channel Analysis Data Analysis Tools Pan-Entertainment DMP Private DMP Project Consulting Refined operations Front-end Data Analysis Products Data Management Platform Innovative Data Products Application Fields Game Animation Movie/TV Music Literature
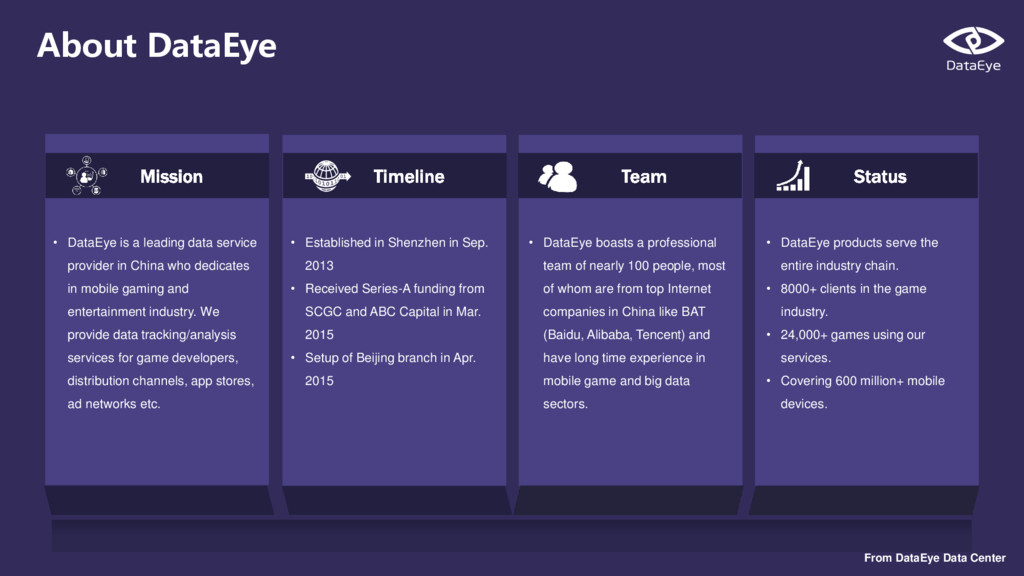
leading data service provider in China who dedicates in mobile gaming and entertainment industry. We provide data tracking/analysis services for game developers, distribution channels, app stores, ad networks etc. • Established in Shenzhen in Sep. 2013 • Received Series-A funding from SCGC and ABC Capital in Mar. 2015 • Setup of Beijing branch in Apr. 2015 • DataEye boasts a professional team of nearly 100 people, most of whom are from top Internet companies in China like BAT (Baidu, Alibaba, Tencent) and have long time experience in mobile game and big data sectors. • DataEye products serve the entire industry chain. • 8000+ clients in the game industry. • 24,000+ games using our services. • Covering 600 million+ mobile devices.