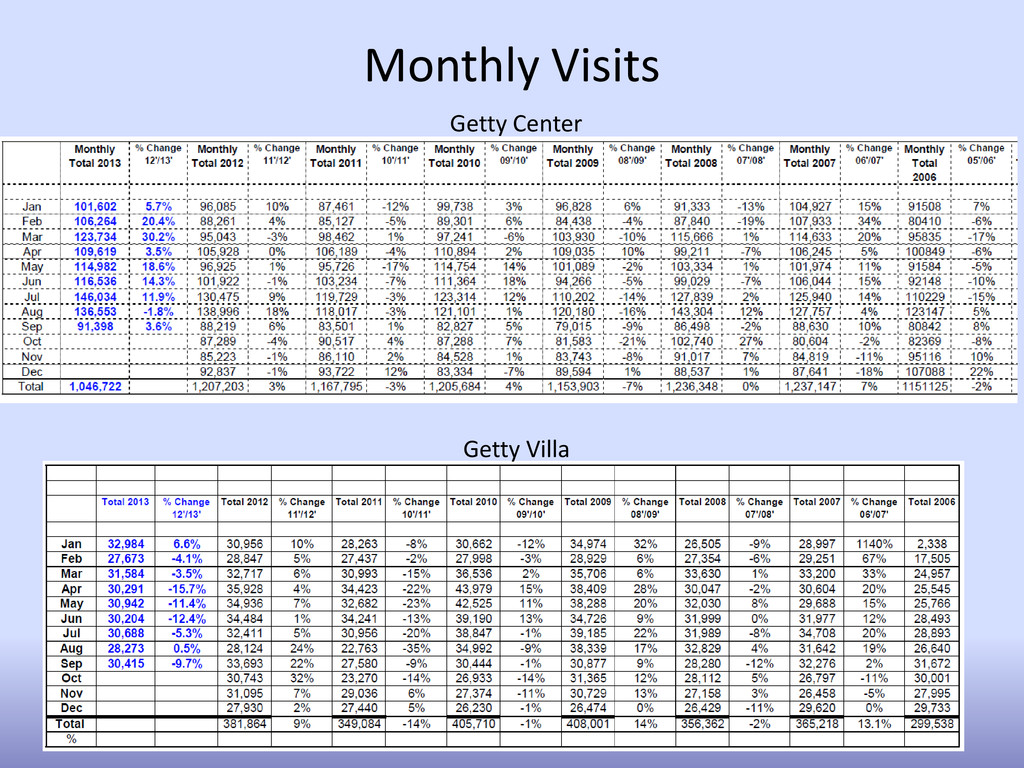
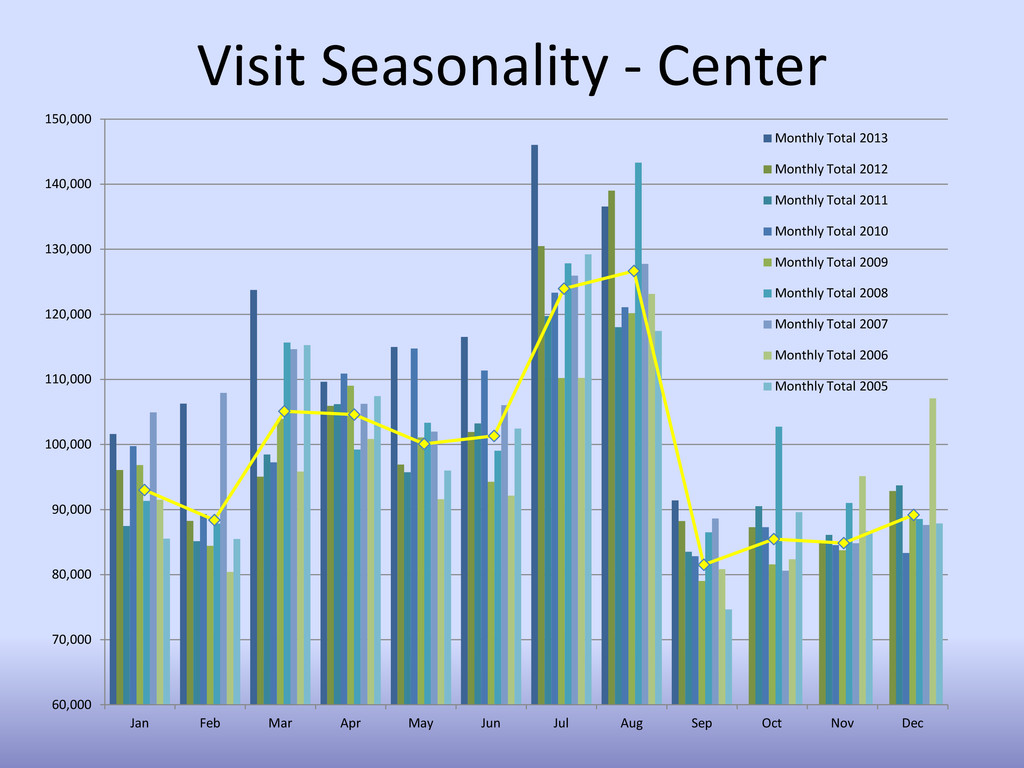
120,000 130,000 140,000 150,000 Jan Feb Mar Apr May Jun Jul Aug Sep Oct Nov Dec Monthly Total 2013 Monthly Total 2012 Monthly Total 2011 Monthly Total 2010 Monthly Total 2009 Monthly Total 2008 Monthly Total 2007 Monthly Total 2006 Monthly Total 2005
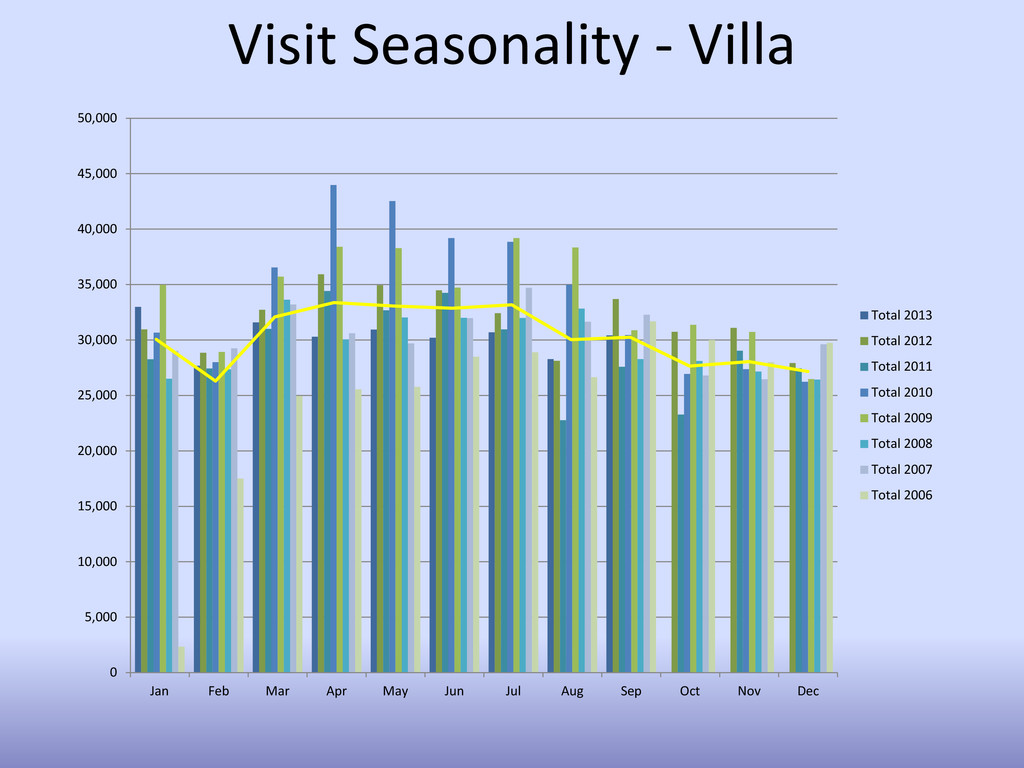
50,000 Jan Feb Mar Apr May Jun Jul Aug Sep Oct Nov Dec Total 2013 Total 2012 Total 2011 Total 2010 Total 2009 Total 2008 Total 2007 Total 2006 Visit Seasonality - Villa
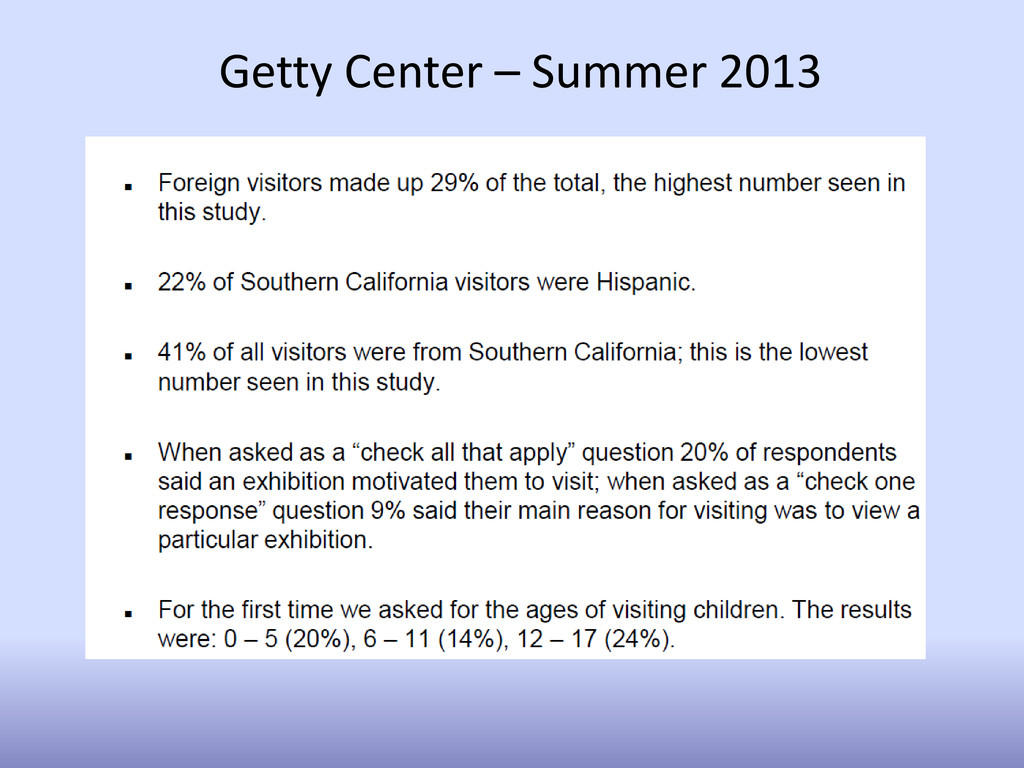
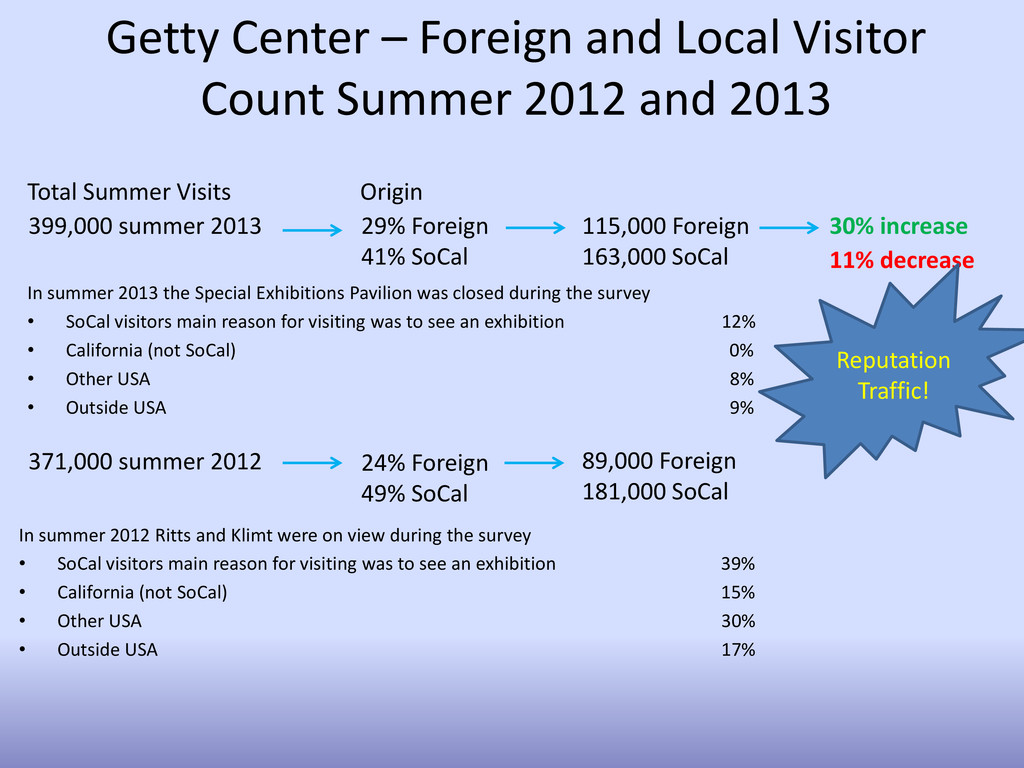
11% decrease Getty Center – Foreign and Local Visitor Count Summer 2012 and 2013 In summer 2013 the Special Exhibitions Pavilion was closed during the survey • SoCal visitors main reason for visiting was to see an exhibition 12% • California (not SoCal) 0% • Other USA 8% • Outside USA 9% In summer 2012 Ritts and Klimt were on view during the survey • SoCal visitors main reason for visiting was to see an exhibition 39% • California (not SoCal) 15% • Other USA 30% • Outside USA 17% 399,000 summer 2013 371,000 summer 2012 24% Foreign 49% SoCal 29% Foreign 41% SoCal Total Summer Visits Origin Reputation Traffic!
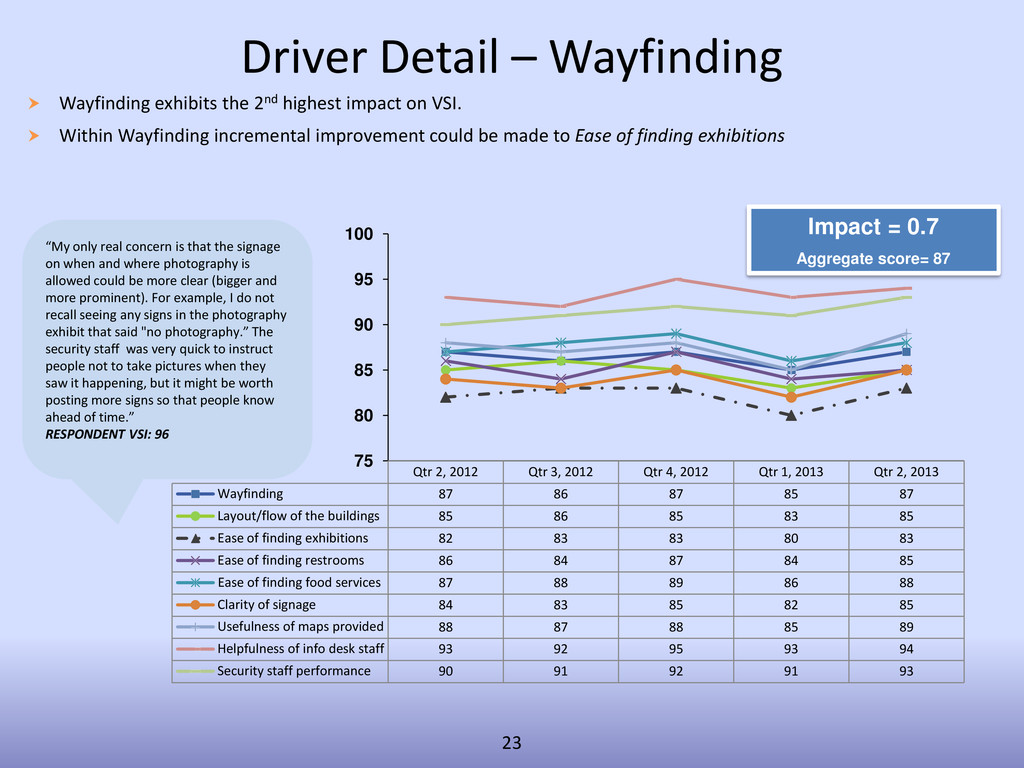
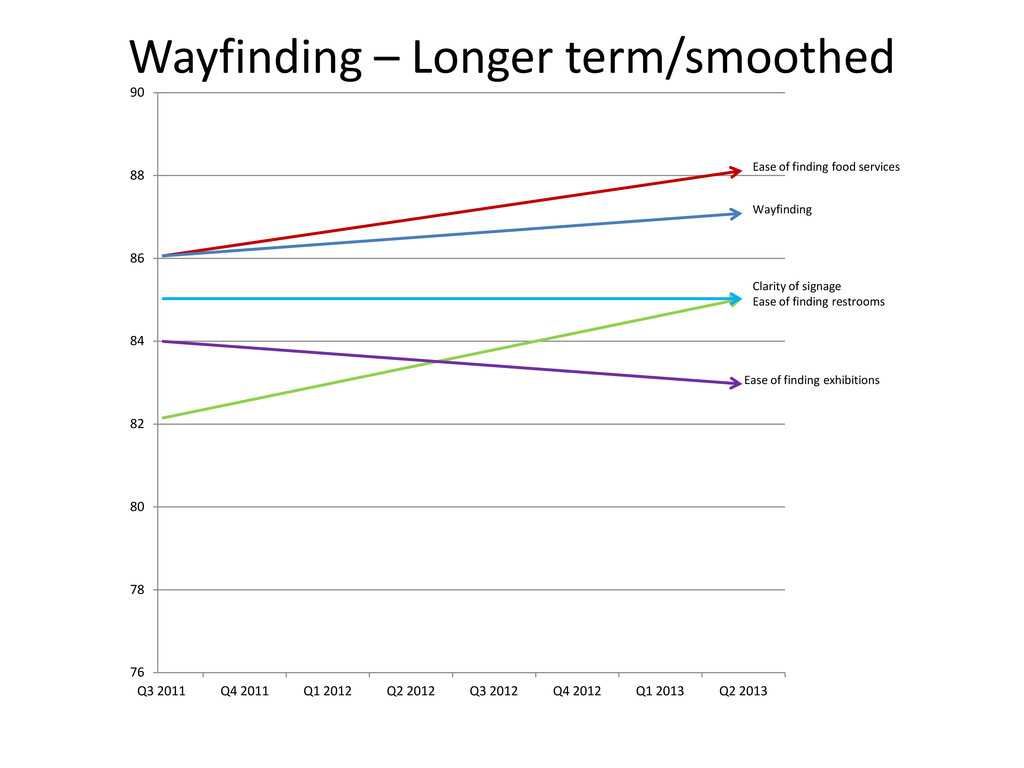
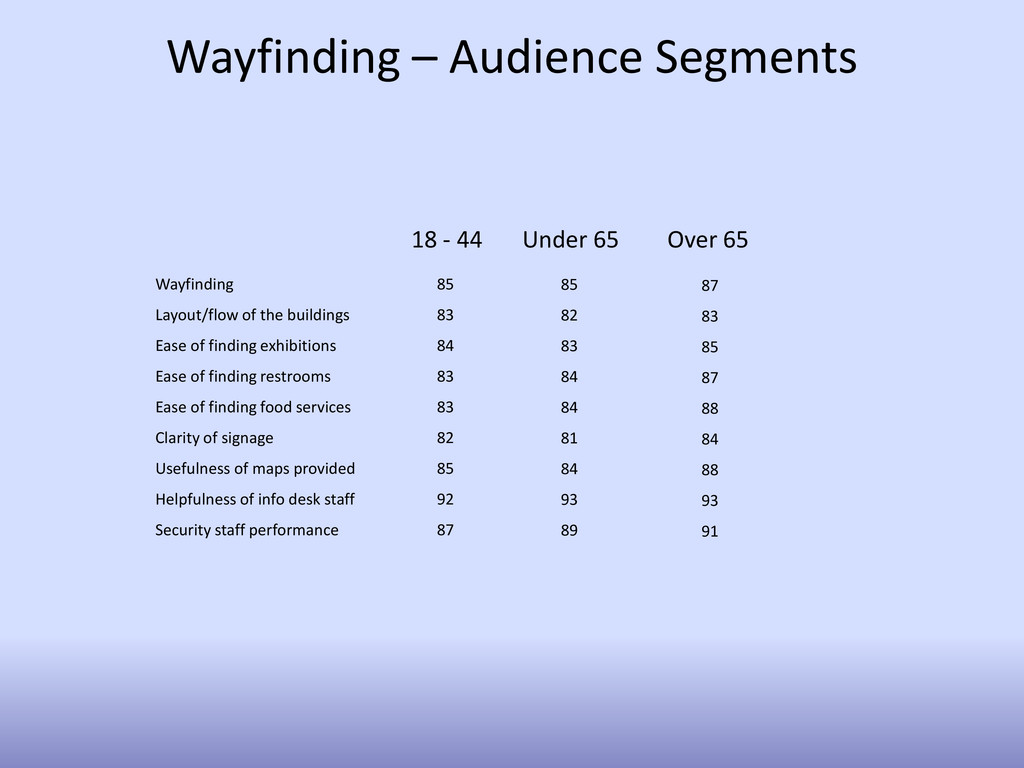
1, 2013 Qtr 2, 2013 Wayfinding 87 86 87 85 87 Layout/flow of the buildings 85 86 85 83 85 Ease of finding exhibitions 82 83 83 80 83 Ease of finding restrooms 86 84 87 84 85 Ease of finding food services 87 88 89 86 88 Clarity of signage 84 83 85 82 85 Usefulness of maps provided 88 87 88 85 89 Helpfulness of info desk staff 93 92 95 93 94 Security staff performance 90 91 92 91 93 75 80 85 90 95 100 Driver Detail – Wayfinding Wayfinding exhibits the 2nd highest impact on VSI. Within Wayfinding incremental improvement could be made to Ease of finding exhibitions 23 Impact = 0.7 Aggregate score= 87 “My only real concern is that the signage on when and where photography is allowed could be more clear (bigger and more prominent). For example, I do not recall seeing any signs in the photography exhibit that said "no photography.” The security staff was very quick to instruct people not to take pictures when they saw it happening, but it might be worth posting more signs so that people know ahead of time.” RESPONDENT VSI: 96
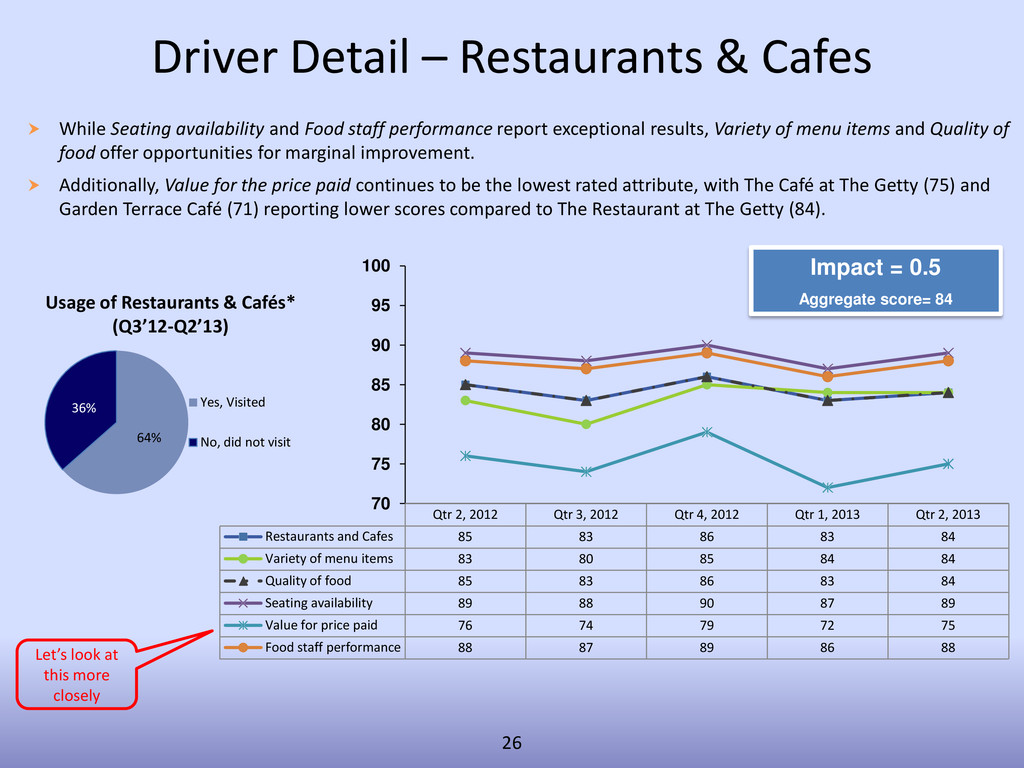
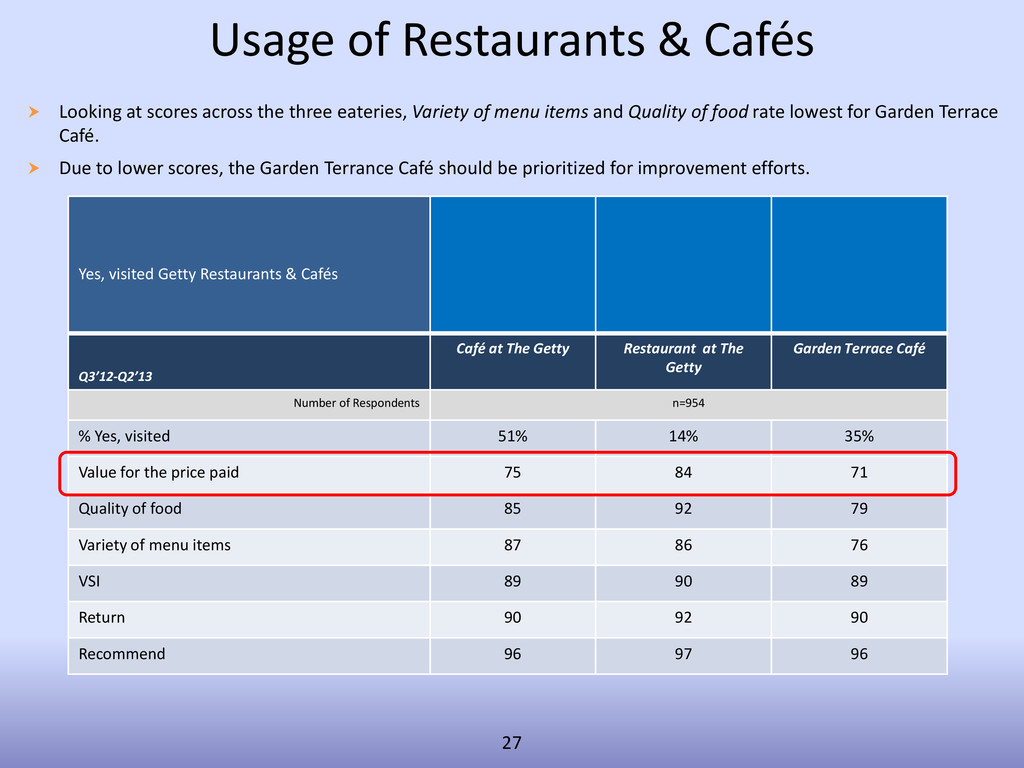
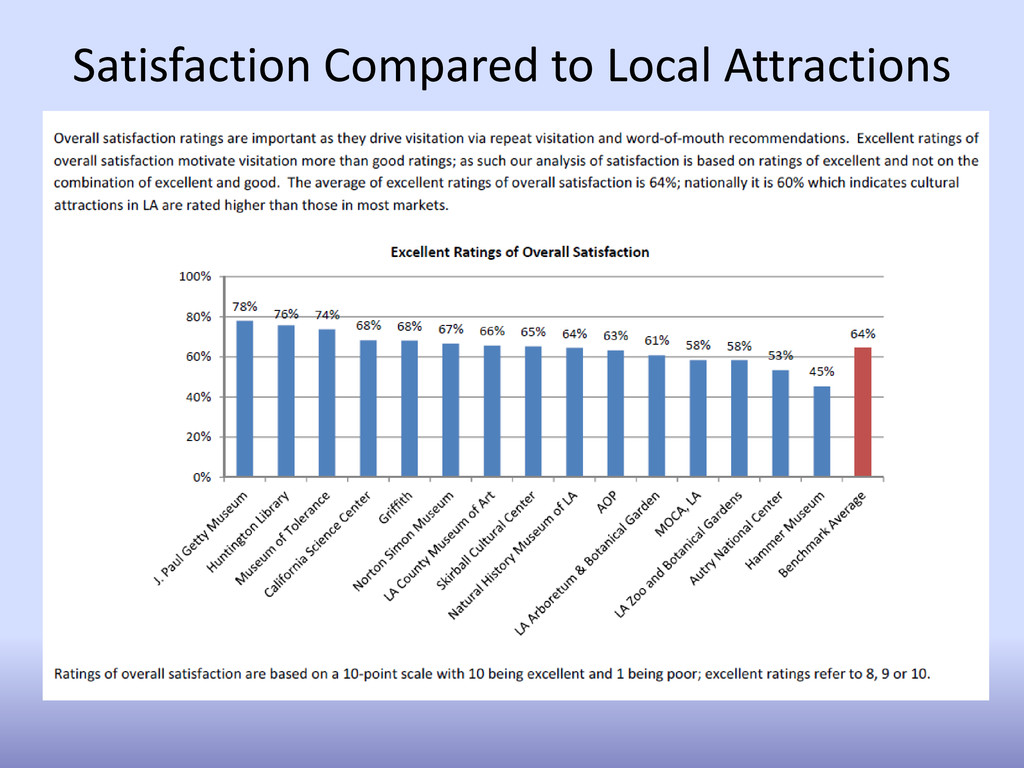
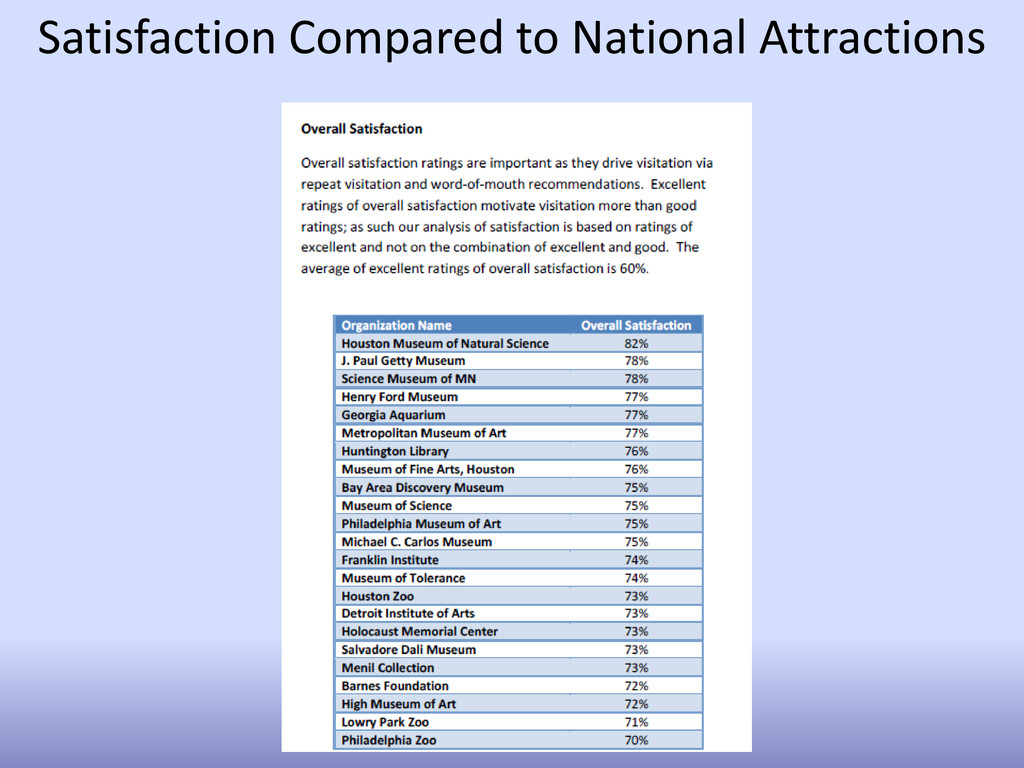
and Food staff performance report exceptional results, Variety of menu items and Quality of food offer opportunities for marginal improvement. Additionally, Value for the price paid continues to be the lowest rated attribute, with The Café at The Getty (75) and Garden Terrace Café (71) reporting lower scores compared to The Restaurant at The Getty (84). 26 Qtr 2, 2012 Qtr 3, 2012 Qtr 4, 2012 Qtr 1, 2013 Qtr 2, 2013 Restaurants and Cafes 85 83 86 83 84 Variety of menu items 83 80 85 84 84 Quality of food 85 83 86 83 84 Seating availability 89 88 90 87 89 Value for price paid 76 74 79 72 75 Food staff performance 88 87 89 86 88 70 75 80 85 90 95 100 Impact = 0.5 Aggregate score= 84 Usage of Restaurants & Cafés* (Q3’12-Q2’13) 64% 36% Yes, Visited No, did not visit Let’s look at this more closely
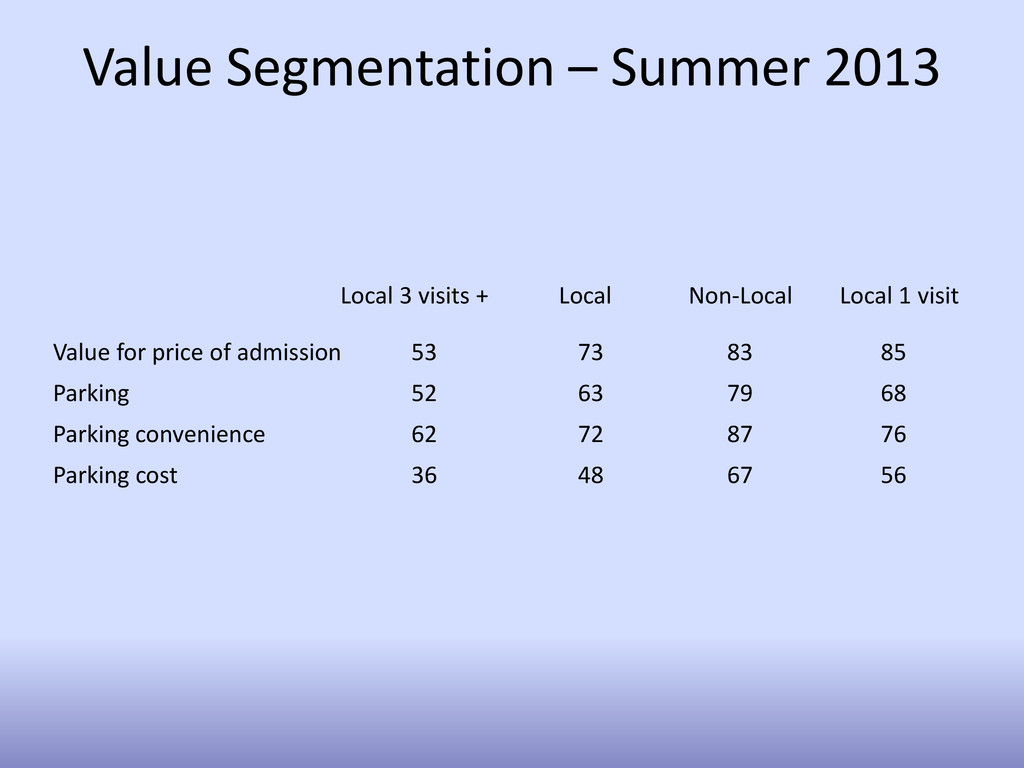
menu items and Quality of food rate lowest for Garden Terrace Café. Due to lower scores, the Garden Terrance Café should be prioritized for improvement efforts. Usage of Restaurants & Cafés Yes, visited Getty Restaurants & Cafés Q3’12-Q2’13 Café at The Getty Restaurant at The Getty Garden Terrace Café Number of Respondents n=954 % Yes, visited 51% 14% 35% Value for the price paid 75 84 71 Quality of food 85 92 79 Variety of menu items 87 86 76 VSI 89 90 89 Return 90 92 90 Recommend 96 97 96 27
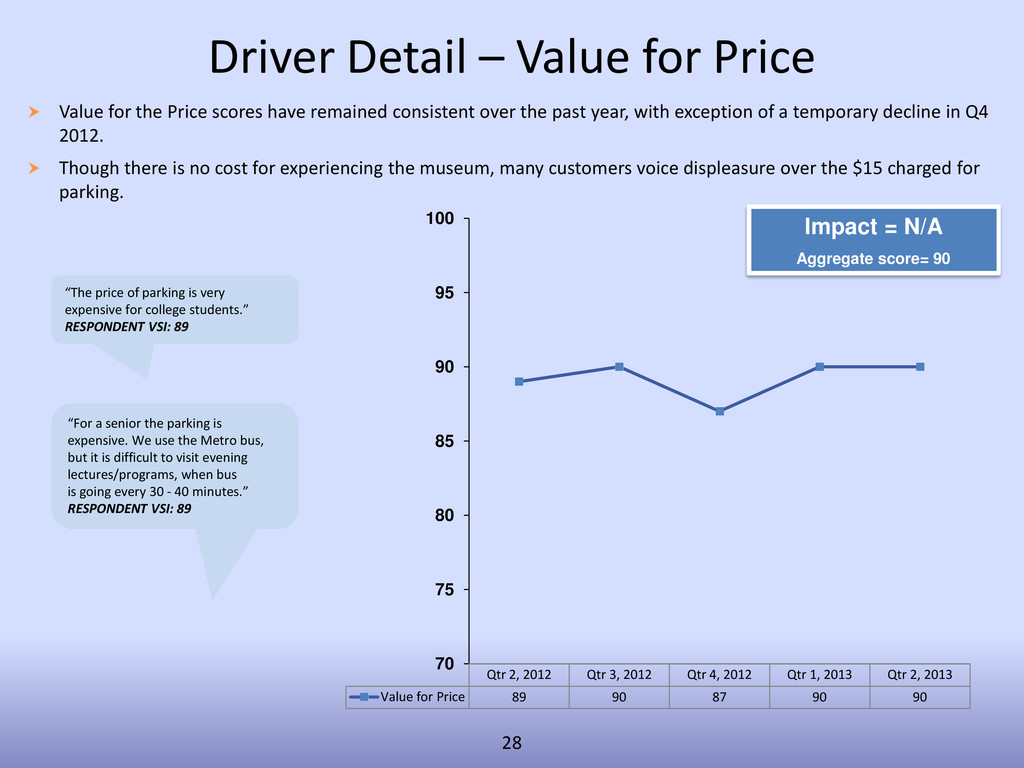
Price scores have remained consistent over the past year, with exception of a temporary decline in Q4 2012. Though there is no cost for experiencing the museum, many customers voice displeasure over the $15 charged for parking. 28 Qtr 2, 2012 Qtr 3, 2012 Qtr 4, 2012 Qtr 1, 2013 Qtr 2, 2013 Value for Price 89 90 87 90 90 70 75 80 85 90 95 100 Impact = N/A Aggregate score= 90 “The price of parking is very expensive for college students.” RESPONDENT VSI: 89 “For a senior the parking is expensive. We use the Metro bus, but it is difficult to visit evening lectures/programs, when bus is going every 30 - 40 minutes.” RESPONDENT VSI: 89
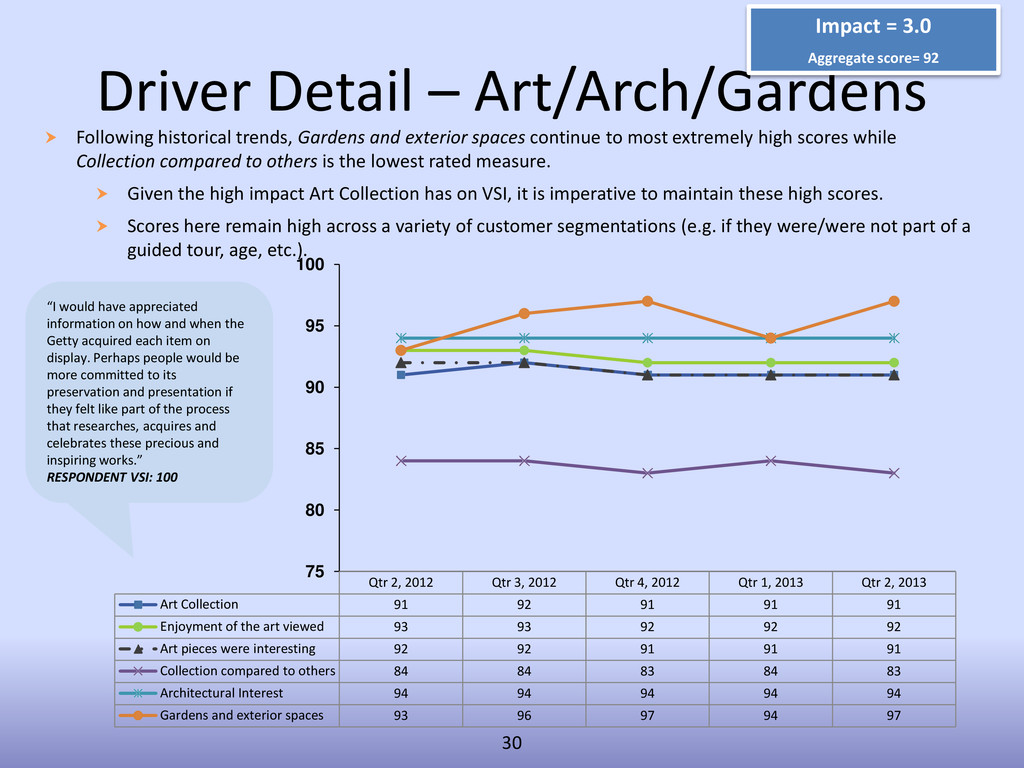
Following historical trends, Gardens and exterior spaces continue to most extremely high scores while Collection compared to others is the lowest rated measure. Given the high impact Art Collection has on VSI, it is imperative to maintain these high scores. Scores here remain high across a variety of customer segmentations (e.g. if they were/were not part of a guided tour, age, etc.). 30 Qtr 2, 2012 Qtr 3, 2012 Qtr 4, 2012 Qtr 1, 2013 Qtr 2, 2013 Art Collection 91 92 91 91 91 Enjoyment of the art viewed 93 93 92 92 92 Art pieces were interesting 92 92 91 91 91 Collection compared to others 84 84 83 84 83 Architectural Interest 94 94 94 94 94 Gardens and exterior spaces 93 96 97 94 97 75 80 85 90 95 100 “I would have appreciated information on how and when the Getty acquired each item on display. Perhaps people would be more committed to its preservation and presentation if they felt like part of the process that researches, acquires and celebrates these precious and inspiring works.” RESPONDENT VSI: 100


 greggifford
 eitanlees
 hatefulcrawdad
 dugsong
 techseoconnect
 hannesfritz
 ianozsvald
 maggiecrowley
 smashingmag
 asonas
 reverentgeek
 dougneiner