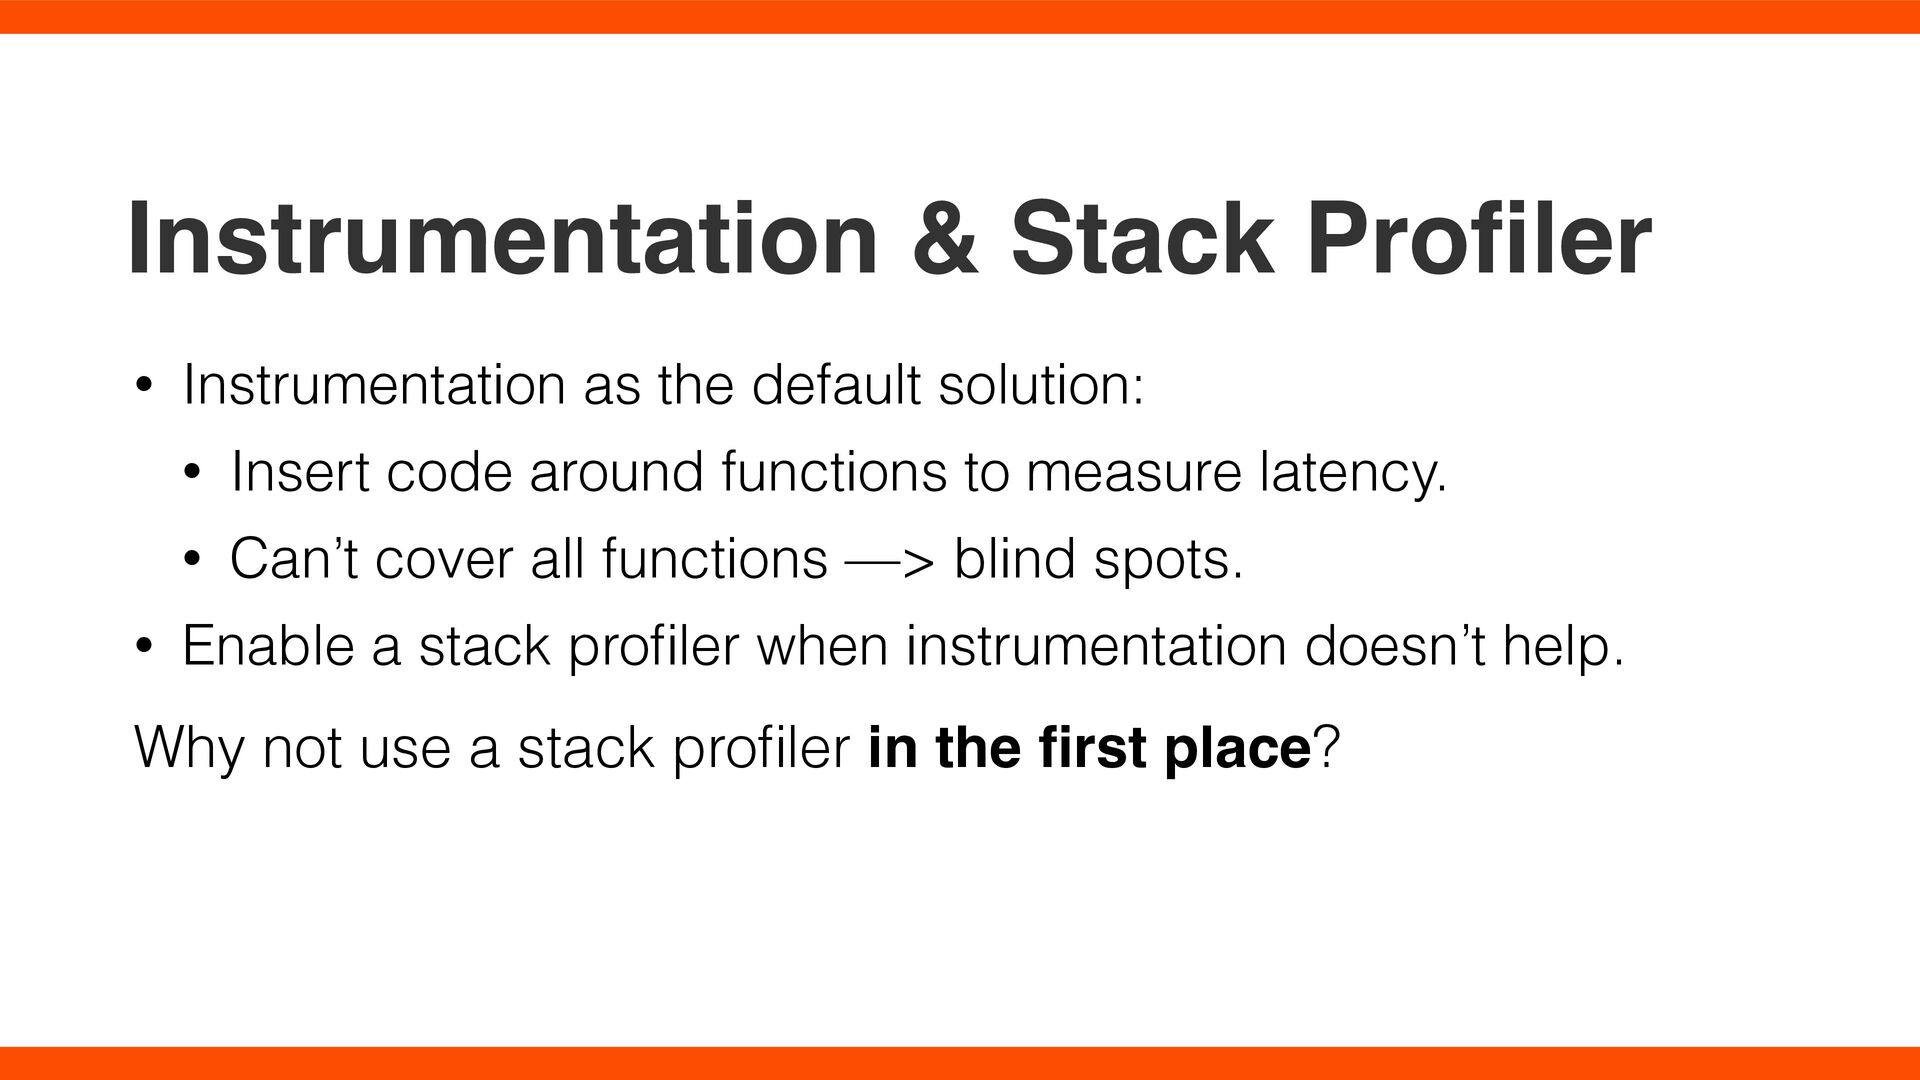
default solution: • Insert code around functions to measure latency. • Can’t cover all functions —> blind spots. • Enable a stack pro fi ler when instrumentation doesn’t help. Why not use a stack pro fi ler in the fi rst place?
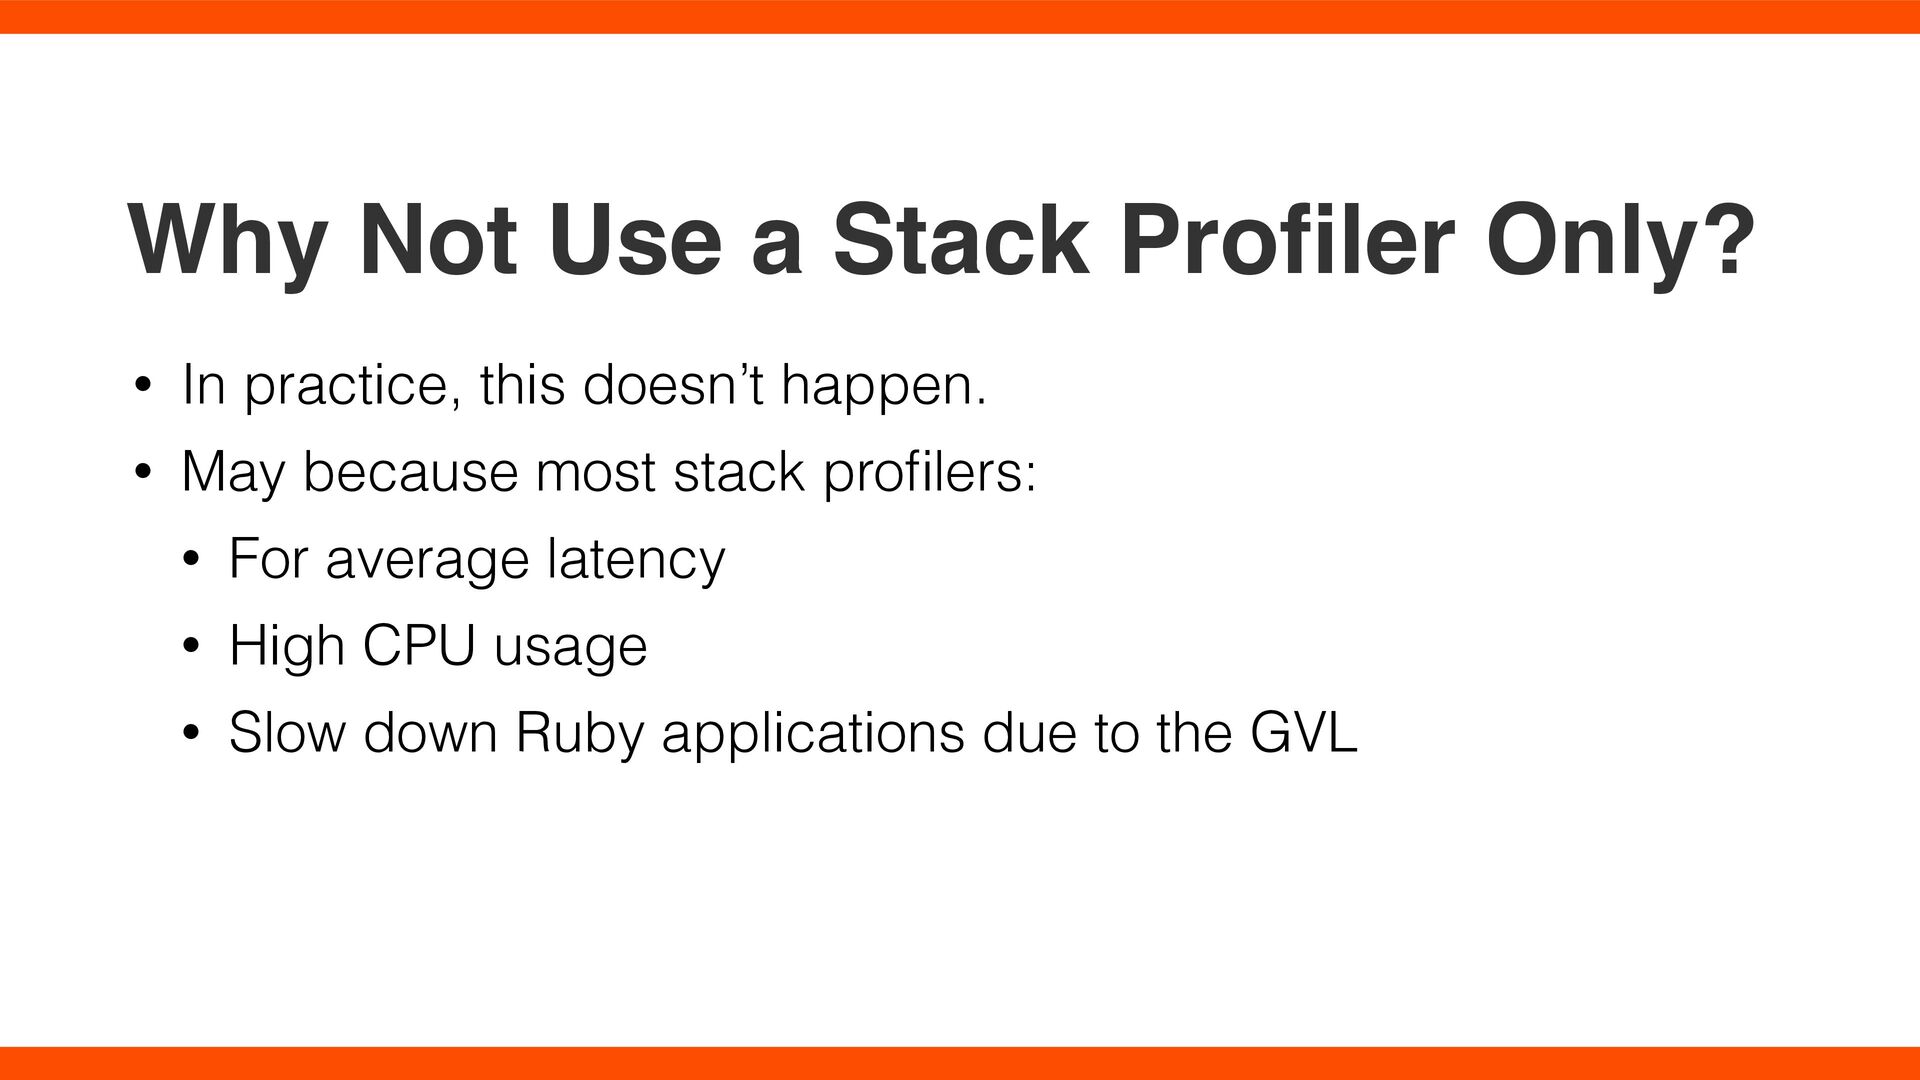
In practice, this doesn’t happen. • May because most stack pro fi lers: • For average latency • High CPU usage • Slow down Ruby applications due to the GVL
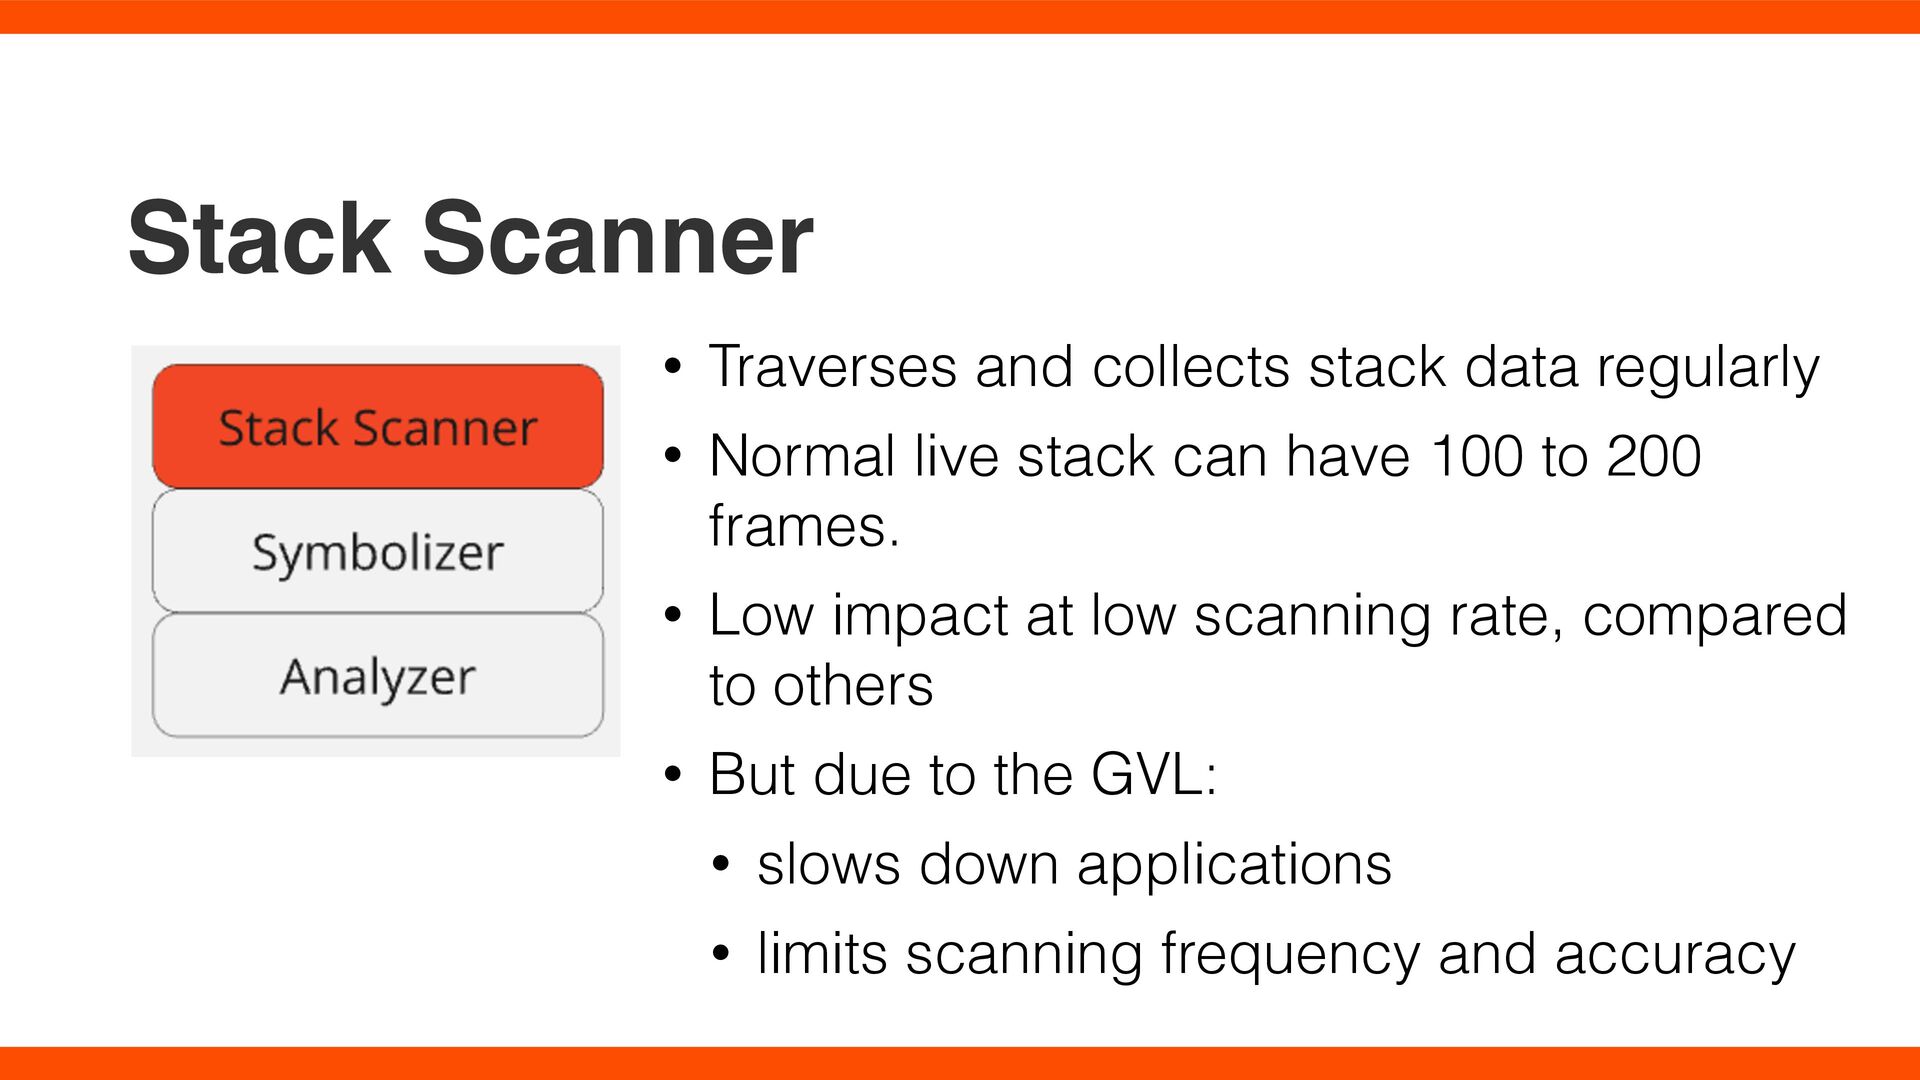
Normal live stack can have 100 to 200 frames. • Low impact at low scanning rate, compared to others • But due to the GVL: • slows down applications • limits scanning frequency and accuracy
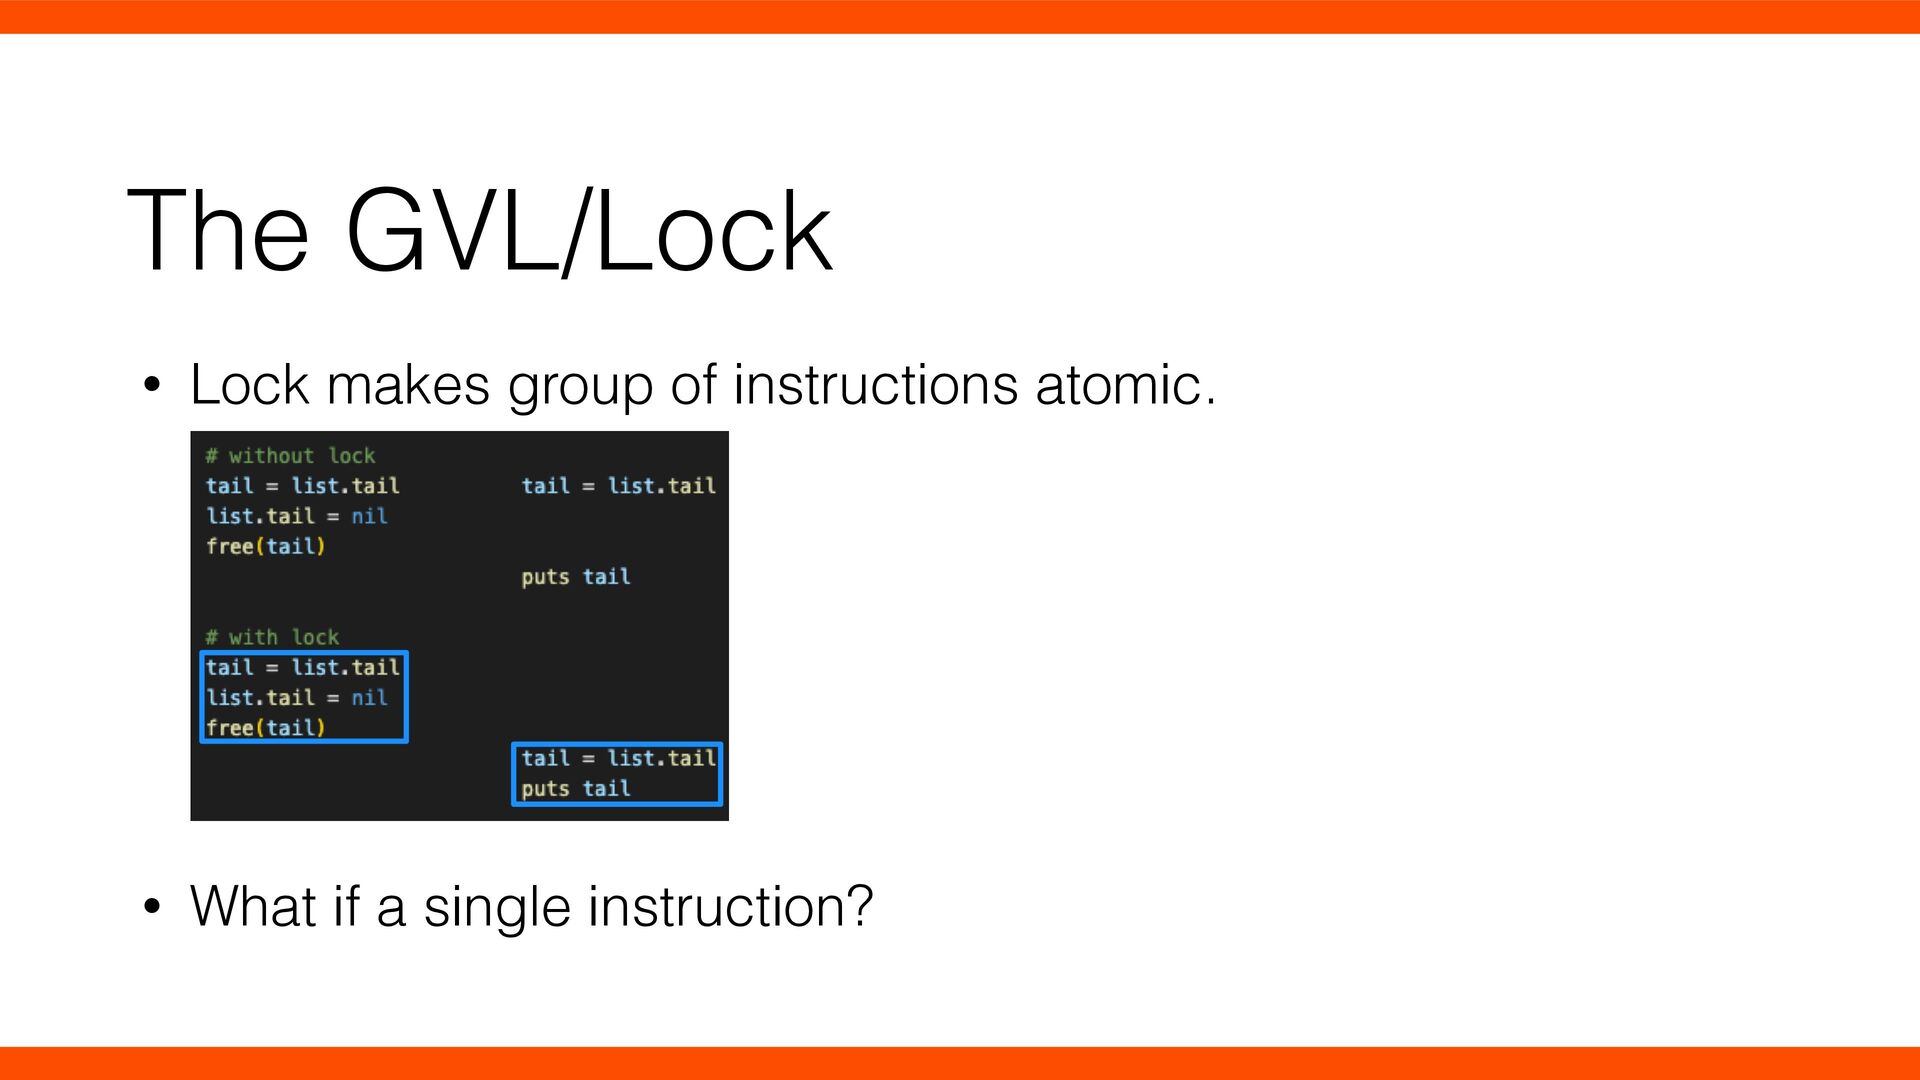
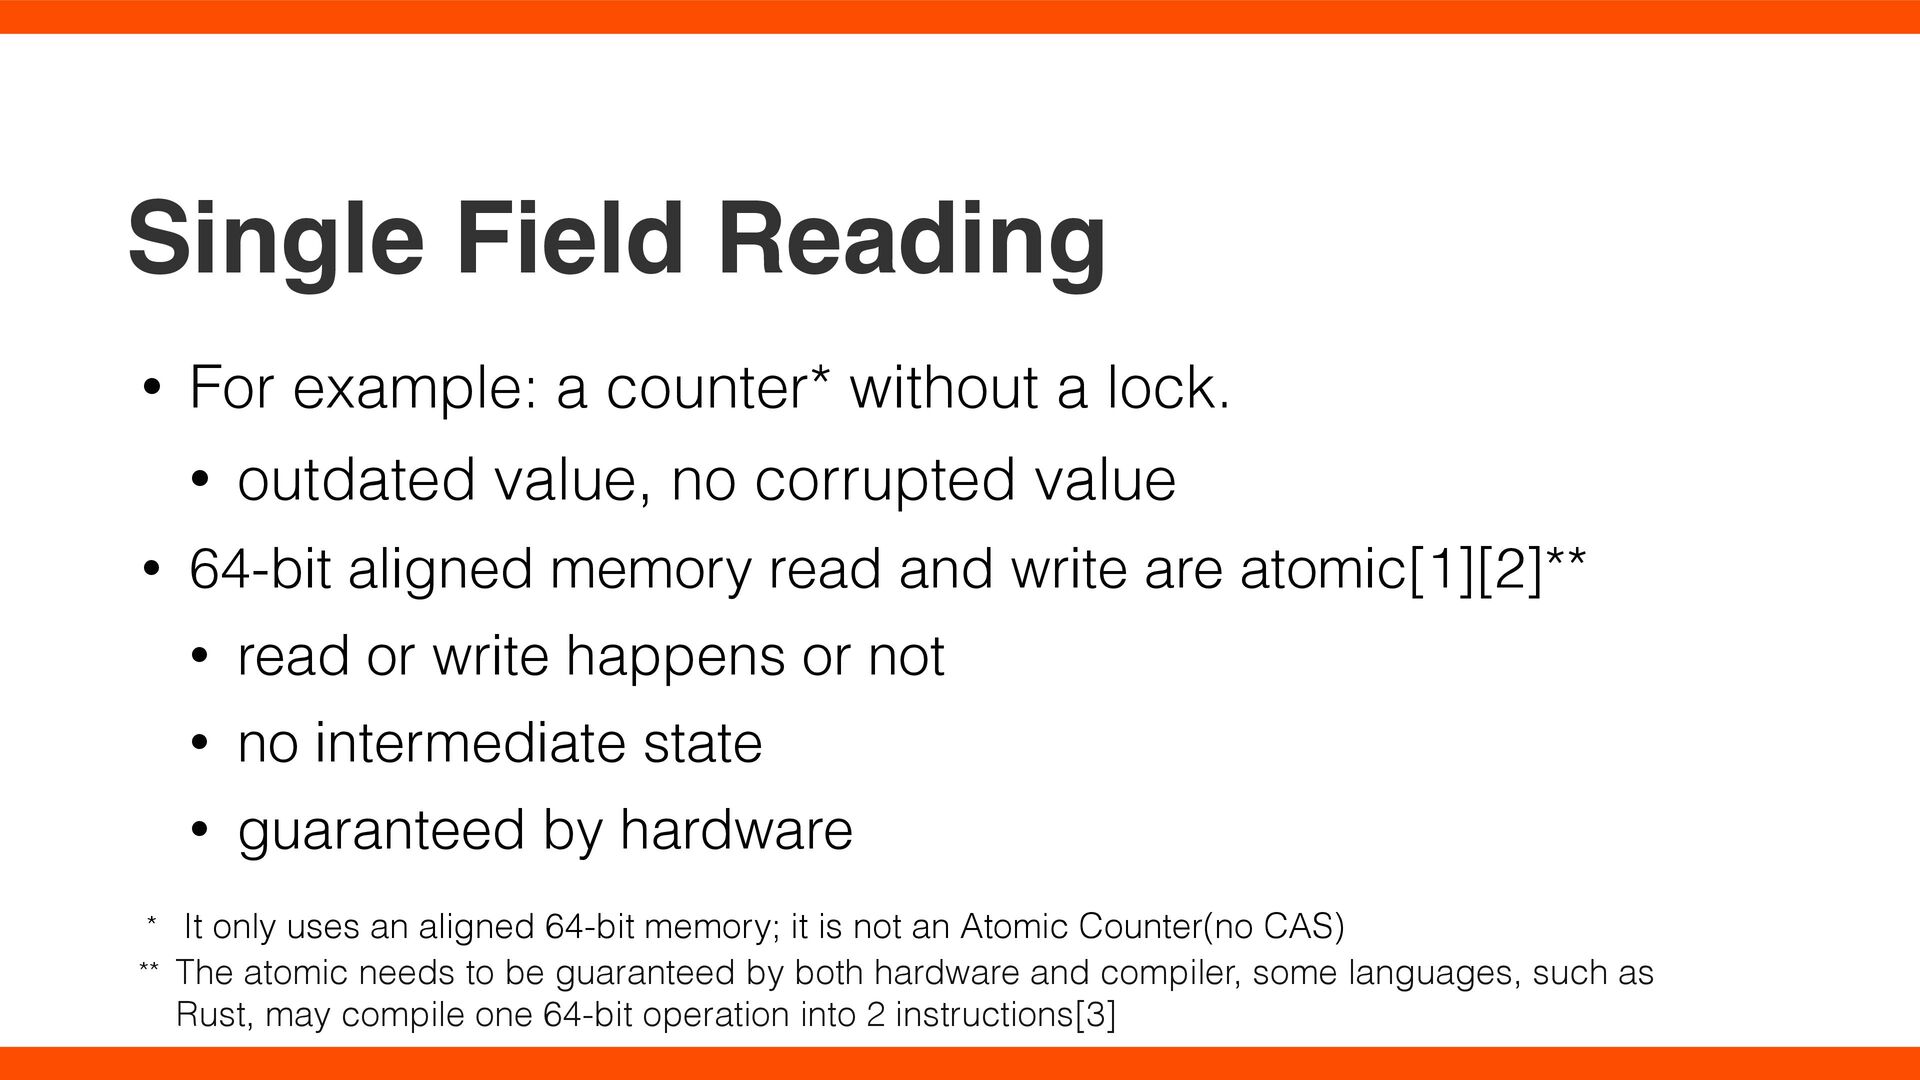
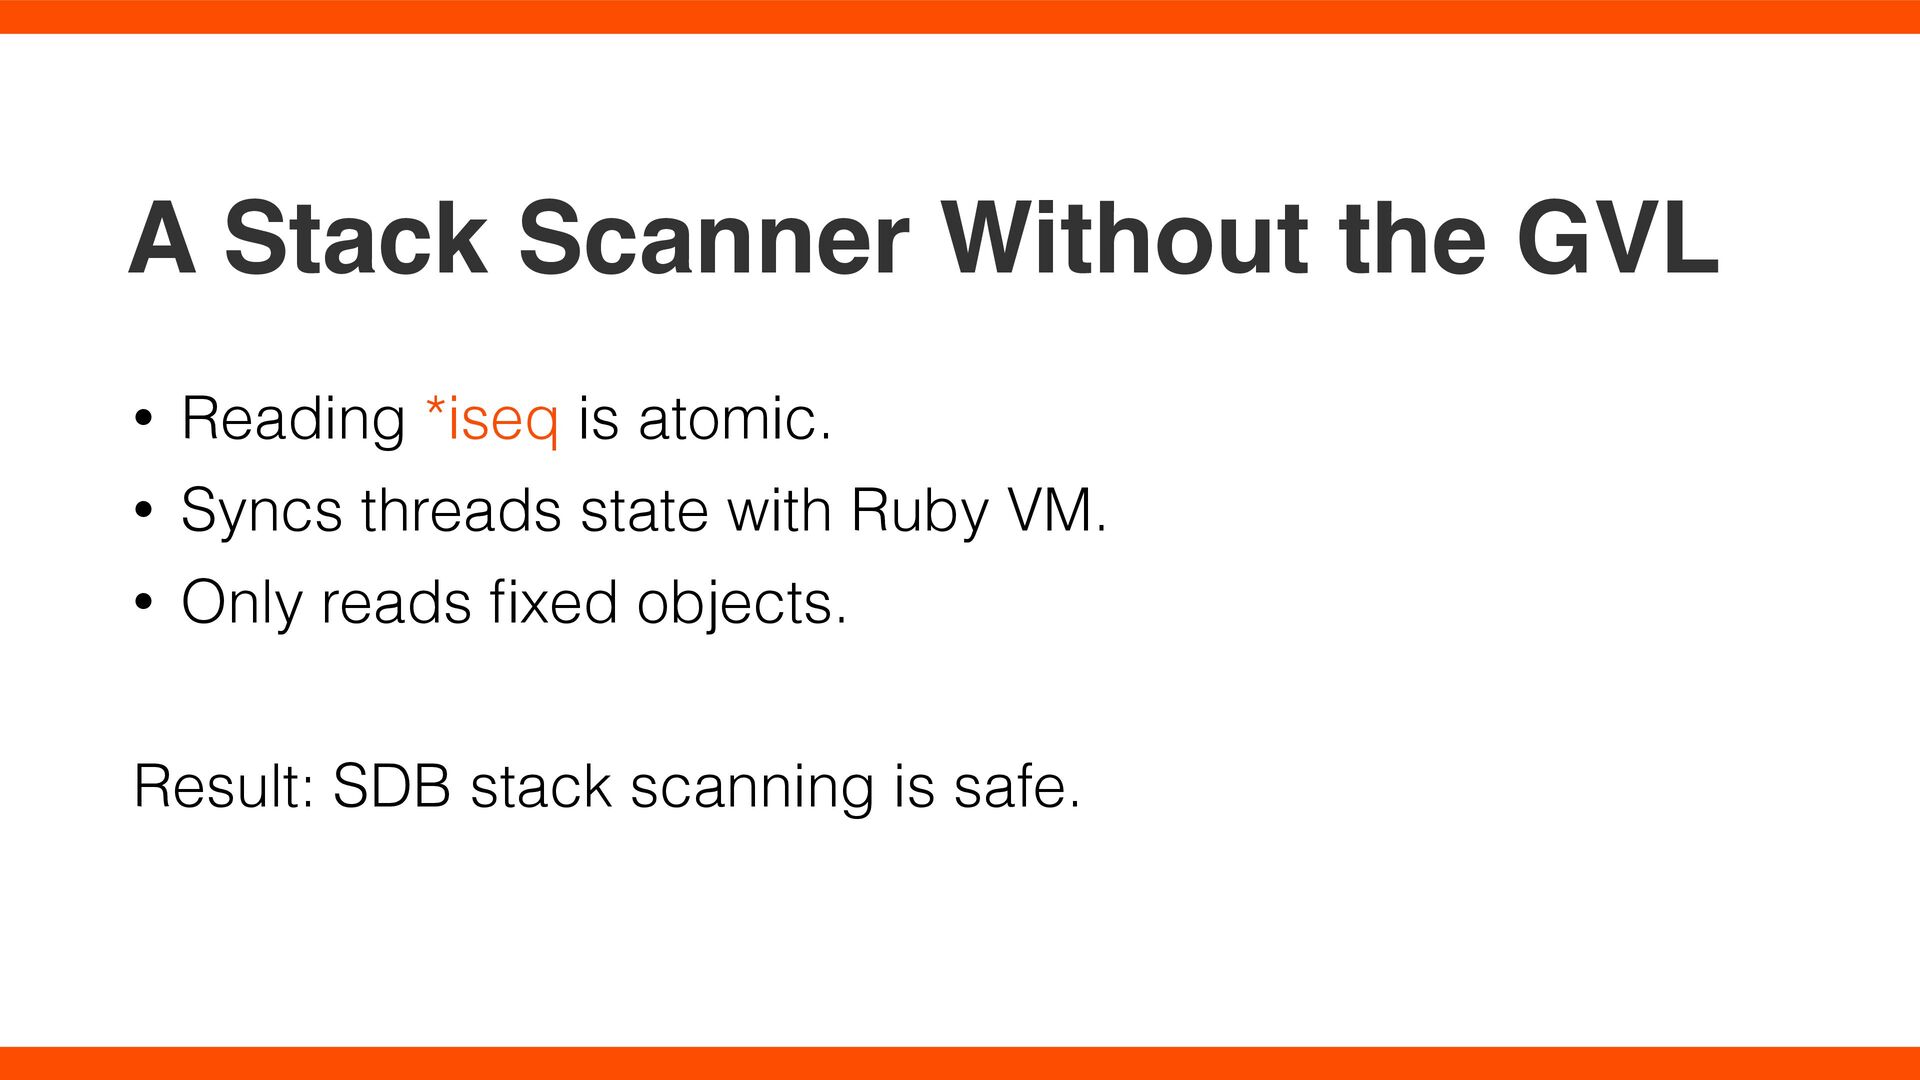
lock. • outdated value, no corrupted value • 64-bit aligned memory read and write are atomic[1][2]** • read or write happens or not • no intermediate state • guaranteed by hardware * It only uses an aligned 64-bit memory; it is not an Atomic Counter(no CAS) ** The atomic needs to be guaranteed by both hardware and compiler, some languages, such as Rust, may compile one 64-bit operation into 2 instructions[3]
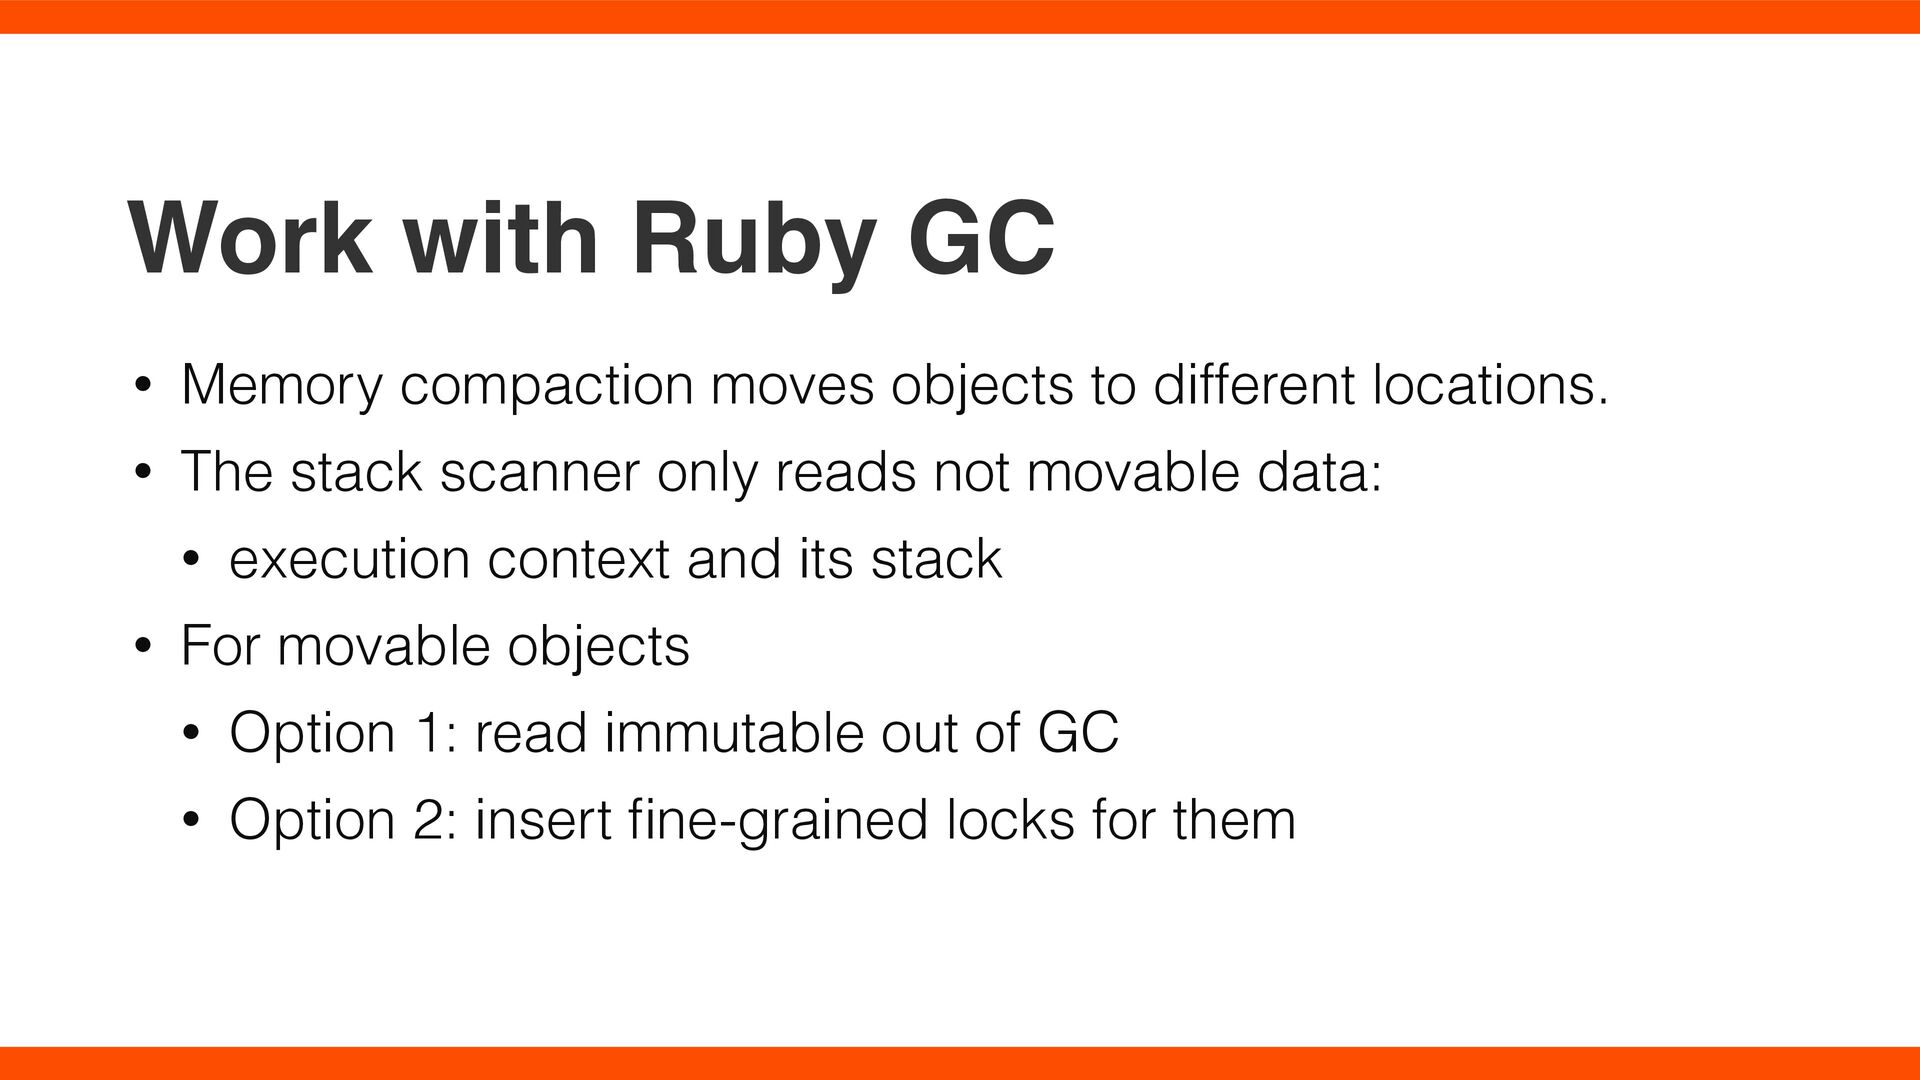
different locations. • The stack scanner only reads not movable data: • execution context and its stack • For movable objects • Option 1: read immutable out of GC • Option 2: insert fi ne-grained locks for them
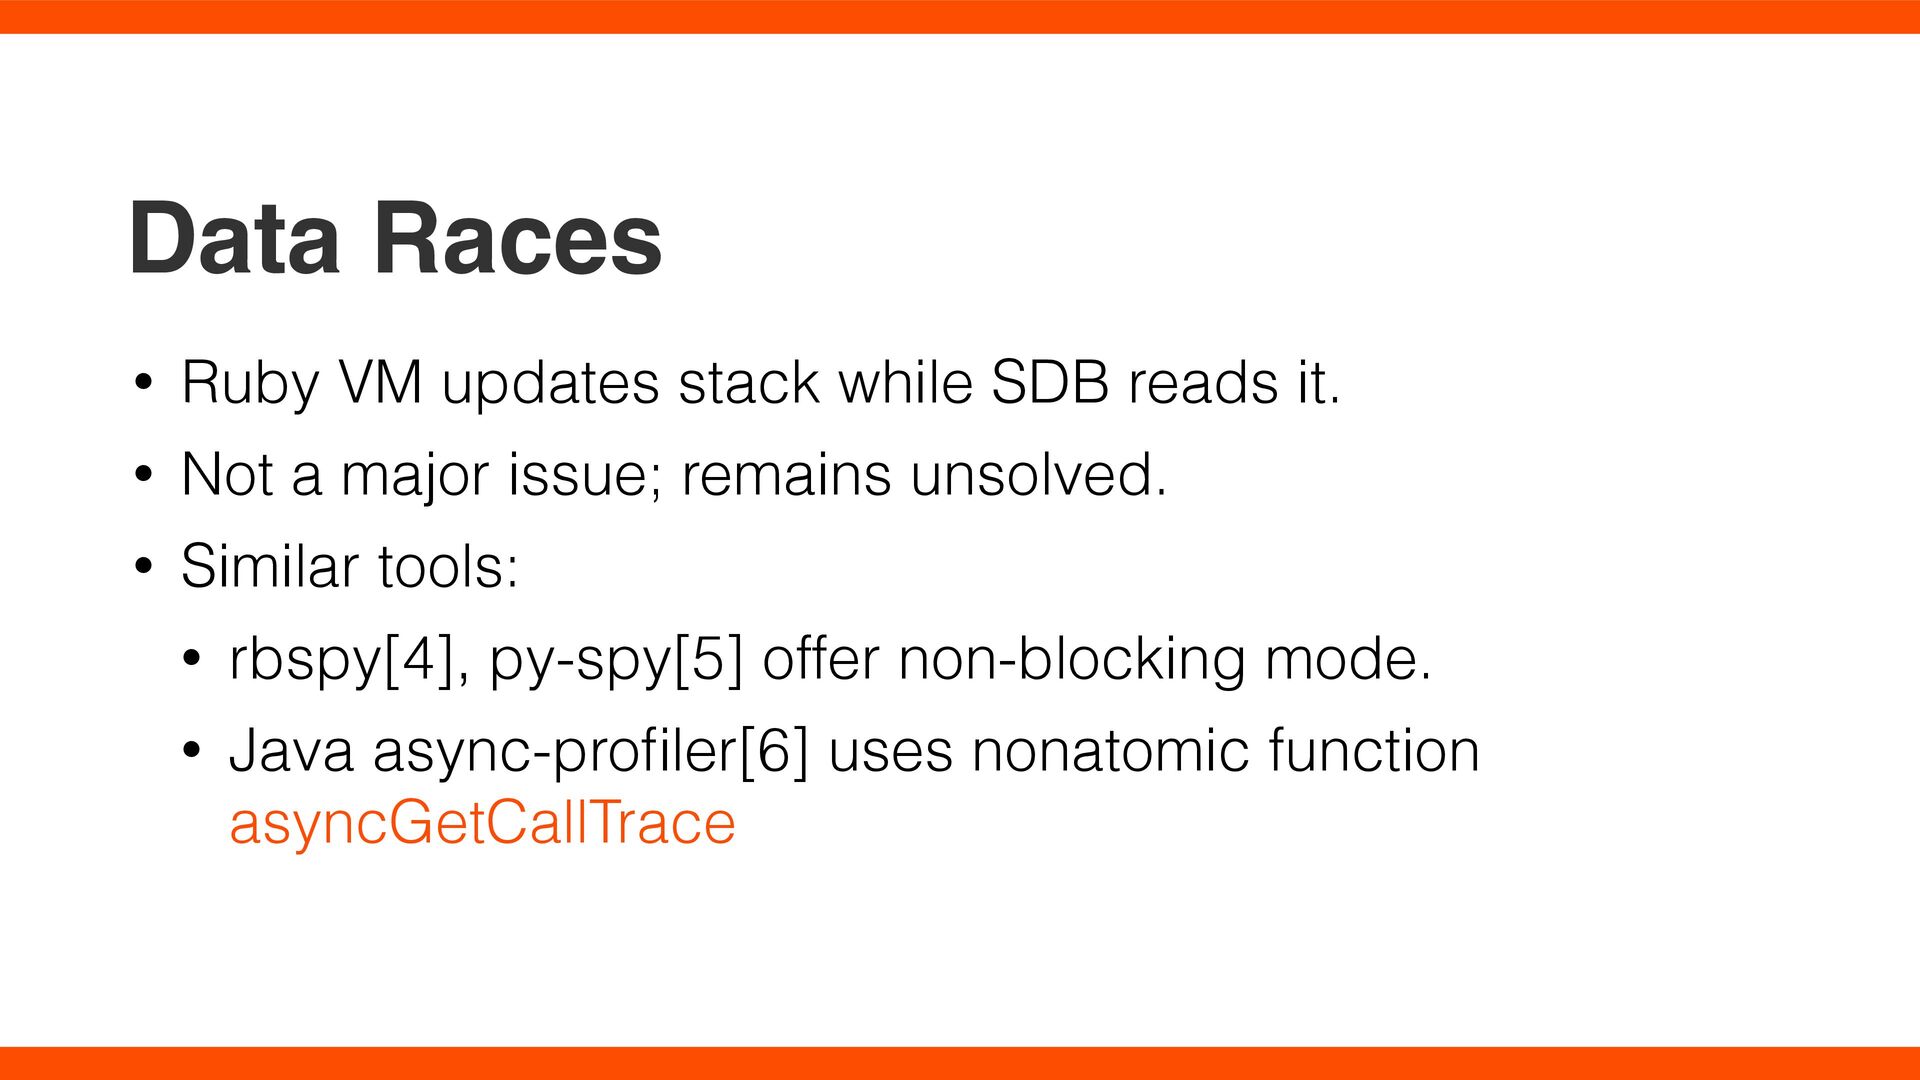
it. • Not a major issue; remains unsolved. • Similar tools: • rbspy[4], py-spy[5] offer non-blocking mode. • Java async-pro fi ler[6] uses nonatomic function asyncGetCallTrace
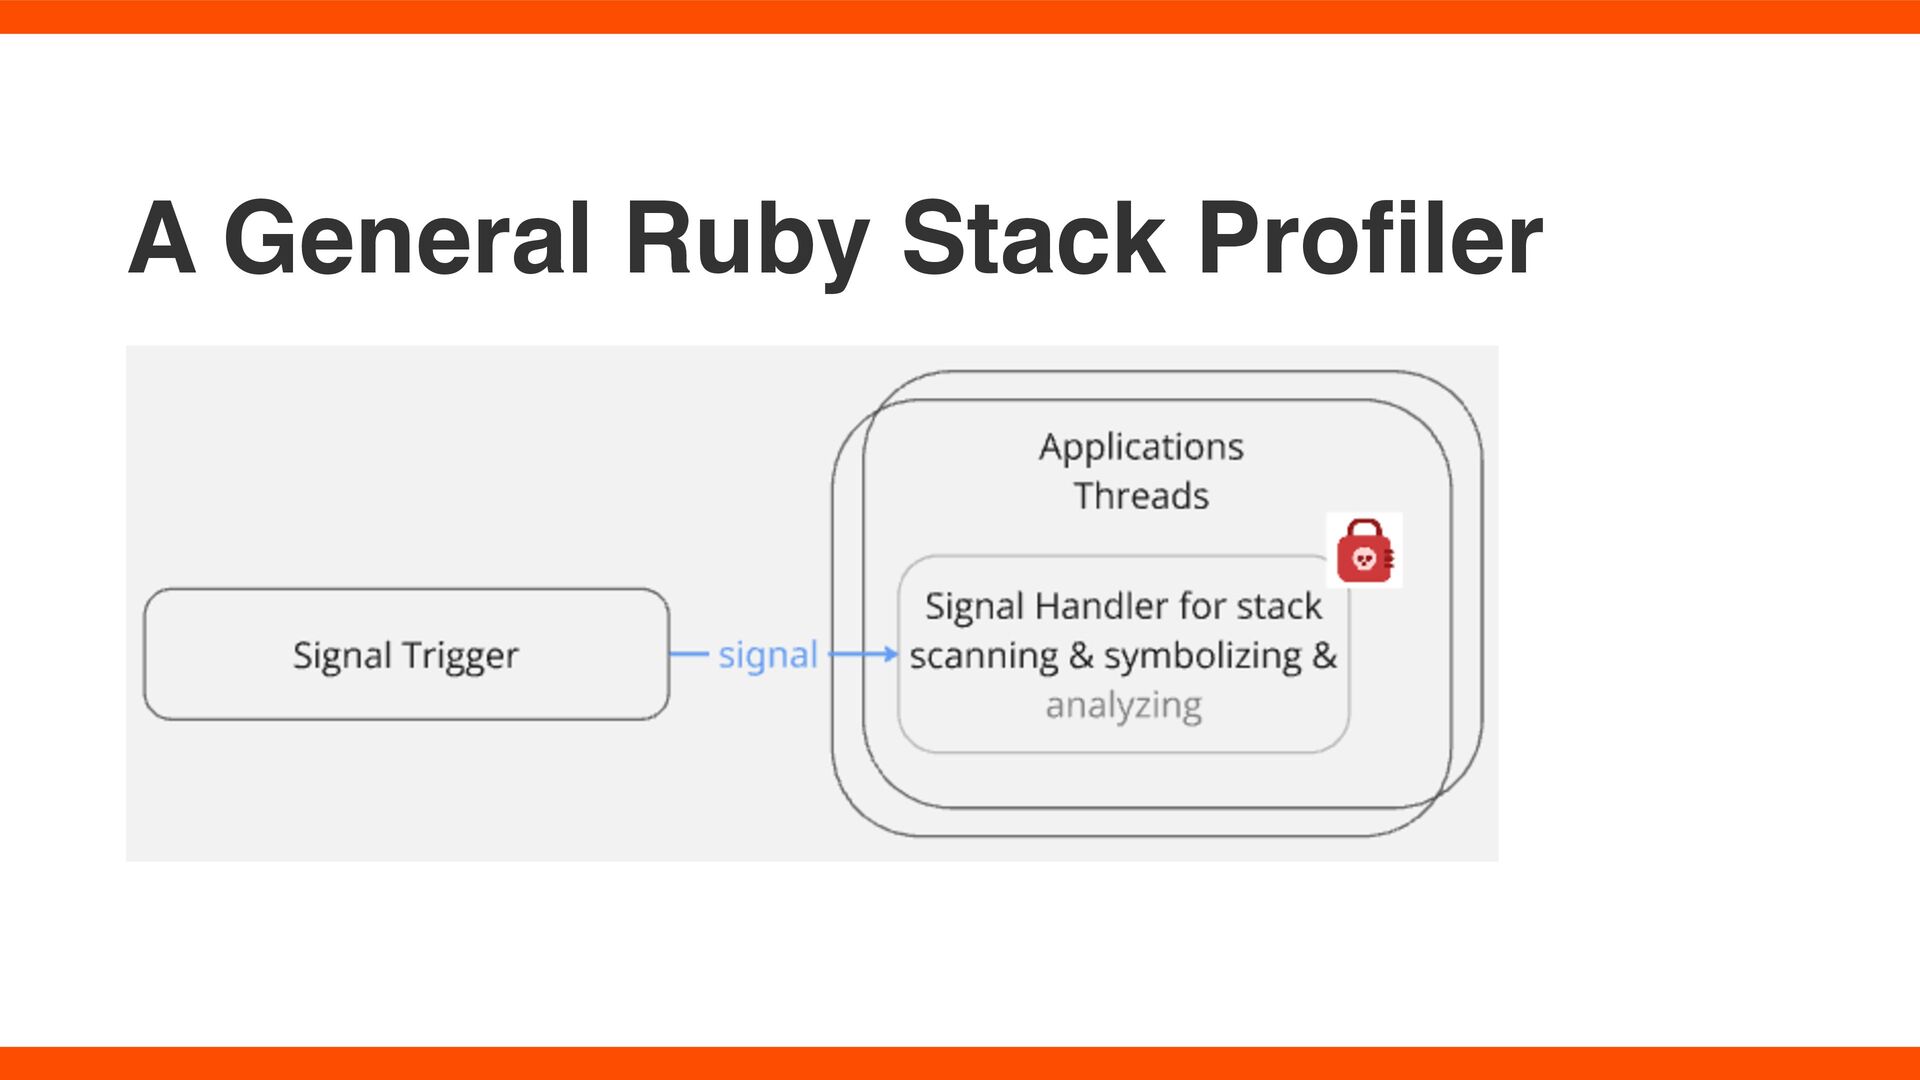
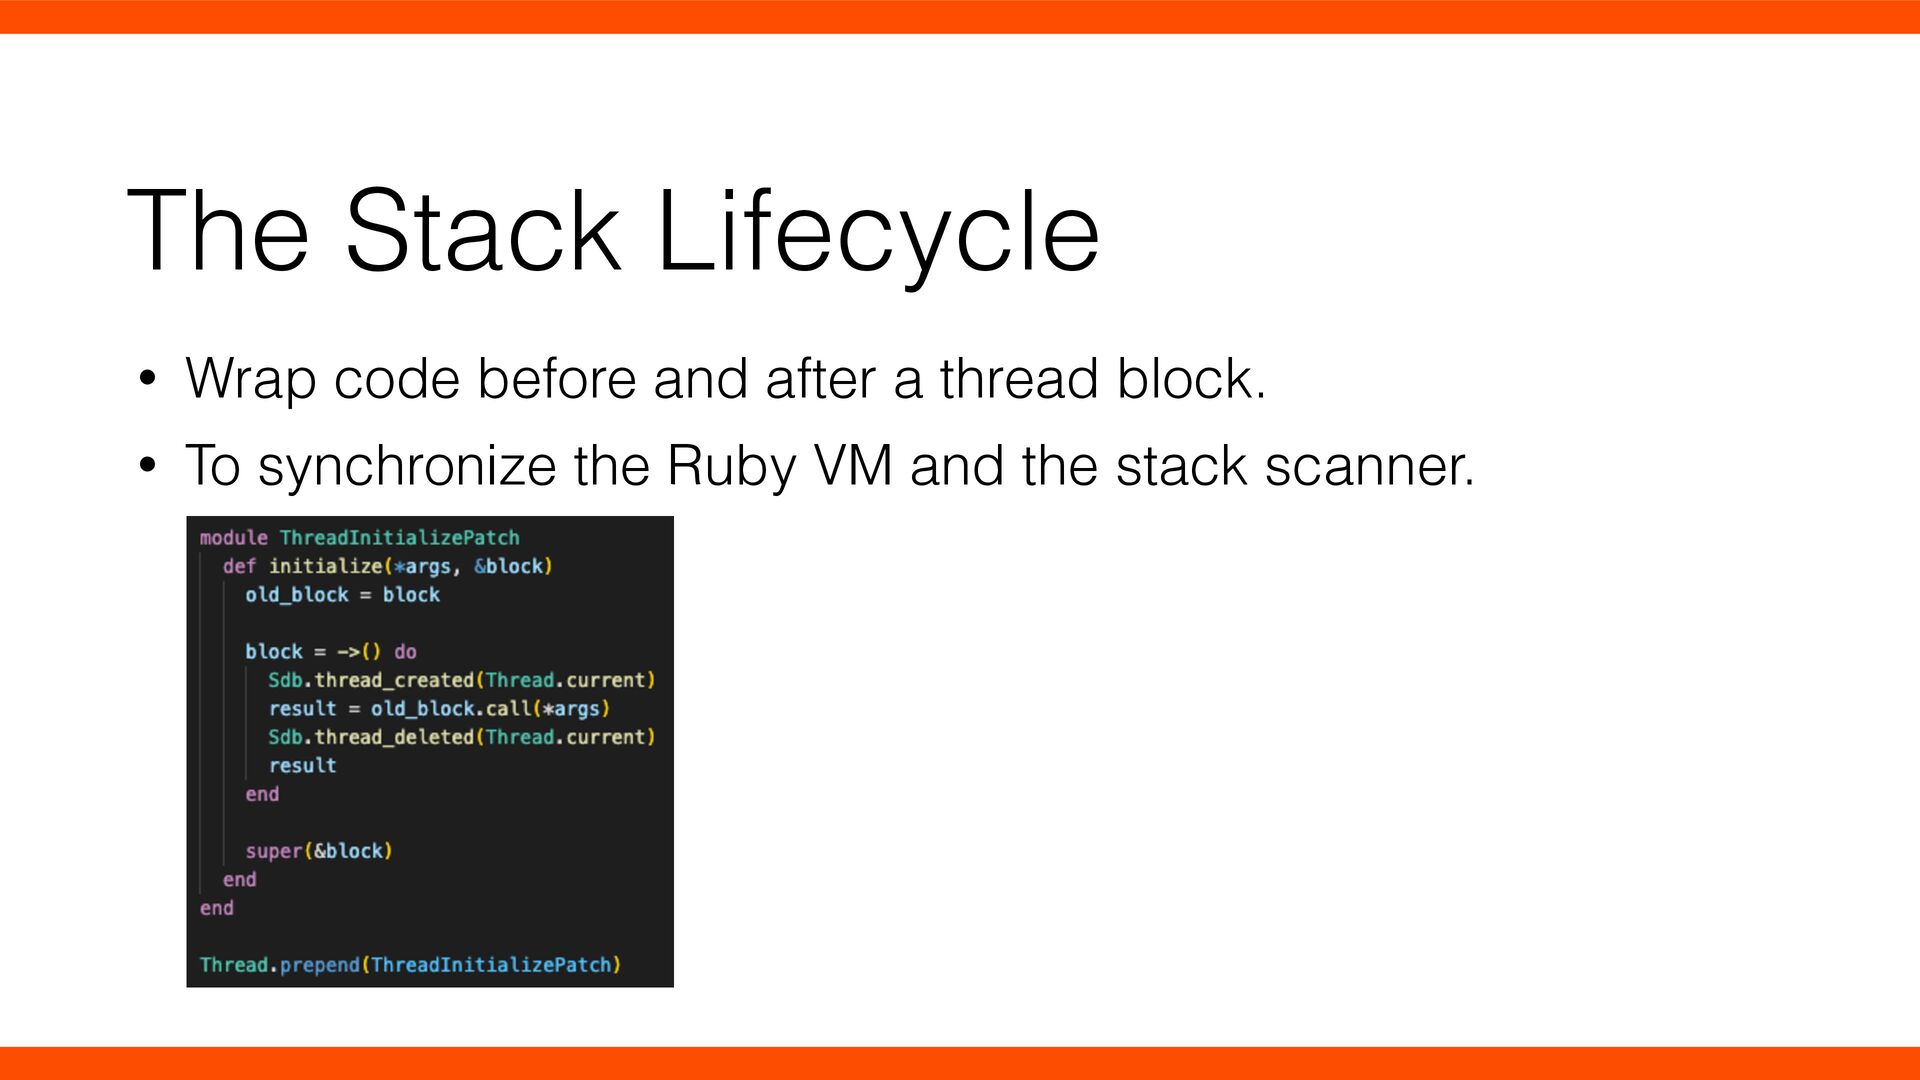
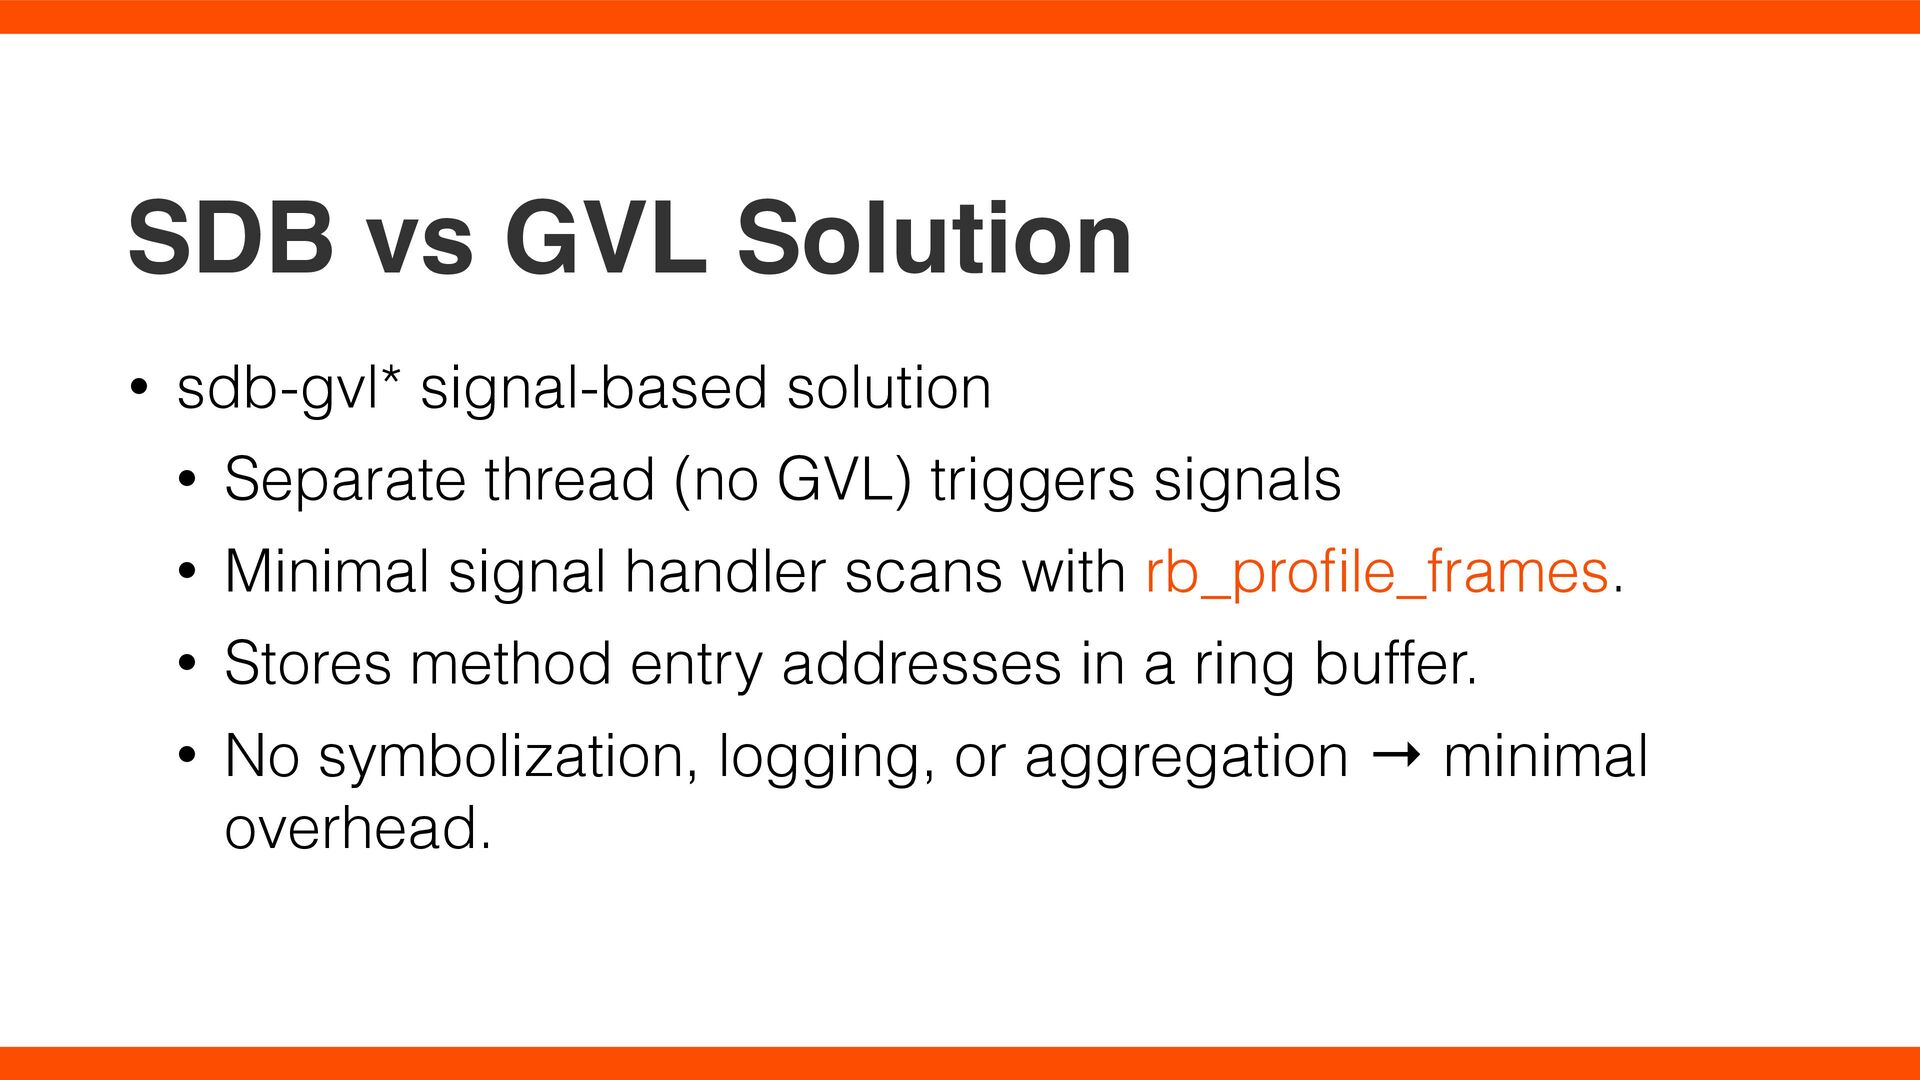
thread (no GVL) triggers signals • Minimal signal handler scans with rb_pro fi le_frames. • Stores method entry addresses in a ring buffer. • No symbolization, logging, or aggregation → minimal overhead.
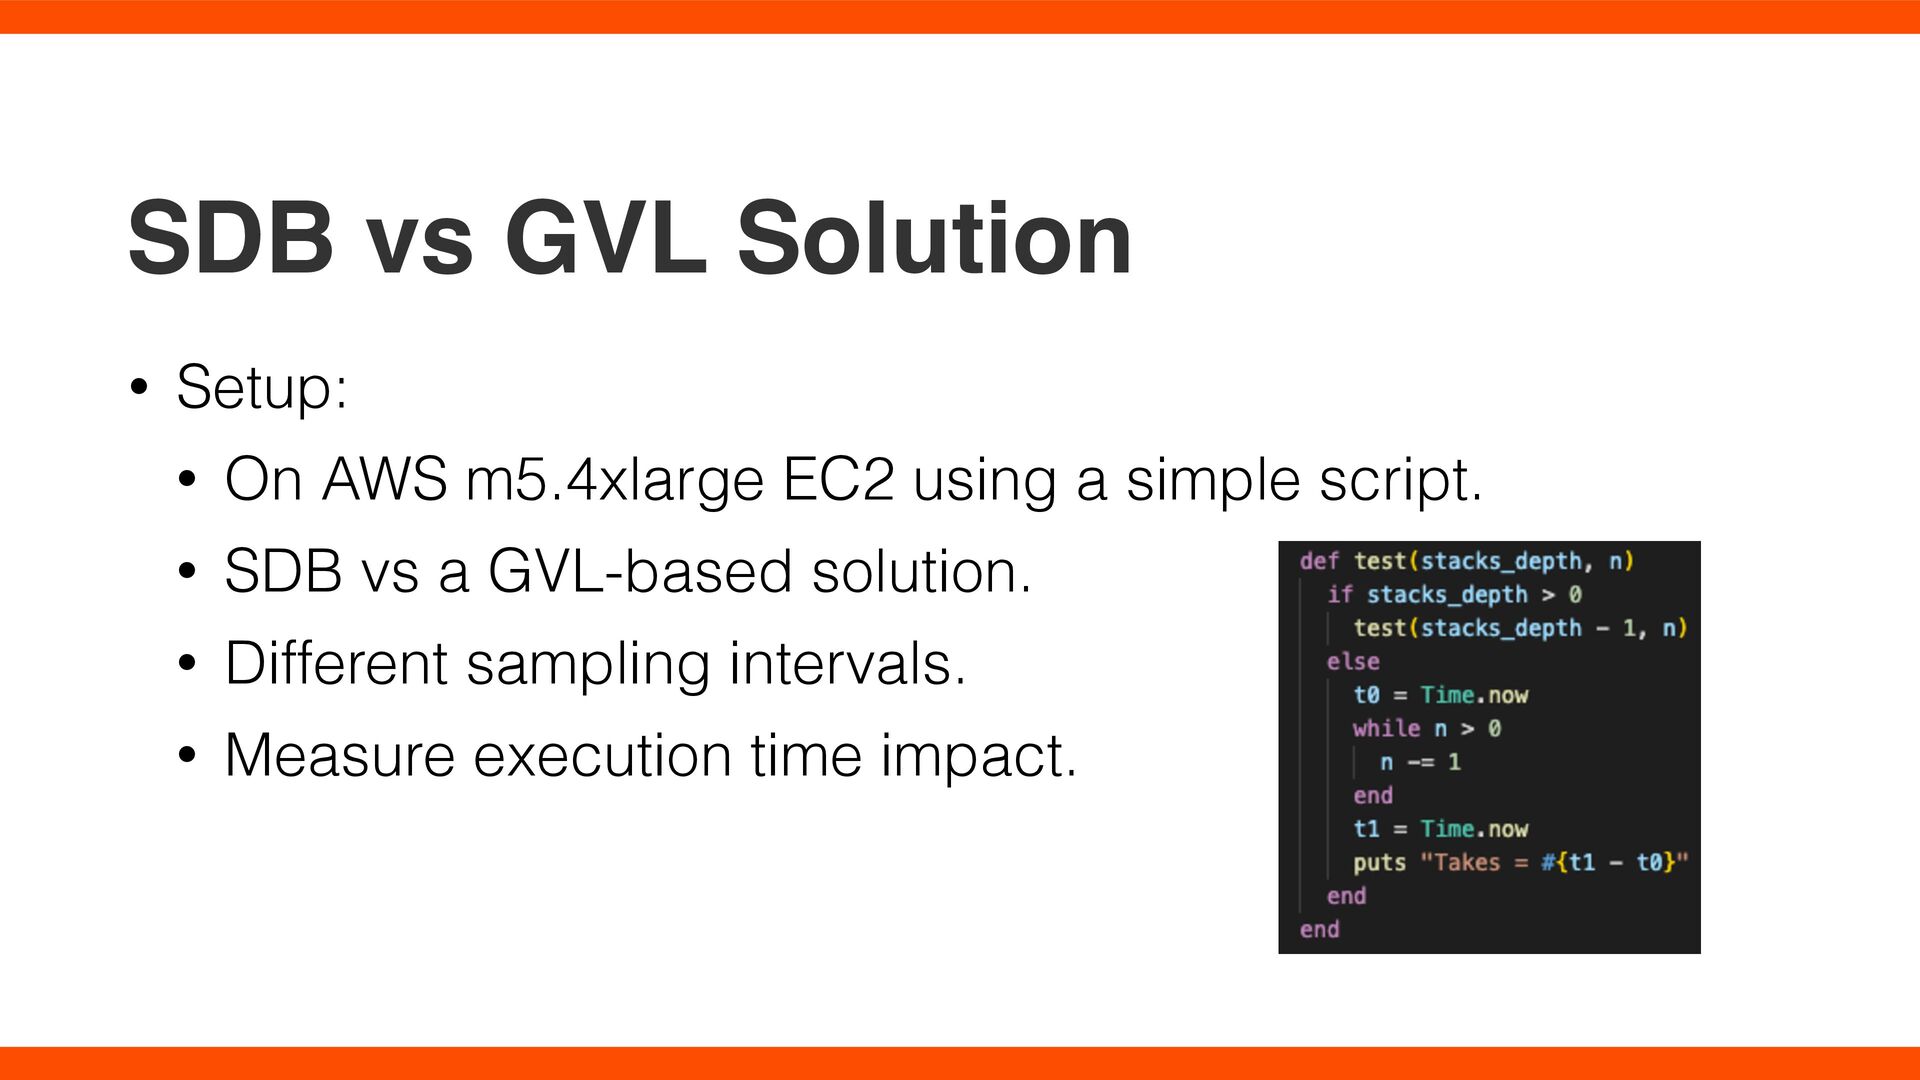
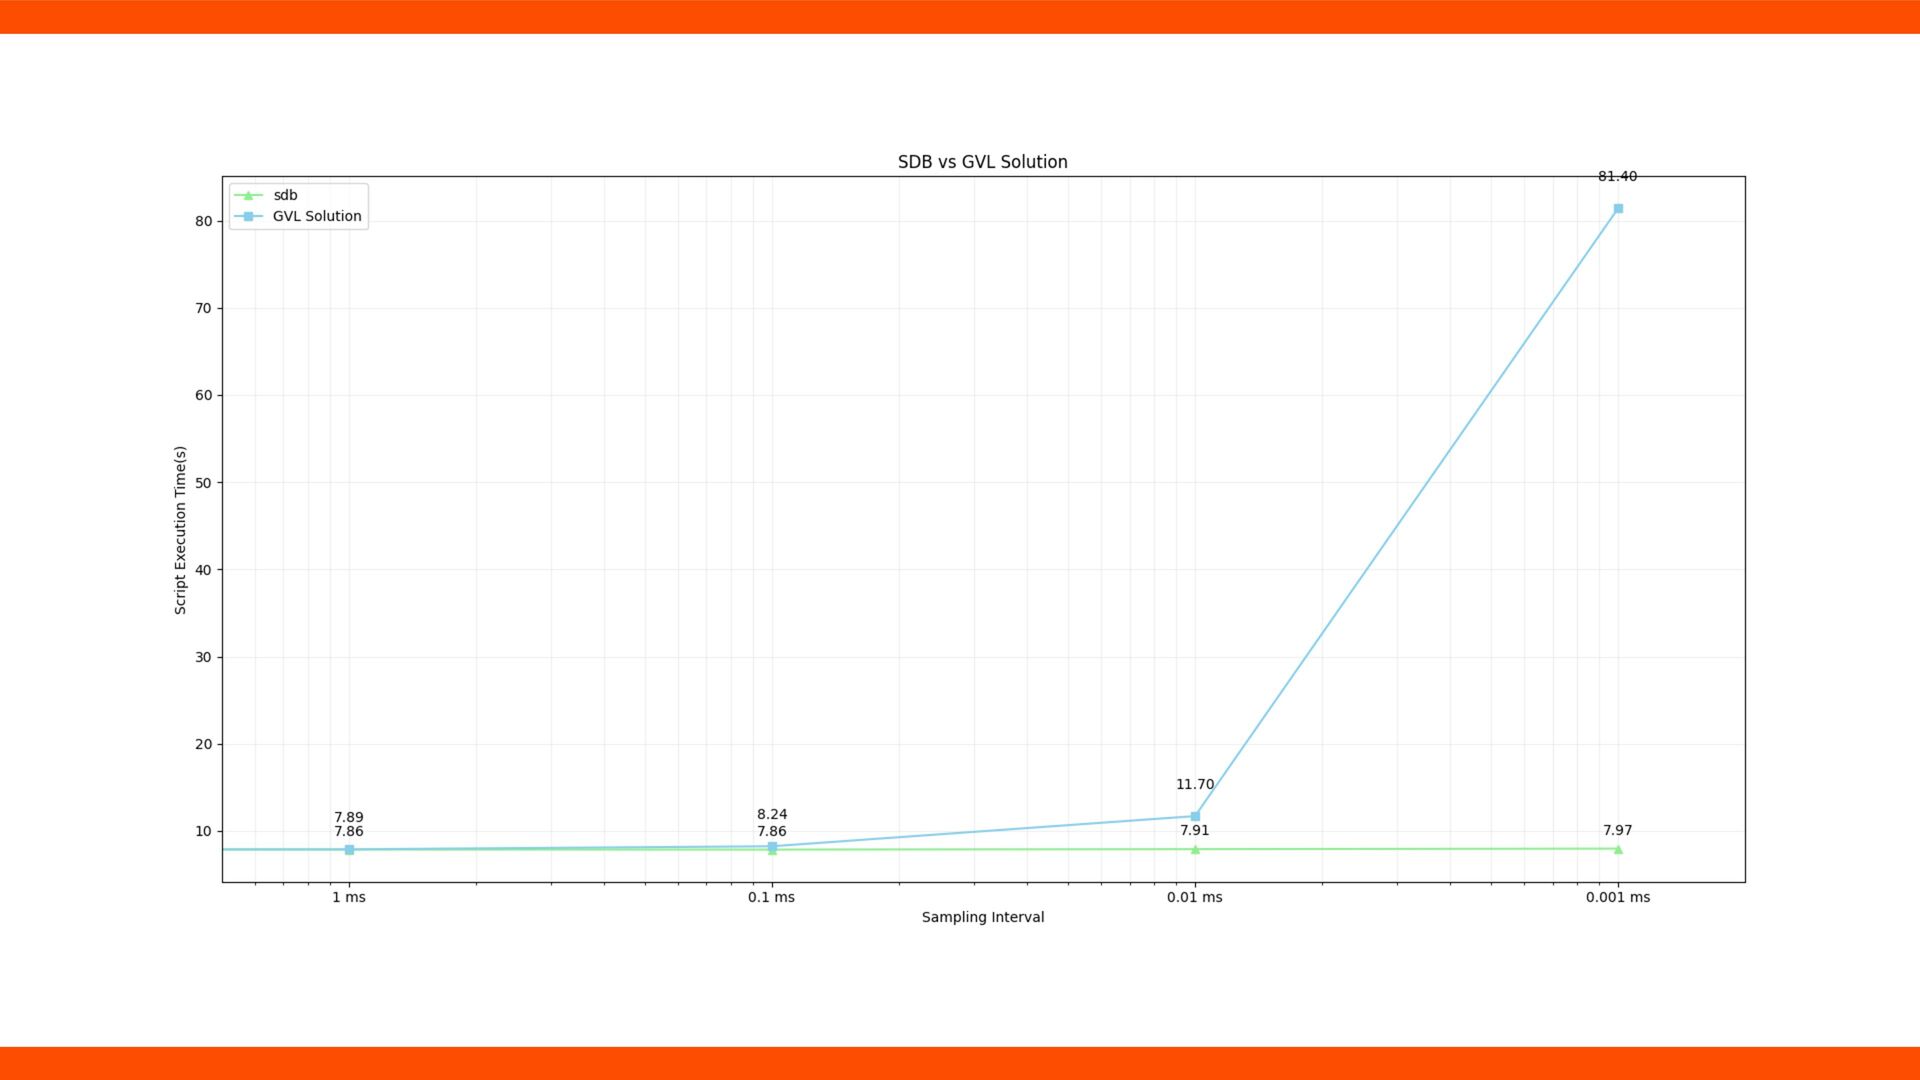
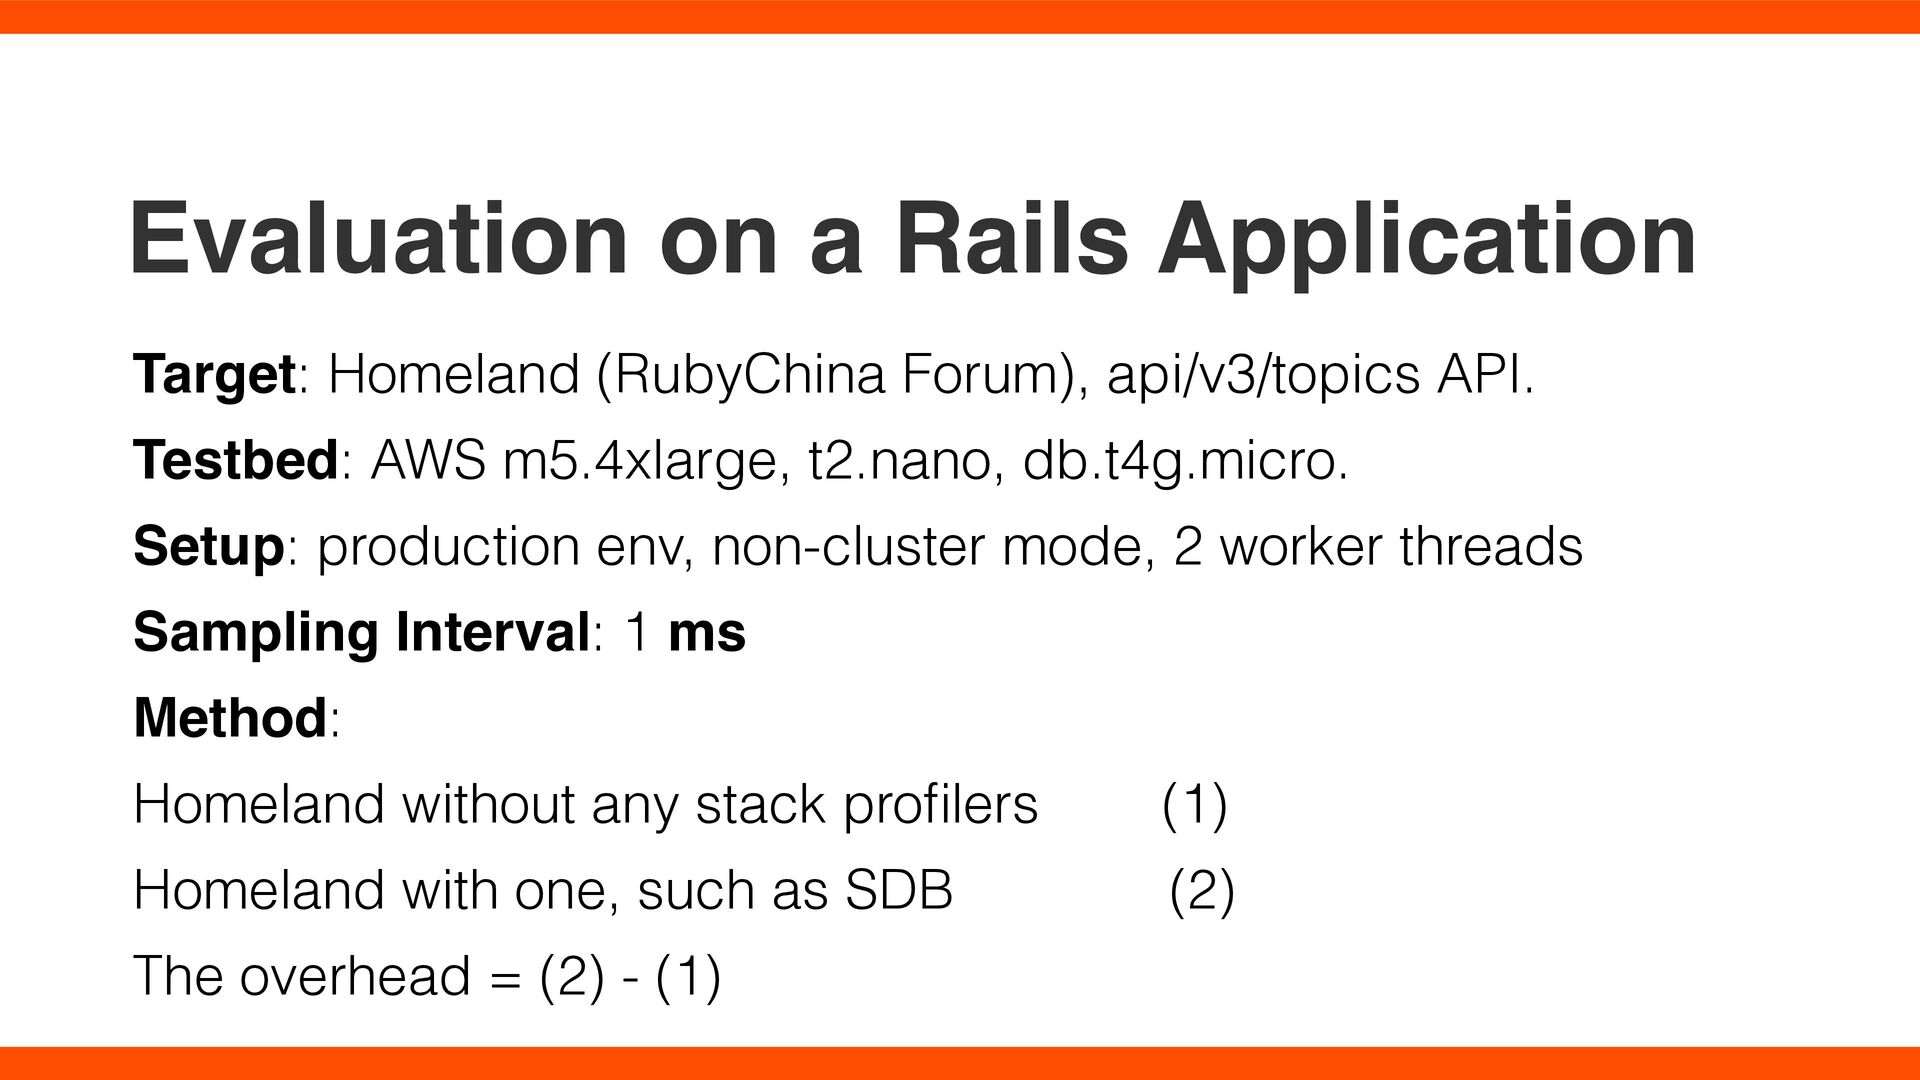
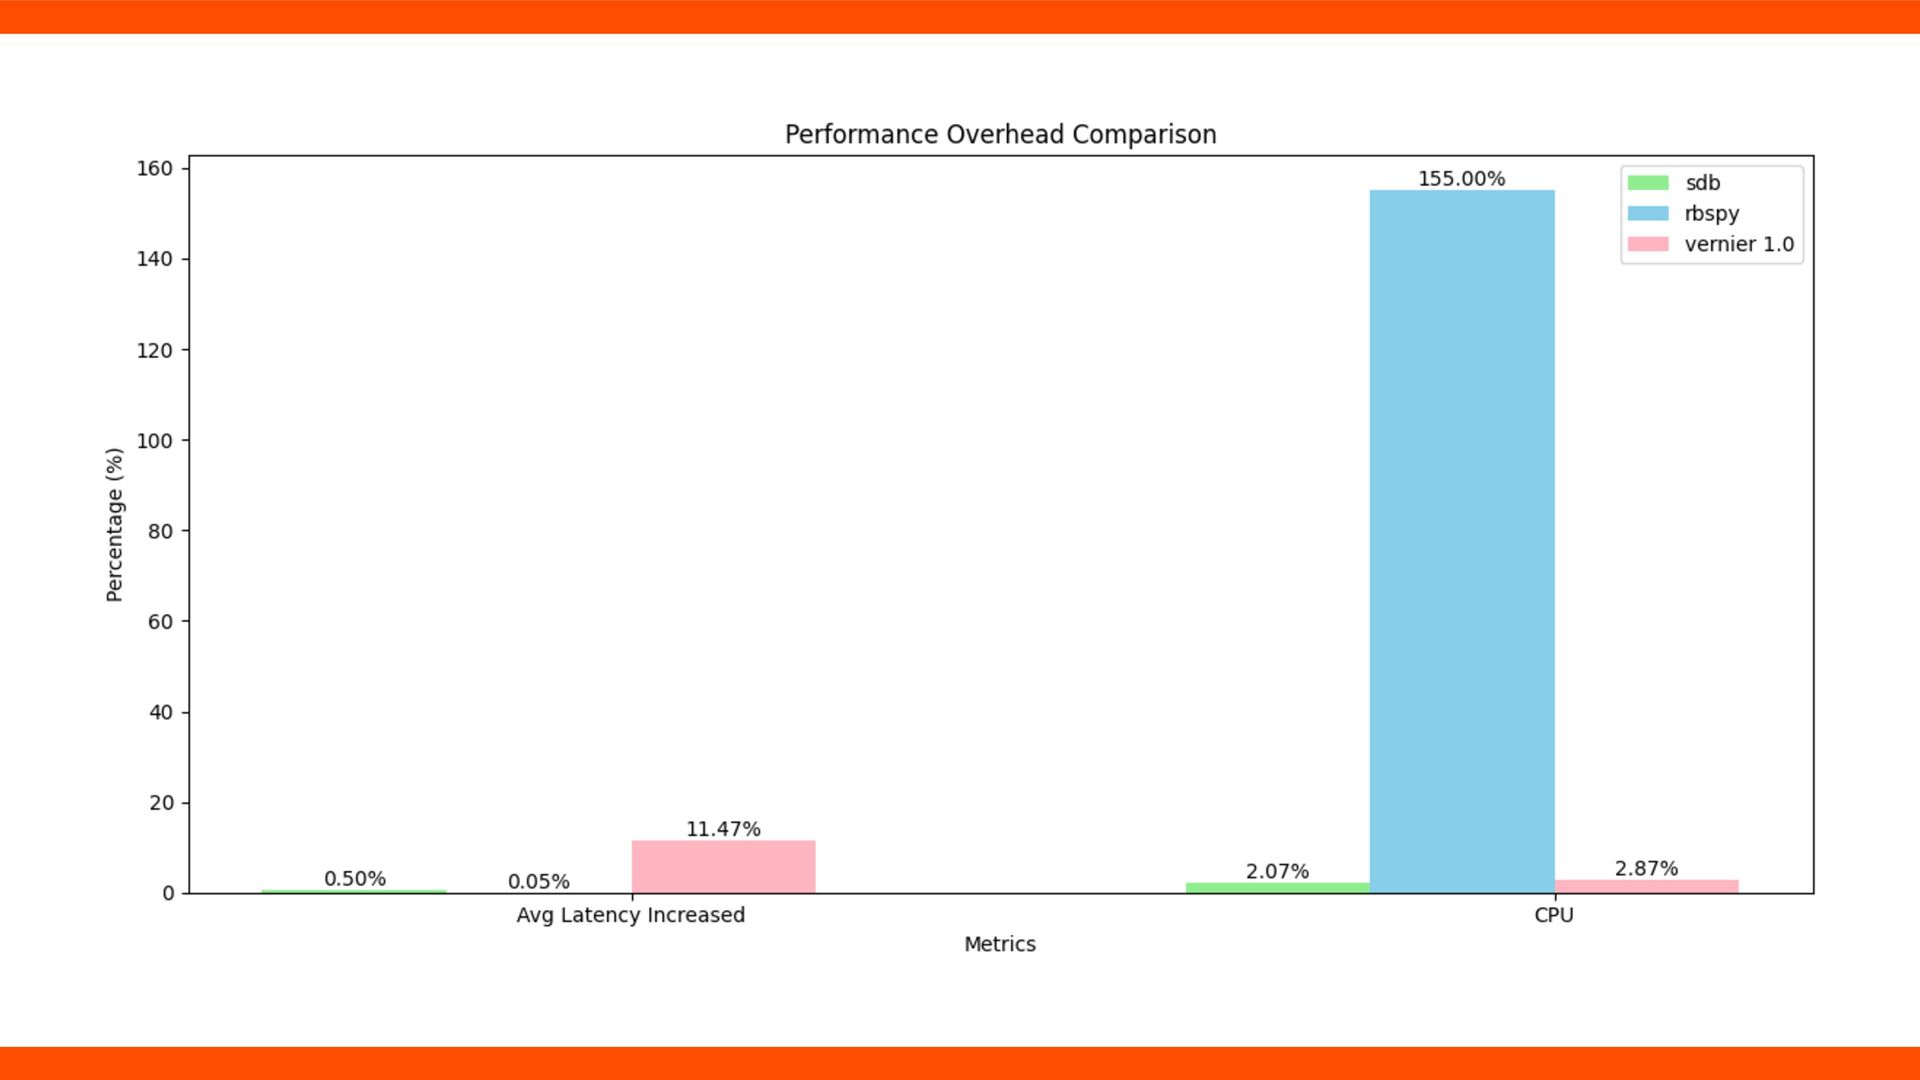
API. Testbed: AWS m5.4xlarge, t2.nano, db.t4g.micro. Setup: production env, non-cluster mode, 2 worker threads Sampling Interval: 1 ms Method: Homeland without any stack pro fi lers (1) Homeland with one, such as SDB (2) The overhead = (2) - (1)
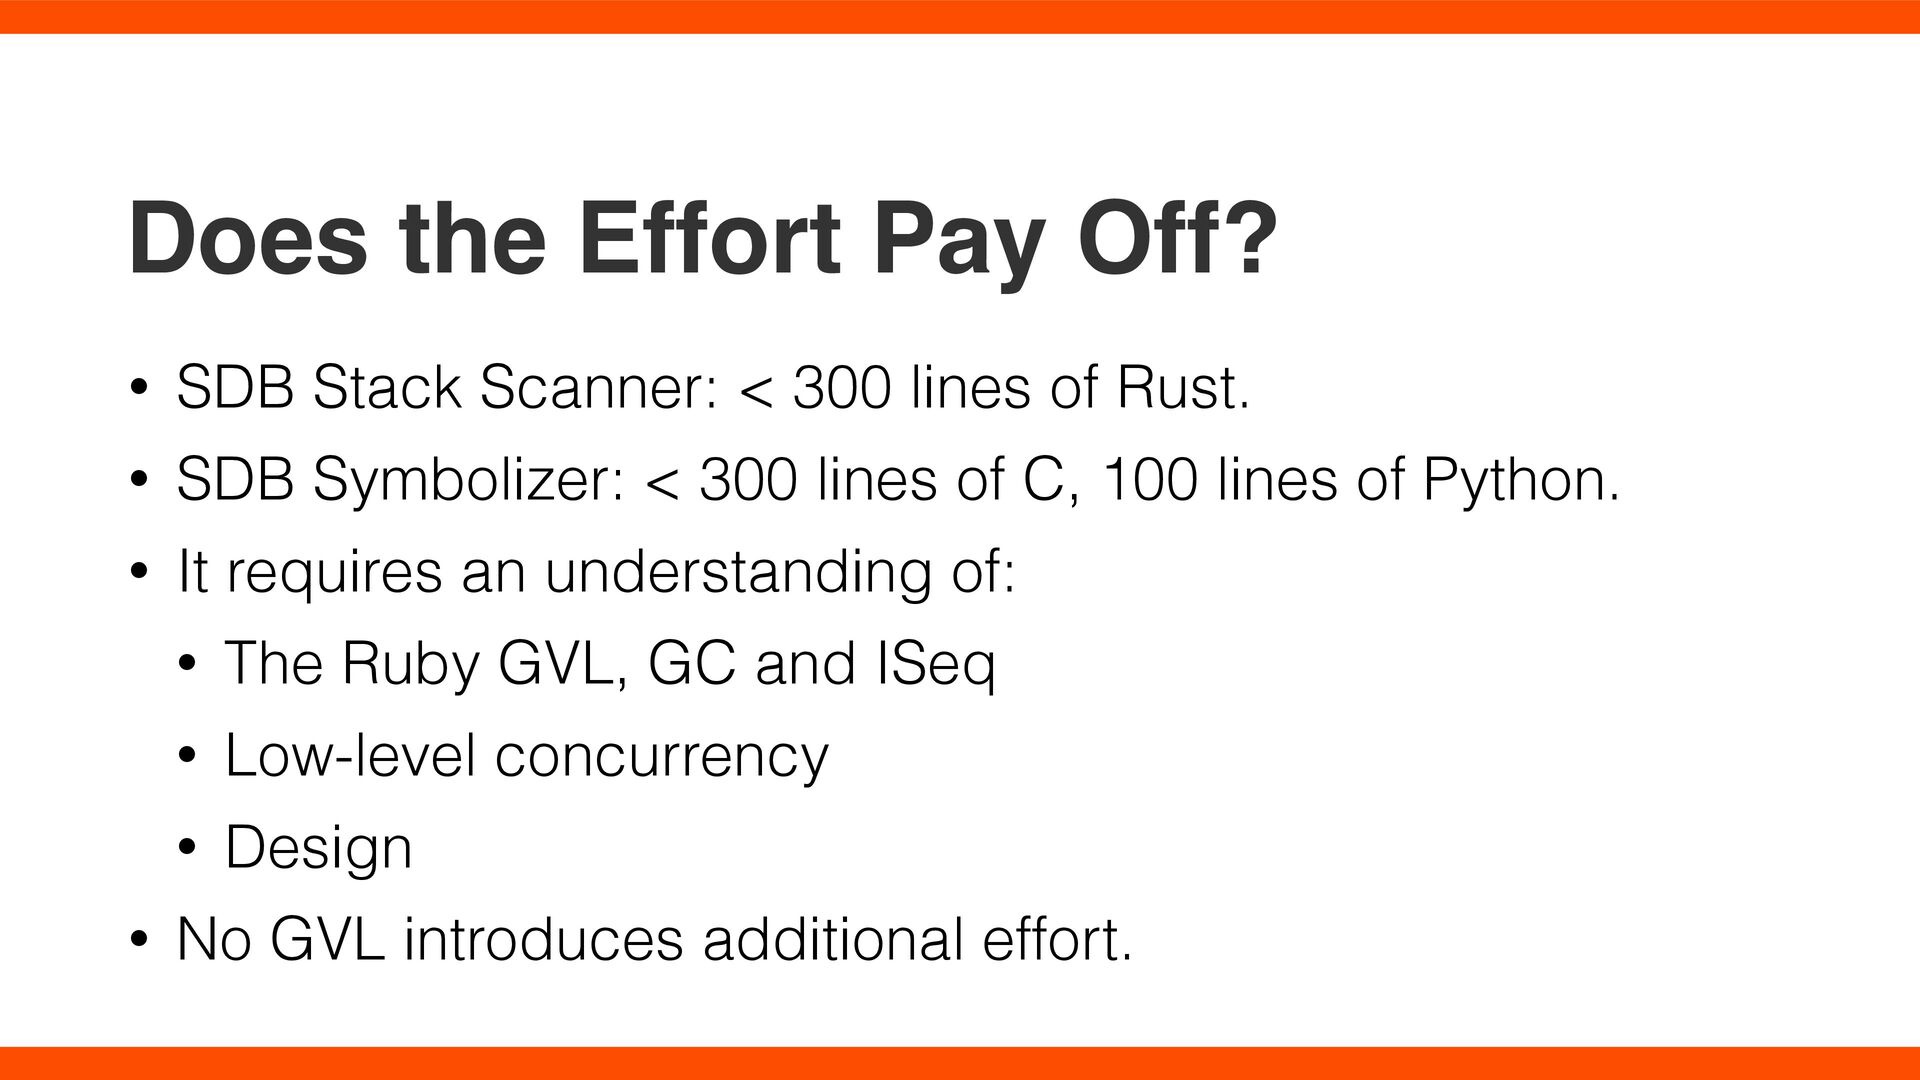
300 lines of Rust. • SDB Symbolizer: < 300 lines of C, 100 lines of Python. • It requires an understanding of: • The Ruby GVL, GC and ISeq • Low-level concurrency • Design • No GVL introduces additional effort.
library as the default solution, such as NewRelic Ruby Agent[9], Datadog Ruby Client[10], or OpenTelemetry[11]. • As instrumentation always has blind spots, people may use stack pro fi lers (Vernier[12], rbspy[4], Pf2[13]) or dynamic instrumentation (such as Datadog Dynamic Instrumentation[14]) as a complement. • Ruby stack pro fi lers may choose a low sampling rate to reduce impact due to the GVL.
effort—minimizing manual instrumentation and operations. • Collect more data for easier and more effective analysis. • Maintain low performance overhead and resource usage. Many tools focus on service-level, end-to-end latency, as it is easier to achieve and provides the most bene fi ts. Dapper[16] employs RPC libraries for tracing service latency, with similar tools including Jaeger[17], Pinpoint[18], and X-Trace[19]. DeepFlow[20] reduces manual effort by instrumenting kernel network functions via eBPF. However, these tools lack visibility inside services and rely on complementary tools like perf[21], stack pro fi lers[22], and bcc[23]. Performance and cost remain challenges—Dapper, for instance, uses sampling, but inconsistent cross-service sampling makes full trace reconstruction dif fi cult. Tail Sampling[24] and Consistent Probability Sampling[25] help mitigate this issue. Canopy[26] introduces fl exible sampling policies to balance data collection and cost.
leverages Intel PT to capture all instructions, simplifying root cause detection but generating massive data (up to 1GB/s). SHIM[28] and LDB[8] use busy-polling with lower overhead, yet LDB still consumes one CPU per process. However, in performance debugging, we do not need to track the latency of all functions —only those that dominate a request or transaction. Based on this, SDB is designed for Rails applications, using a default 1ms sampling interval, which can detect functions with 2ms or more latency—suf fi cient for most Rails applications. For example, since a typical Rails request exceeds 20ms, identifying functions contributing at least 10% of the request time is often enough. At this sampling rate, SDB requires minimal CPU usage.
GVL and it is bene fi cial. • SDB provides high sampling rate with low performance impact and CPU usage. • SDB has the potential to be a default observability solution.
https://pdos.csail.mit.edu/6.1810/2024/lec/l-rcu.txt 2. Ruby Memory Model https://docs.google.com/document/d/1pVzU8w_QF44YzUCCab990Q_WZOdhpKolCIHaiXG-sPw/edit?tab=t.0 3. Rust Atomics and Locks Low-Level Concurrency in Practice 4. rbspy: Sampling CPU pro fi ler for Ruby https://github.com/rbspy/rbspy 5. py-spy: Sampling pro fi ler for Python programs https://github.com/benfred/py-spy 6. async-pro fi ler: Sampling CPU and HEAP pro fi ler for Java https://github.com/async-pro fi ler/async-pro fi ler 7. Evaluating the accuracy of java pro fi lers. PLDI, 2010. 8. LDB: An Ef fi cient Latency Pro fi ling Tool for Multithreaded Applications. NSDI, 2024. 9. New Relic RPM Ruby Agent https://github.com/newrelic/newrelic-ruby-agent 10. Datadog Tracing Ruby Client https://github.com/DataDog/dd-trace-rb 11. OpenTelemetry Ruby https://github.com/open-telemetry/opentelemetry-ruby 12. Vernier: next generation CRuby pro fi ler https://github.com/jhawthorn/vernier 13. Pf2: A sampling-based pro fi ler for Ruby https://github.com/osyoyu/pf2 14. Datadog Dynamic Instrumentation https://docs.datadoghq.com/dynamic_instrumentation/ 15. Edited Vernier 1.0 https://github.com/yfractal/vernier/tree/v1.0.0-patch 16. Dapper, a large-scale distributed systems tracing infrastructure. Technical report, Google, Inc, 2010.
18. Pinpoint: problem determination in large, dynamic internet services. DSN, 2002. 19. X-Trace: A Pervasive Network Tracing Framework. NSDI 2007. 20. Network-Centric Distributed Tracing with DeepFlow: Troubleshooting Your Microservices in Zero Code. SIGCOMM, 2023. 21. perf: Linux pro fi ling with performance counters, 2022. https://perf.wiki.kernel.org/index.php/Main_Page. 22. Google-Wide Pro fi ling: A Continuous Pro fi ling Infrastructure for Data Centers. IEEE Micro, 2010. 23. BCC - Tools for BPF-based Linux IO analysis, networking, monitoring, and more. https://github.com/iovisor/bcc 24. Tail Sampling with OpenTelemetry: Why it’s useful, how to do it, and what to consider https://opentelemetry.io/blog/2022/tail-sampling/ 25. TraceState: Probability Sampling https://opentelemetry.io/docs/specs/otel/trace/tracestate-probability-sampling-experimental/ 26. Canopy: An End-to-End Performance Tracing And Analysis System. SOSP, 2017. 27. How to diagnose nanosecond network latencies in rich endhost stacks. NSDI, 2022. 28. Computer performance microscopy with shim. ISCA, 2015. 29. Lprof: A Non-Intrusive Request Flow Pro fi ler for Distributed Systems. OSDI, 2014. 30. Domino: Understanding Wide-Area, Asynchronous Event Causality in Web Applications. SoCC, 2015 31. NonIntrusive Performance Pro fi ling for Entire Software Stacks Based on the Flow Reconstruction Principle. OSDI 2016 32. Minder: Faulty Machine Detection for Large-scale Distributed Model Training. NSDI, 2025.
![Data Races • Actionability[7] > strict correctness. • LDB[8] uses](https://files.speakerdeck.com/presentations/1ee3ded4863b485b9a878835f73d7b6f/slide_26.jpg)
![Related Works In observability, more data reduces analysis effort. NSight[27]](https://files.speakerdeck.com/presentations/1ee3ded4863b485b9a878835f73d7b6f/slide_41.jpg)
![Related Works Many tools automate trace collection. Lprof[29] analyzes bytecode](https://files.speakerdeck.com/presentations/1ee3ded4863b485b9a878835f73d7b6f/slide_42.jpg)