Upgrade to Pro — share decks privately, control downloads, hide ads and more …

18.21_Investor_Presentation_10.18.pdf

Avatar for 18.21 Bitters 18.21 Bitters
October 26, 2018
11

 18.21_Investor_Presentation_10.18.pdf

Avatar for 18.21 Bitters

18.21 Bitters

October 26, 2018

Transcript

  1. 2

  2. 7

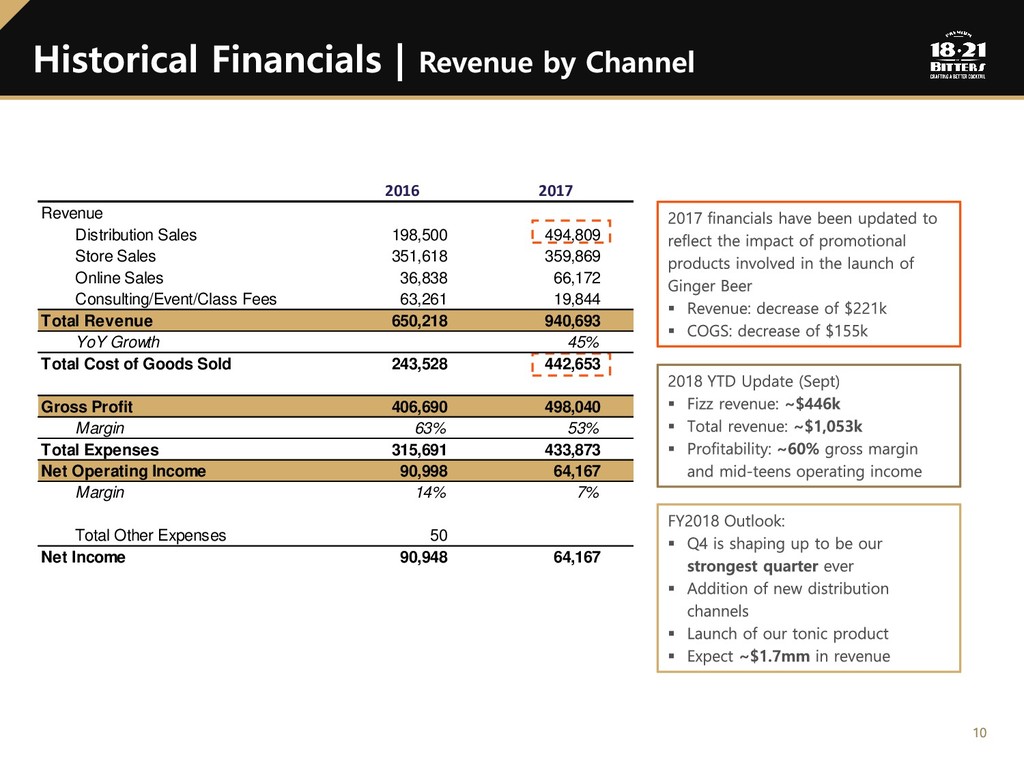
  3. 2016 2017 Revenue Distribution Sales 198,500 494,809 Store Sales 351,618

    359,869 Online Sales 36,838 66,172 Consulting/Event/Class Fees 63,261 19,844 Total Revenue 650,218 940,693 YoY Growth 45% Total Cost of Goods Sold 243,528 442,653 Gross Profit 406,690 498,040 Margin 63% 53% Total Expenses 315,691 433,873 Net Operating Income 90,998 64,167 Margin 14% 7% Total Other Expenses 50 Net Income 90,948 64,167
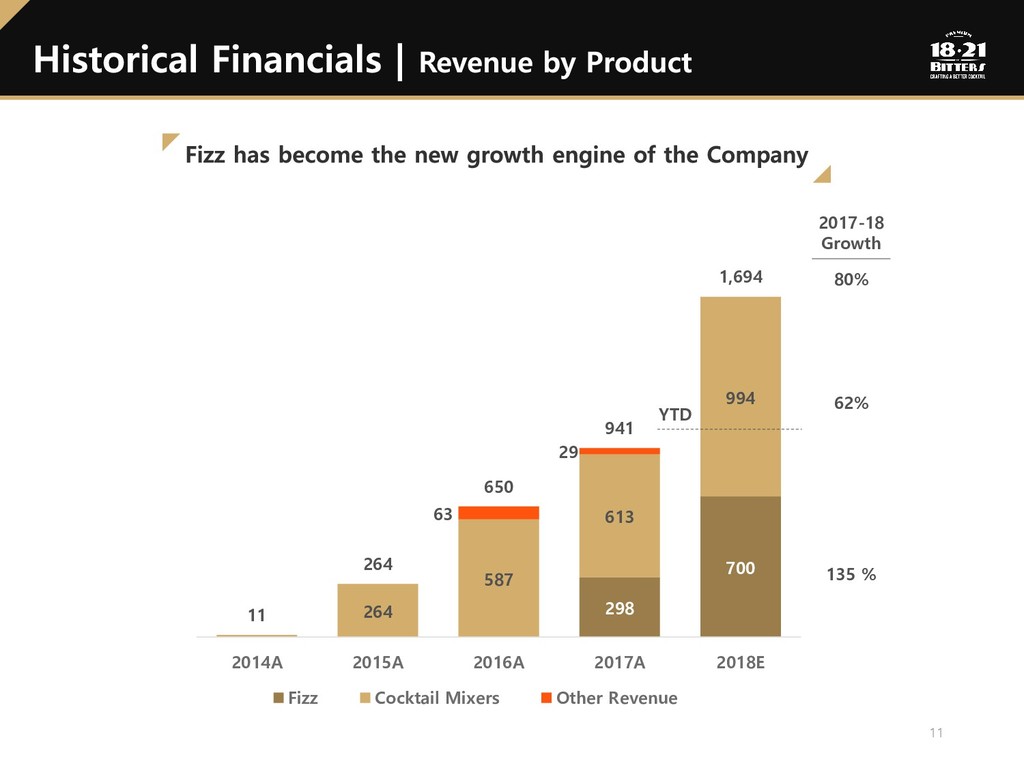
  4. 298 700 264 587 613 994 63 29 11 264

    650 941 1,694 200 400 600 800 1,000 1,200 1,400 1,600 1,800 2,000 2014A 2015A 2016A 2017A 2018E Fizz Cocktail Mixers Other Revenue 11 2017-18 Growth 62% 135 % 80% YTD
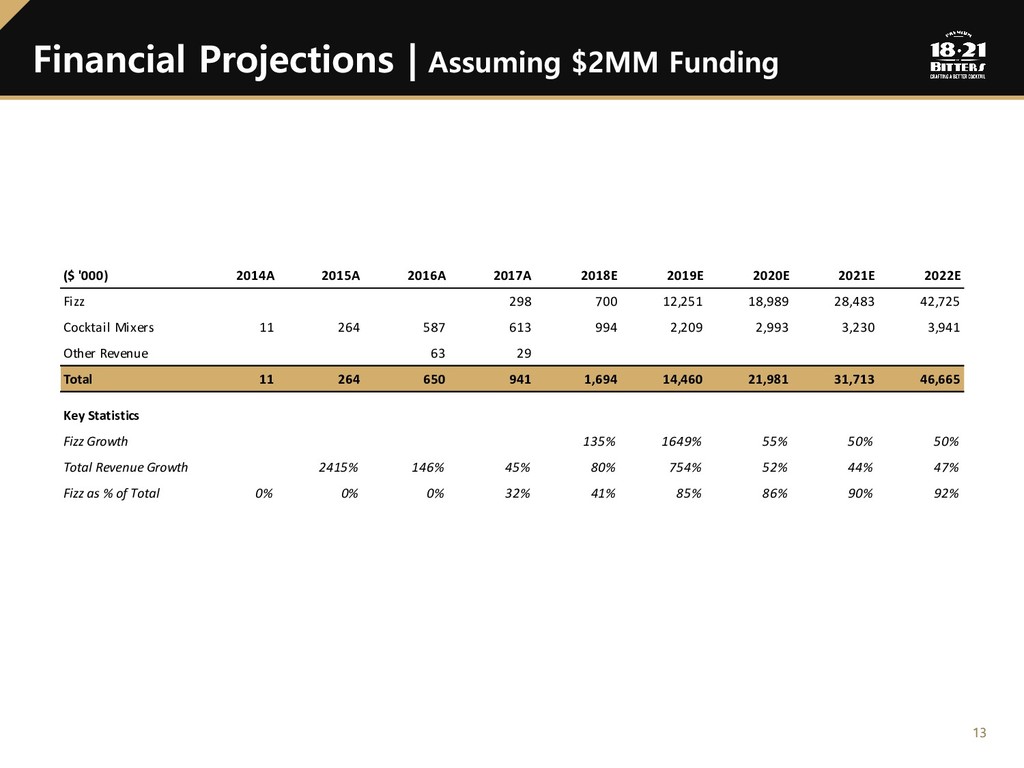
  5. ($ '000) 2014A 2015A 2016A 2017A 2018E 2019E 2020E 2021E

    2022E Fizz 298 700 12,251 18,989 28,483 42,725 Cocktail Mixers 11 264 587 613 994 2,209 2,993 3,230 3,941 Other Revenue 63 29 Total 11 264 650 941 1,694 14,460 21,981 31,713 46,665 Key Statistics Fizz Growth 135% 1649% 55% 50% 50% Total Revenue Growth 2415% 146% 45% 80% 754% 52% 44% 47% Fizz as % of Total 0% 0% 0% 32% 41% 85% 86% 90% 92%