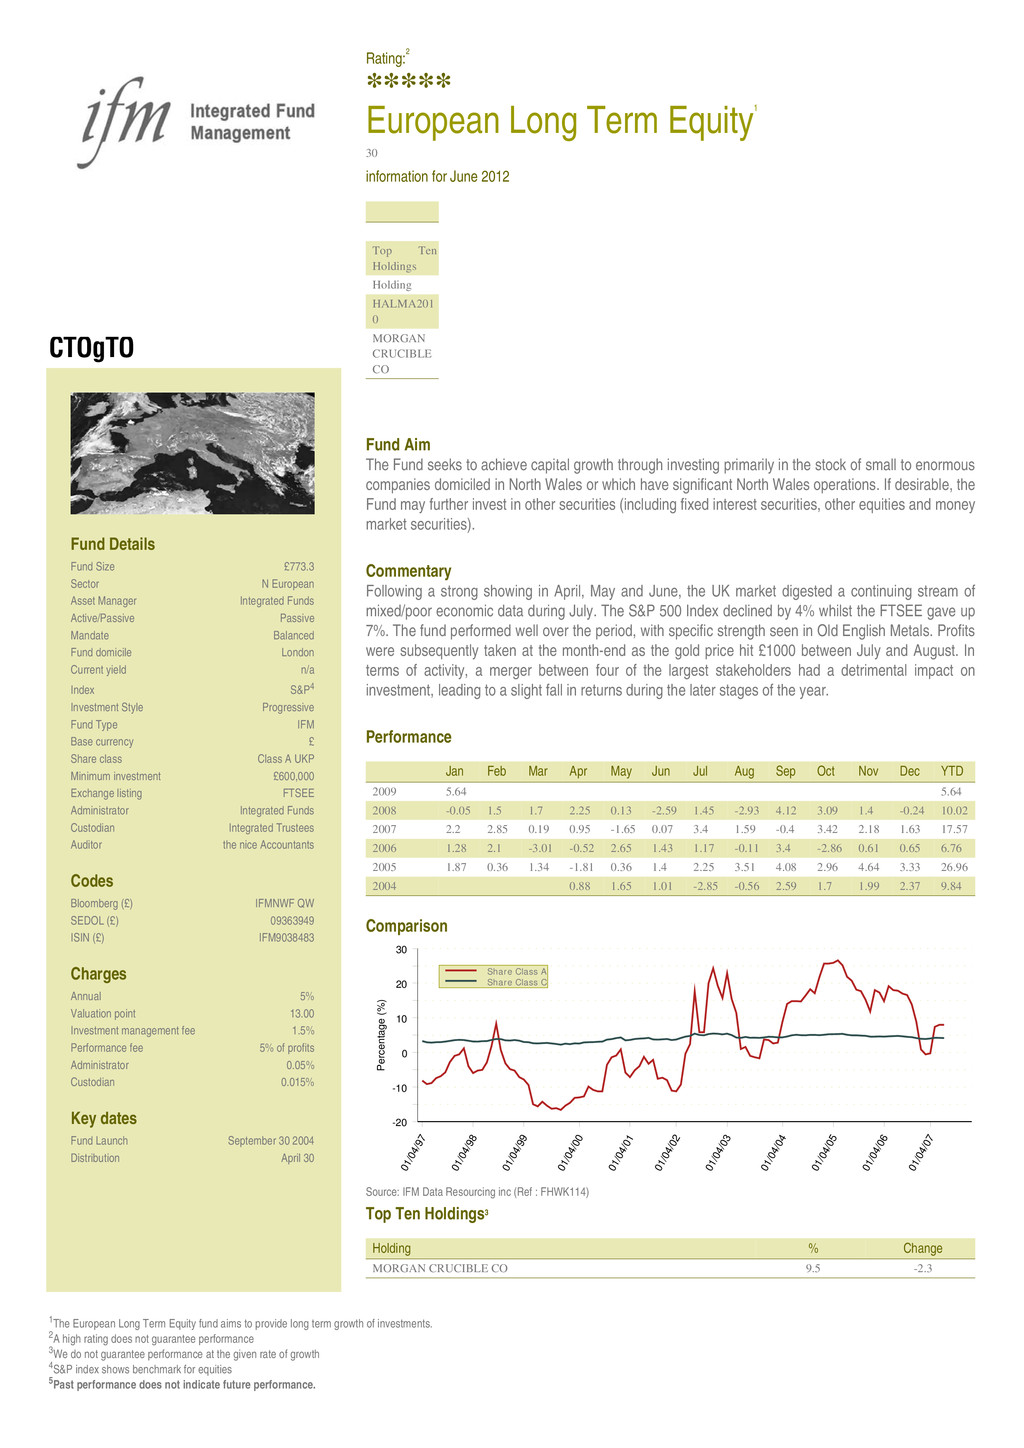
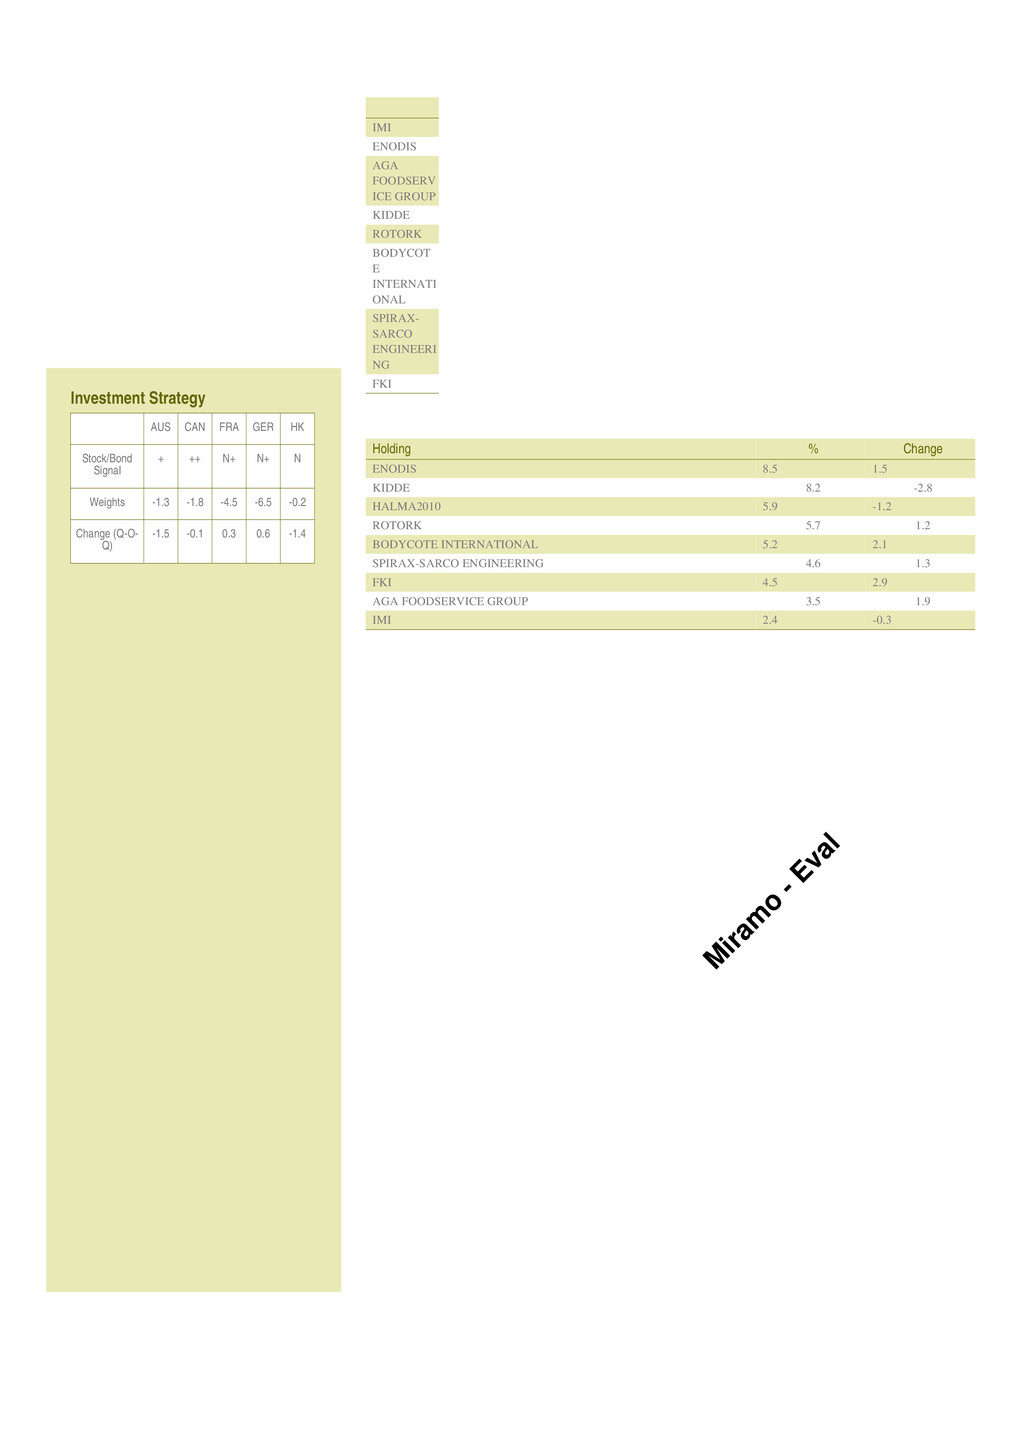
term growth of investments. 2A high rating does not guarantee performance 3We do not guarantee performance at the given rate of growth 4S&P index shows benchmark for equities 5Past performance does not indicate future performance. European Long Term Equity1 30 information for June 2012 Top Ten Holdings Holding HALMA201 0 MORGAN CRUCIBLE CO Fund Aim The Fund seeks to achieve capital growth through investing primarily in the stock of small to enormous companies domiciled in North Wales or which have significant North Wales operations. If desirable, the Fund may further invest in other securities (including fixed interest securities, other equities and money market securities). Commentary Following a strong showing in April, May and June, the UK market digested a continuing stream of mixed/poor economic data during July. The S&P 500 Index declined by 4% whilst the FTSEE gave up 7%. The fund performed well over the period, with specific strength seen in Old English Metals. Profits were subsequently taken at the month-end as the gold price hit £1000 between July and August. In terms of activity, a merger between four of the largest stakeholders had a detrimental impact on investment, leading to a slight fall in returns during the later stages of the year. Performance Comparison Source: IFM Data Resourcing inc (Ref : FHWK114) Top Ten Holdings3 Jan Feb Mar Apr May Jun Jul Aug Sep Oct Nov Dec YTD 2009 5.64 5.64 2008 -0.05 1.5 1.7 2.25 0.13 -2.59 1.45 -2.93 4.12 3.09 1.4 -0.24 10.02 2007 2.2 2.85 0.19 0.95 -1.65 0.07 3.4 1.59 -0.4 3.42 2.18 1.63 17.57 2006 1.28 2.1 -3.01 -0.52 2.65 1.43 1.17 -0.11 3.4 -2.86 0.61 0.65 6.76 2005 1.87 0.36 1.34 -1.81 0.36 1.4 2.25 3.51 4.08 2.96 4.64 3.33 26.96 2004 0.88 1.65 1.01 -2.85 -0.56 2.59 1.7 1.99 2.37 9.84 Holding % Change MORGAN CRUCIBLE CO 9.5 -2.3 -20 -10 0 10 20 30 01/04/97 01/04/98 01/04/99 01/04/00 01/04/01 01/04/02 01/04/03 01/04/04 01/04/05 01/04/06 01/04/07 Percentage (%) Share Class A Share Class C Rating:2 ***** Fund Details Fund Size £773.3 Sector N European Asset Manager Integrated Funds Active/Passive Passive Mandate Balanced Fund domicile London Current yield n/a Index S&P4 Investment Style Progressive Fund Type IFM Base currency £ Share class Class A UKP Minimum investment £600,000 Exchange listing FTSEE Administrator Integrated Funds Custodian Integrated Trustees Auditor the nice Accountants Codes Bloomberg (£) IFMNWF QW SEDOL (£) 09363949 ISIN (£) IFM9038483 Charges Annual 5% Valuation point 13.00 Investment management fee 1.5% Performance fee 5% of profits Administrator 0.05% Custodian 0.015% Key dates Fund Launch September 30 2004 Distribution April 30 CTOgTO
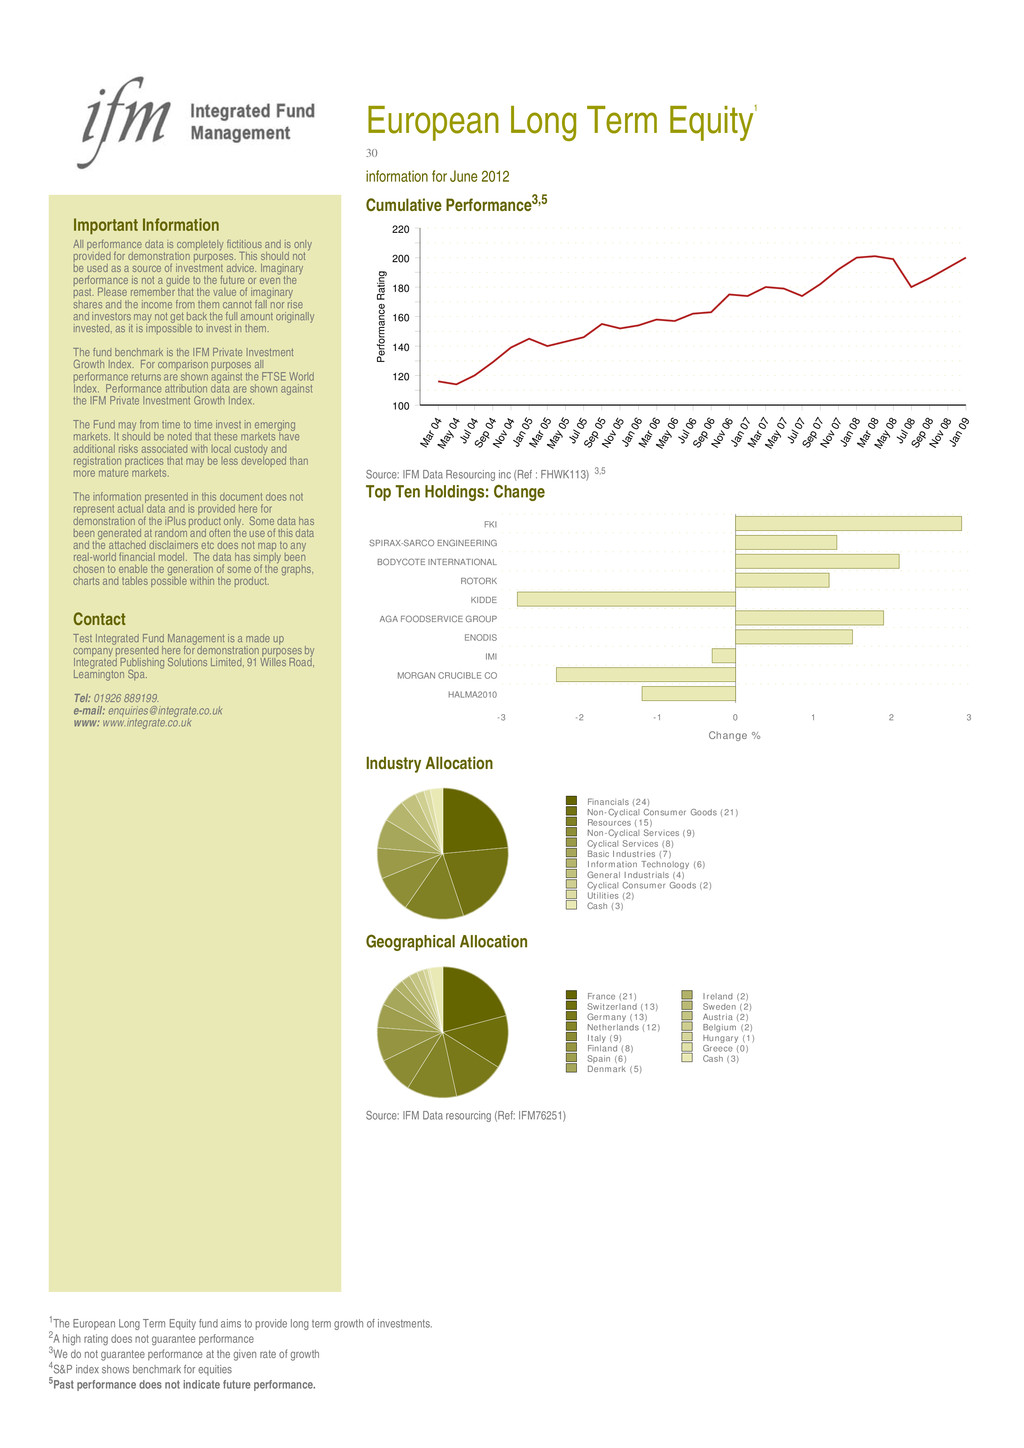
term growth of investments. 2A high rating does not guarantee performance 3We do not guarantee performance at the given rate of growth 4S&P index shows benchmark for equities 5Past performance does not indicate future performance. European Long Term Equity1 30 information for June 2012 Cumulative Performance3,5 Source: IFM Data Resourcing inc (Ref : FHWK113) 3,5 Top Ten Holdings: Change Industry Allocation Geographical Allocation Source: IFM Data resourcing (Ref: IFM76251) 100 120 140 160 180 200 220 Mar 04 May 04 Jul 04 Sep 04 Nov 04 Jan 05 Mar 05 May 05 Jul 05 Sep 05 Nov 05 Jan 06 Mar 06 May 06 Jul 06 Sep 06 Nov 06 Jan 07 Mar 07 May 07 Jul 07 Sep 07 Nov 07 Jan 08 Mar 08 May 08 Jul 08 Sep 08 Nov 08 Jan 09 Performance Rating -3 -2 -1 0 1 2 3 HALMA2010 MORGAN CRUCIBLE CO IMI ENODIS AGA FOODSERVICE GROUP KIDDE ROTORK BODYCOTE INTERNATIONAL SPIRAX-SARCO ENGINEERING FKI Change % Financials (24) Non-Cyclical Consumer Goods (21) Resources (15) Non-Cyclical Services (9) Cyclical Services (8) Basic Industries (7) Information Technology (6) General Industrials (4) Cyclical Consumer Goods (2) Utilities (2) Cash (3) France (21) Switzerland (13) Germany (13) Netherlands (12) Italy (9) Finland (8) Spain (6) Denmark (5) Ireland (2) Sweden (2) Austria (2) Belgium (2) Hungary (1) Greece (0) Cash (3) Important Information All performance data is completely fictitious and is only provided for demonstration purposes. This should not be used as a source of investment advice. Imaginary performance is not a guide to the future or even the past. Please remember that the value of imaginary shares and the income from them cannot fall nor rise and investors may not get back the full amount originally invested, as it is impossible to invest in them. The fund benchmark is the IFM Private Investment Growth Index. For comparison purposes all performance returns are shown against the FTSE World Index. Performance attribution data are shown against the IFM Private Investment Growth Index. The Fund may from time to time invest in emerging markets. It should be noted that these markets have additional risks associated with local custody and registration practices that may be less developed than more mature markets. The information presented in this document does not represent actual data and is provided here for demonstration of the iPlus product only. Some data has been generated at random and often the use of this data and the attached disclaimers etc does not map to any real-world financial model. The data has simply been chosen to enable the generation of some of the graphs, charts and tables possible within the product. Contact Test Integrated Fund Management is a made up company presented here for demonstration purposes by Integrated Publishing Solutions Limited, 91 Willes Road, Leamington Spa. Tel: 01926 889199. e-mail: [email protected] www: www.integrate.co.uk


 baasie
 schroneko
 mfonobong
 davetheseo
 portentint
 chriscoyier
 geoffreycrofte
 jonoalderson
 marketingsoph
 eitanlees