$30 off During Our Annual Pro Sale. View Details »

How to run a stable benchmark

How to run a stable benchmark

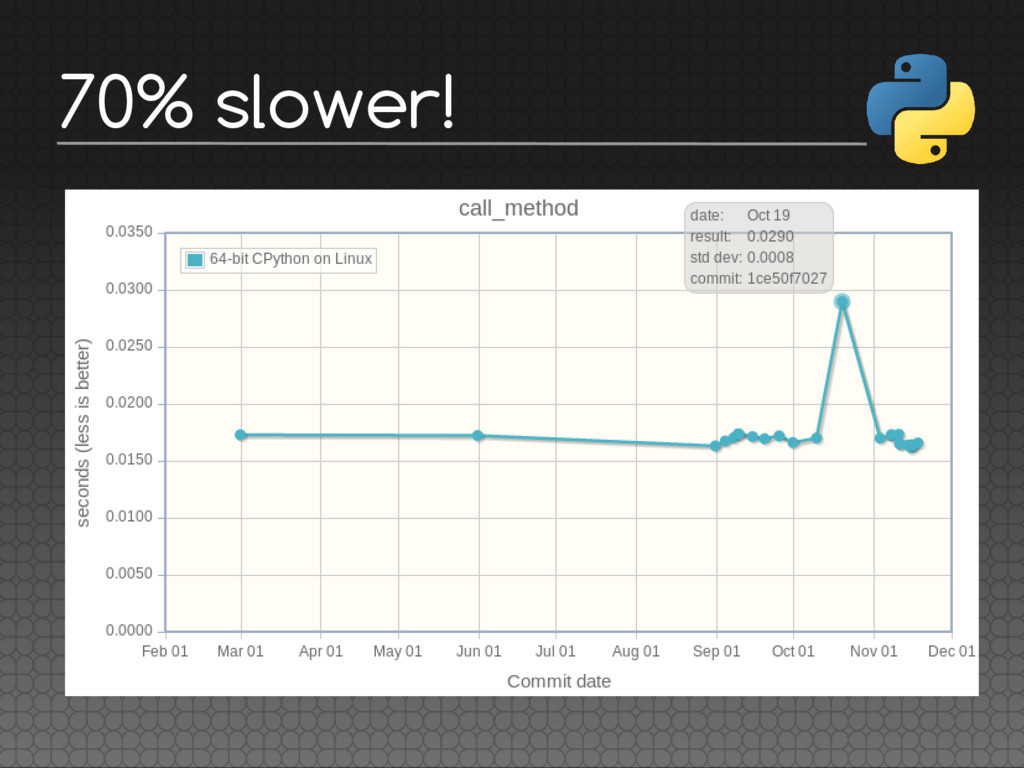
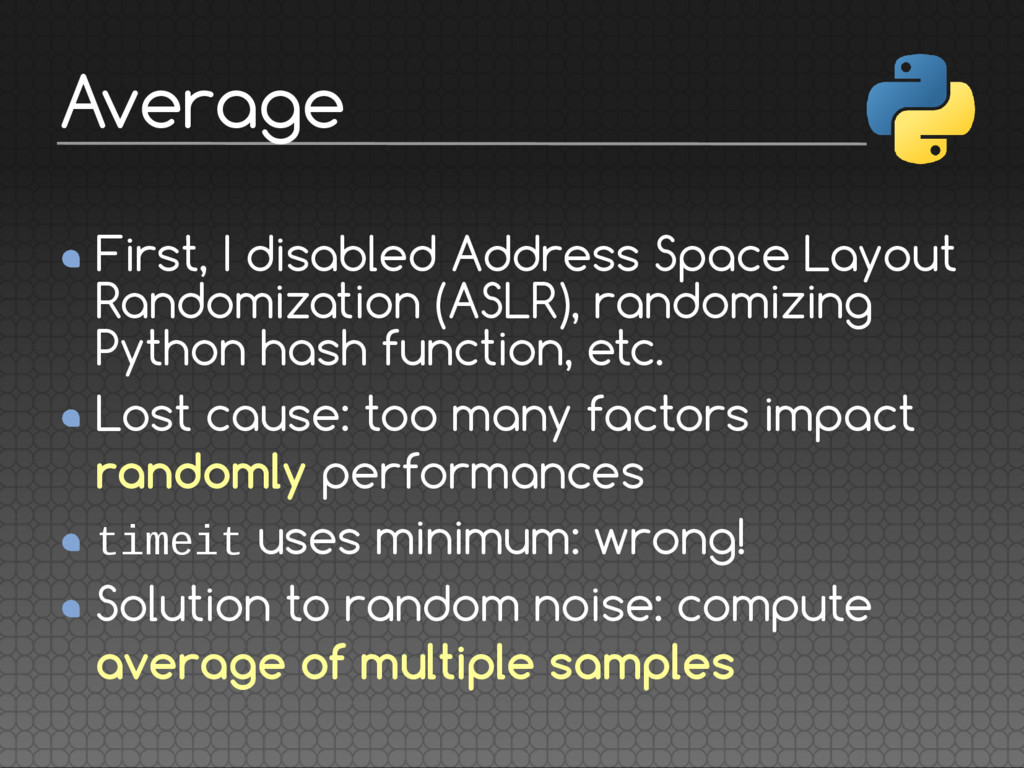
Working on optimizations is a task more complex than expected on the first look. Any optimization must be measured to make sure that, in practice, it speeds up the application task. Problem: it is very hard to obtain stable benchmark results.

The stability of a benchmark (performance measurement) is essential to be able to compare two versions of the code and compute the difference (faster or slower?). An unstable benchmark is useless, and is a risk of giving a false result when comparing performance which could lead to bad decisions.

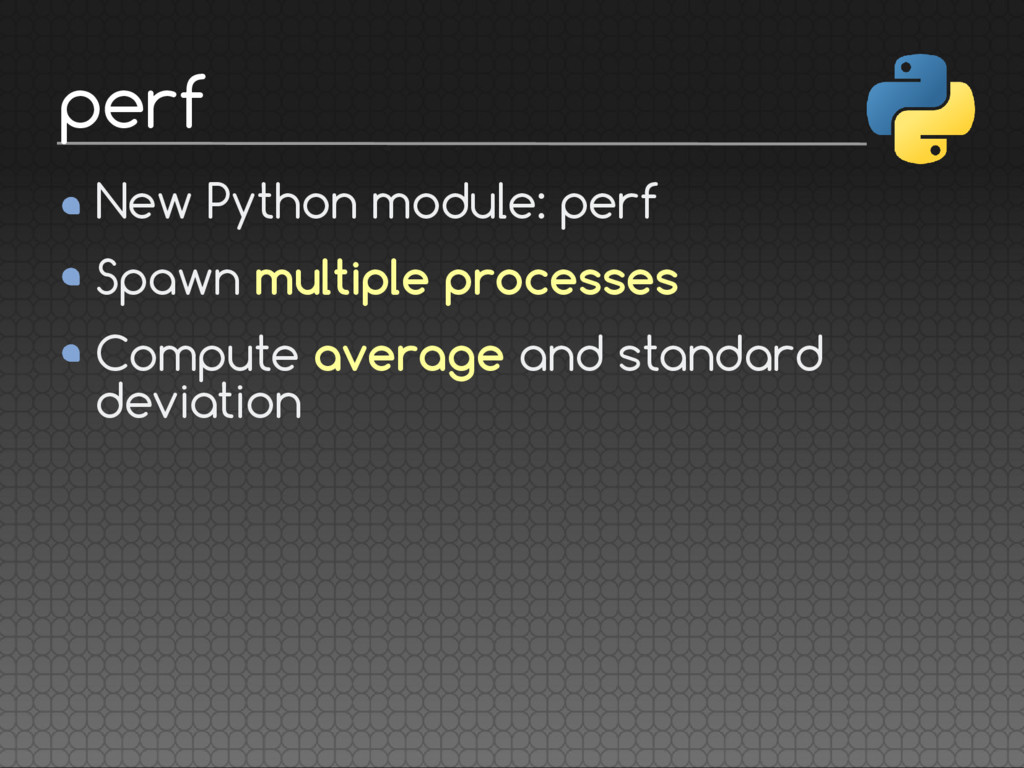
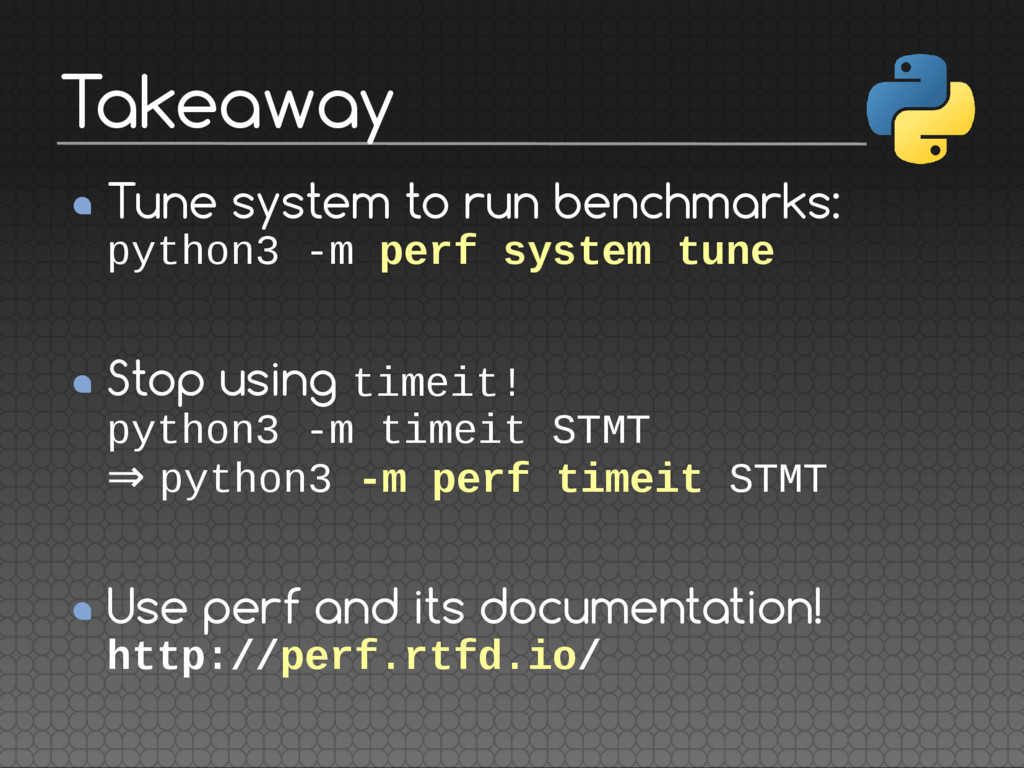
I'm gonna show you the Python project "perf" which helps to launch benchmarks, but also to analyze them: compute the mean and the standard deviation on multiple runs, render an histogram to visualize the probability curve, compare between multiple results, run again a benchmark to collect more samples, etc.

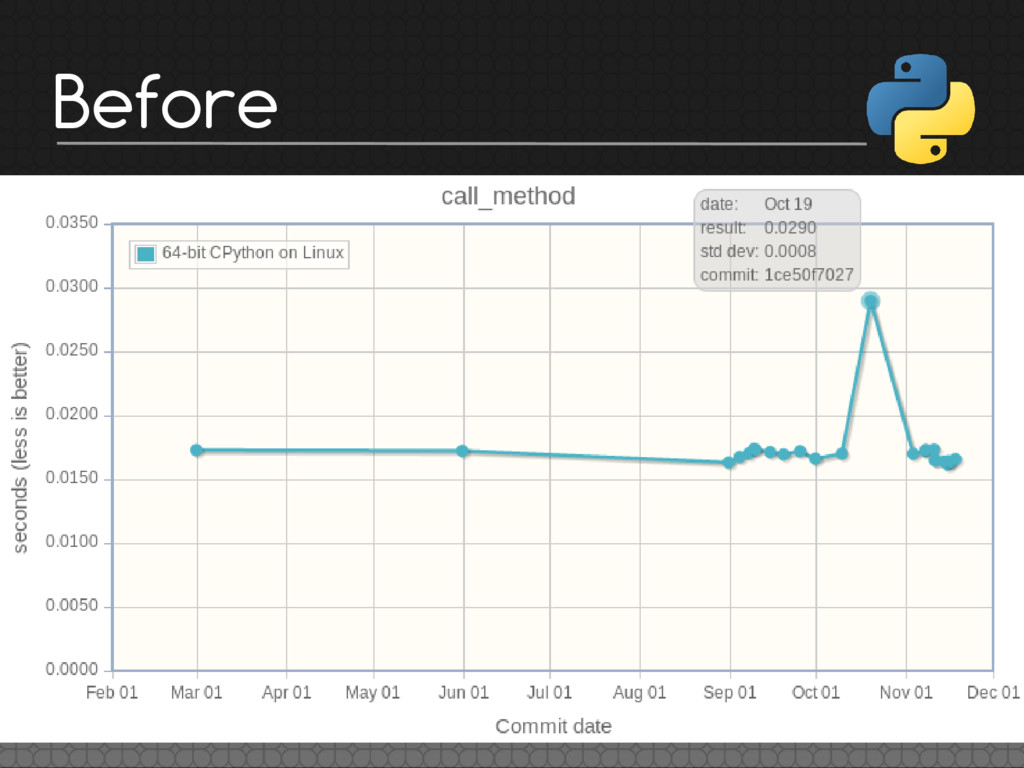
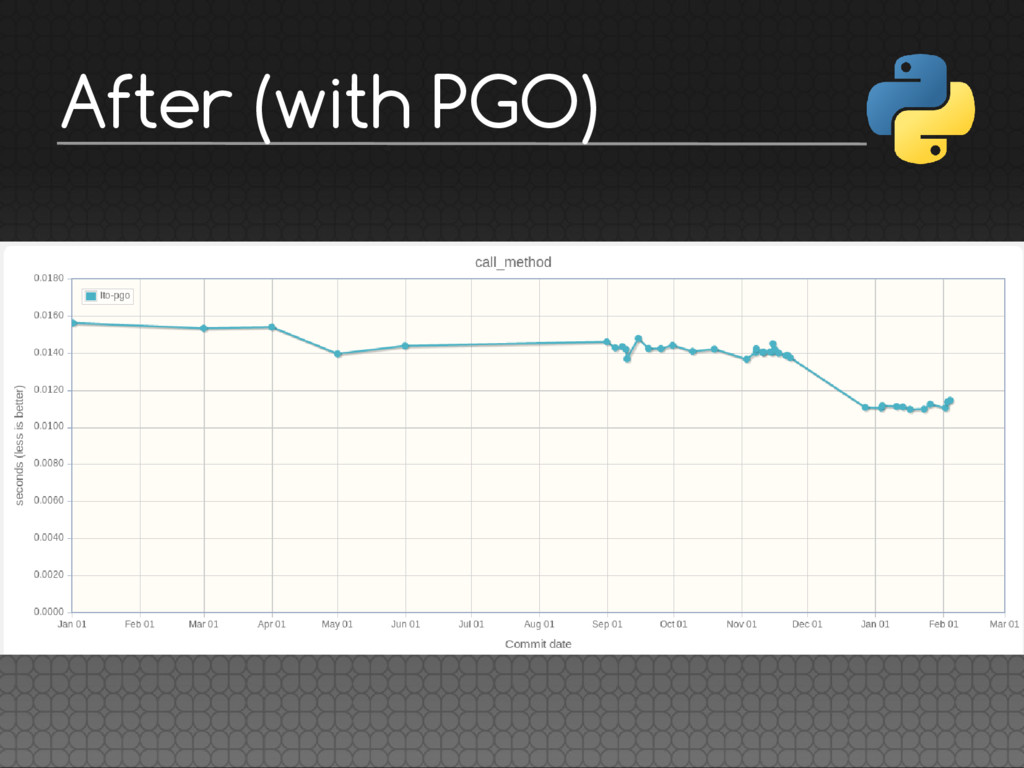
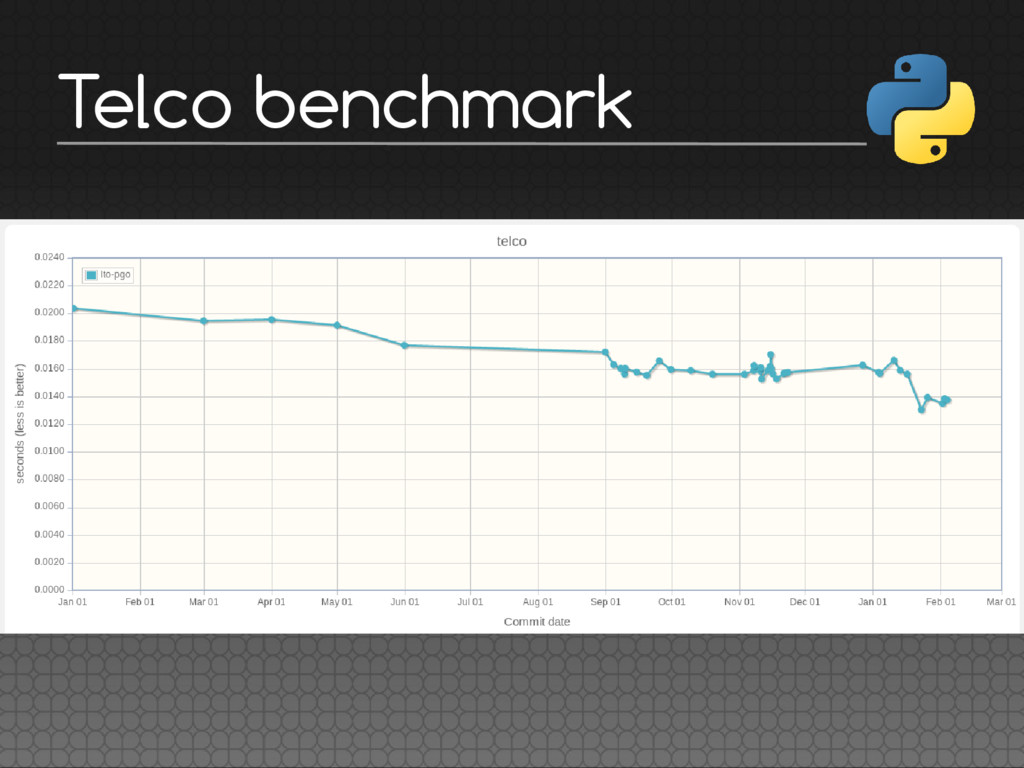
The use case is to measure small isolated optimizations on CPython and make sure that they don't introduce performance regression in term of performance.

Victor Stinner

February 05, 2017
Tweet

More Decks by Victor Stinner

Other Decks in Programming

Transcript

  1. FOSDEM 2017, Brussels Victor Stinner
    [email protected]
    How to run stable
    benchmarks

    View Slide

  2. In 2014, int+int optimization proposed:
    14 patches, many authors
    Is is faster? Is it worth it?
    The Grand Unified Python Benchmark
    Suite
    Sometimes slower, sometimes faster
    Unreliable and unstable benchmarks?
    BINARY_ADD optim

    View Slide

  3. Unstable benchmarks lead to bad
    decisions
    Patch makes Python faster, slower or…
    is not significant?
    Need reproductible benchmark
    results on the same computer
    Goal

    View Slide

  4. WTF meter

    View Slide

  5. CPU-bound microbenchmark:
    python3 -m timeit 'sum(range(10**7))'
    Idle system: 229 ms
    Busy system: 372 ms (1.6x slower, +62%)
    python3 -c 'while True: pass'
    WTF?
    System & noisy apps

    View Slide

  6. System and applications share same
    CPUs , memory and storage
    Linux kernel isolcpus=3 don’t schedule
    processes on CPU 3
    Pin a process to a CPU:
    taskset -c 3 python3 script.py
    Idle system: 229 ms
    Busy system, isolated CPU: 230 ms!
    Isolated CPUs

    View Slide

  7. Enter GRUB, modify Linux command line
    to add: isolcpus=3
    nohz_full=3: if only 0 or 1 process
    running on CPU 3, disable all
    interruptions on this CPU (WARNING: see
    later!)
    rcu_nocbs=3: don’t run kernel code on
    CPU 3
    NOHZ_FULL & RCU

    View Slide

  8. April 2016, experimental change to
    avoid temporary tuple to call functions
    Builtin functions 20-50% faster!
    But some slower benchmarks
    20,000 lines patch reduced to adding
    two unused functions... still slower.
    WTF??
    FASTCALL optim

    View Slide

  9. Reference:
    1201.0 ms +/- 0.2 ms
    Add 2 unused functions:
    1273.0 ms +/- 1.8 ms (slower!)
    Add 1 empty unused function:
    1169.6 ms +/- 0.2 ms (faster!)
    Deadcode

    View Slide

  10. Deadcode

    View Slide

  11. Root cause: code placement
    Memory layout and function
    addresses impact CPU cache usage
    It’s very hard to get the best
    placement and so reproductible
    benchmarks
    Code placement

    View Slide

  12. 70% slower!

    View Slide

  13. Profiled Guided Optimizations (PGO):
    ./configure --with-optimizations
    (1) Compile with instrumentation
    (2) Run the test suite to collect
    statistics on branches and code paths
    (hot code)
    (3) Use statistics to recompile Python
    PGO fix deadcode

    View Slide

  14. Hash function randomized by default.
    PYTHONHASHSEED=1: 198 ms
    PYTHONHASHSEED=3: 207 ms (slower!)
    PYTHONHASHSEED=4: 187 ms (faster!)
    WTF???
    Different number of hash collisions
    Python hash function

    View Slide

  15. Performance also impacted by:
    Unused environment variables
    Current working directory
    Unused command line arguments
    etc.
    More fun

    View Slide

  16. WTF????

    View Slide

  17. First, I disabled Address Space Layout
    Randomization (ASLR), randomizing
    Python hash function, etc.
    Lost cause: too many factors impact
    randomly performances
    timeit uses minimum: wrong!
    Solution to random noise: compute
    average of multiple samples
    Average

    View Slide

  18. New Python module: perf
    Spawn multiple processes
    Compute average and standard
    deviation
    perf

    View Slide

  19. Everything was fine for days, until... the
    new drama
    Suddenly, a benchmark became 20%
    faster
    WHAT-THE-FUCK ?????
    New drama

    View Slide

  20. Since 2005, the frequency of Intel CPUs
    changes anytime for various reasons:
    Workload
    CPU temperature
    and… the number of active cores
    Modern Intel CPUs

    View Slide

  21. Turbo Button?

    View Slide

  22. My laptop: 4 cores (HyperThreading)
    2-4 active cores: 3.4 GHz
    1 active core: 3.6 GHz (+5%)
    sudo cpupower frequency-info
    Disable Turbo Boost in BIOS, or write 1
    into:
    /sys/devices/system/cpu/
    intel_pstate/no_turbo
    Turbo Boost

    View Slide

  23. I ran different benchmarks for days
    and even for weeks
    Everything was SUPER STABLE
    And now?

    View Slide

  24. Stable benchmarks!

    View Slide

  25. But…
    … one friday afternoon after I closed
    my GNOME session
    … the benchmark became 2.0x faster
    WTF?????? (sorry, this one should
    really be the last one… right?)
    Nightmare never ends

    View Slide

  26. Nightmare never ends

    View Slide

  27. System and noisy apps: isolcpus
    Deadcode, code placement: PGO
    ASLR, Python hash function, env vars,
    cmdline, ...: average + std dev
    Turbo Boost: disable TB
    Let me recall

    View Slide

  28. CPU temperature?

    View Slide

  29. CPU temperature?

    View Slide

  30. nohz_full=3 (…) disables all
    interruptions
    intel_pstate and intel_idle CPU drivers
    registers a scheduler callback
    No interruption means no scheduler
    interruption (LOC in /proc/interrupts)
    CPU 3 Pstate doesn’t depend on
    isolated CPUs workload, but other
    CPUs workload
    NOHZ_FULL and Pstate

    View Slide

  31. intel_pstate and intel_idle drivers
    maintainer never tried NOHZ_FULL
    Linux real time (RT) developers: « it’s
    not a bug, it’s a feature! »
    ⇒ Use a fixed CPU frequency
    ⇒ or: don’t use NOHZ_FULL
    NOHZ_FULL and Pstate

    View Slide

  32. Tune system to run benchmarks:
    python3 -m perf system tune
    Stop using timeit!
    python3 -m timeit STMT
    ⇒ python3 -m perf timeit STMT
    Use perf and its documentation!
    http://perf.rtfd.io/
    Takeaway

    View Slide

  33. Before

    View Slide

  34. After (with PGO)

    View Slide

  35. Telco benchmark

    View Slide

  36. http://perf.rtfd.io/
    https://github.com/python/performance/
    https://speed.python.org/
    Questions?
    Victor Stinner
    [email protected]

    View Slide

  37. Collect metadata: CPU speed, uptime,
    Python version, kernel task#, …
    Compare two results, check if
    significant
    Stats: min/max, mean/median,
    sample#, …
    Dump all timings including warmup
    Check stability, render histogram, …
    Perf features

    View Slide