Upgrade to Pro — share decks privately, control downloads, hide ads and more …

Fighting Gerrymandering with PyMC3

Karin Knudson
May 12, 2018
250

Fighting Gerrymandering with PyMC3

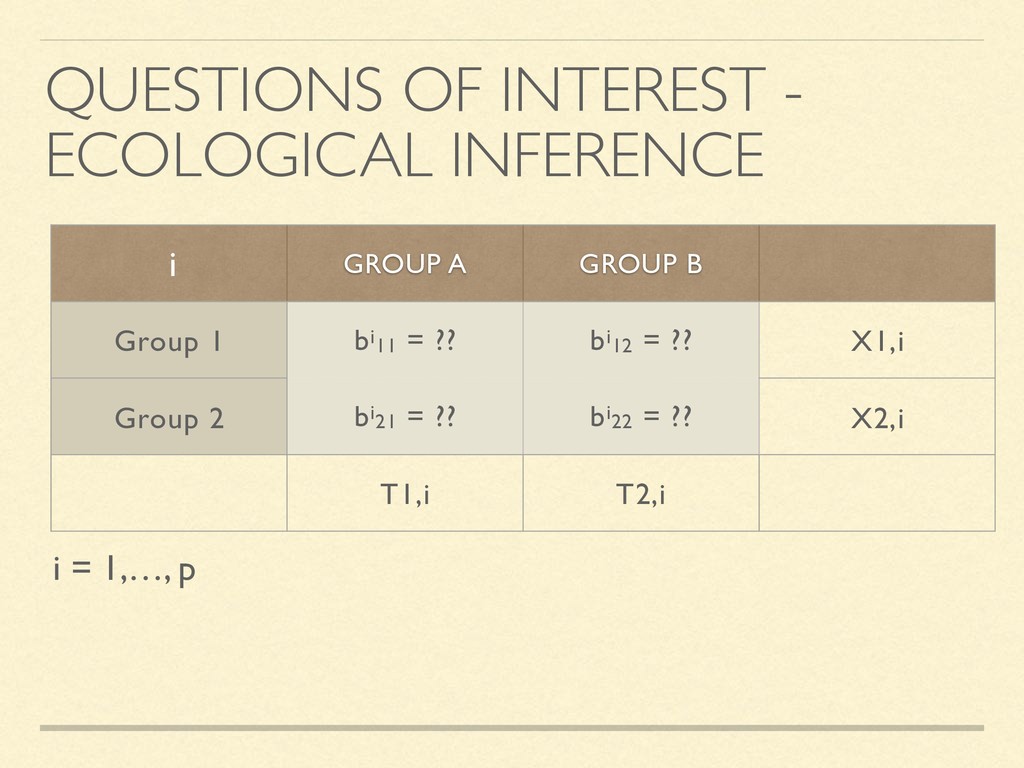
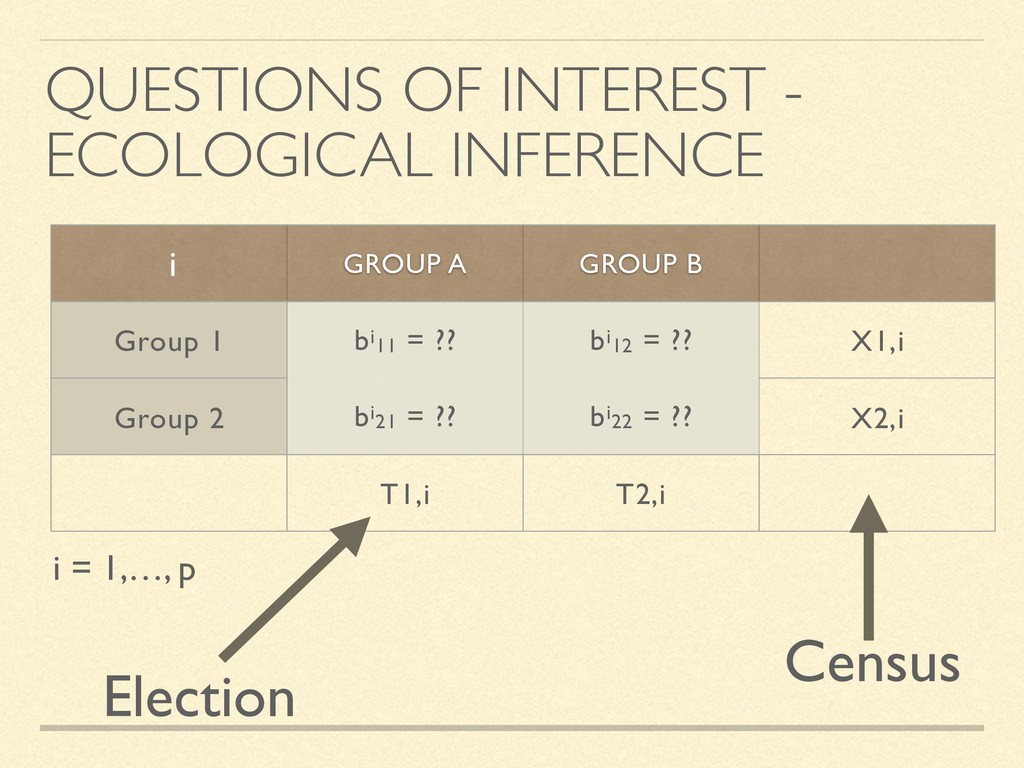
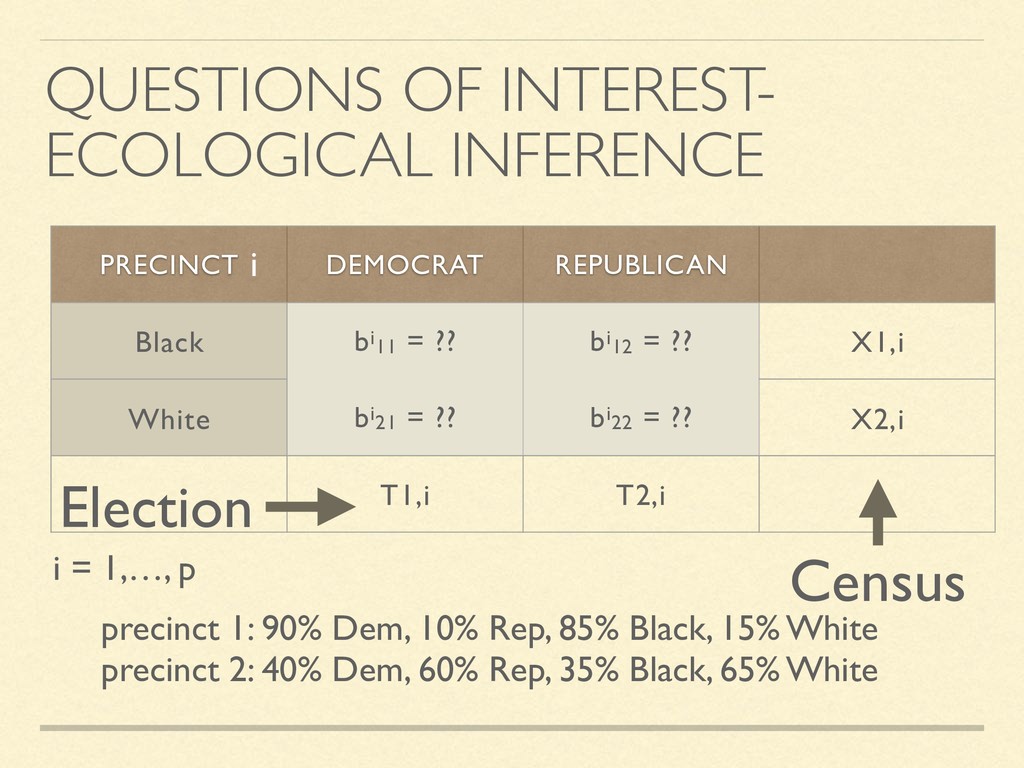
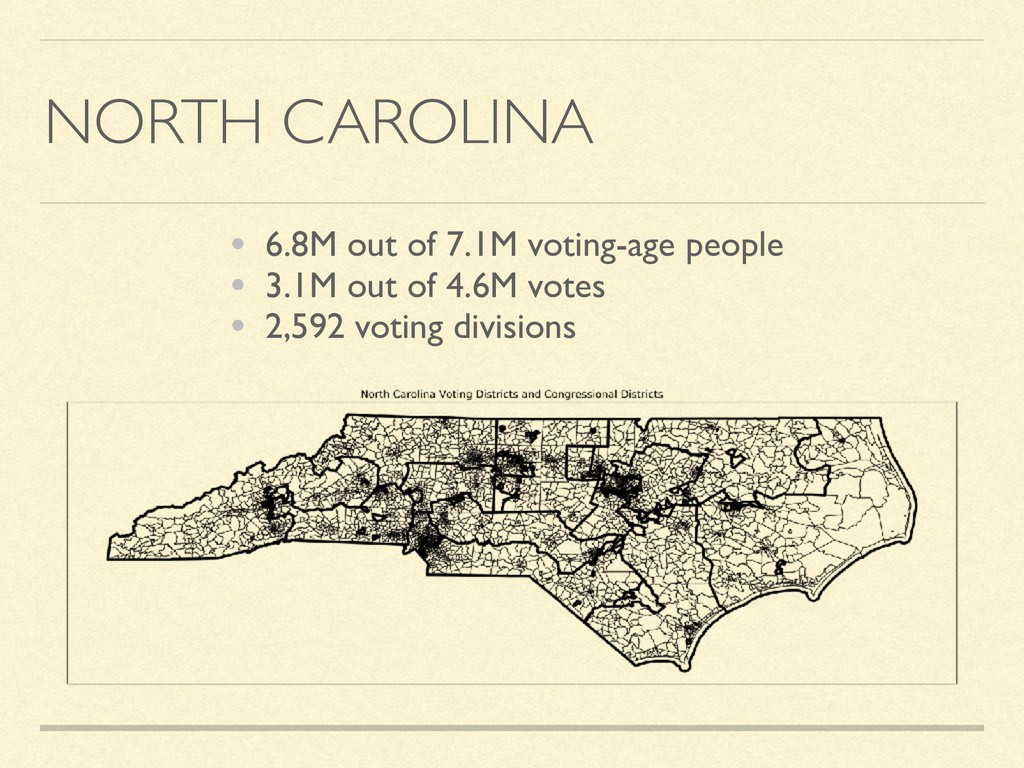
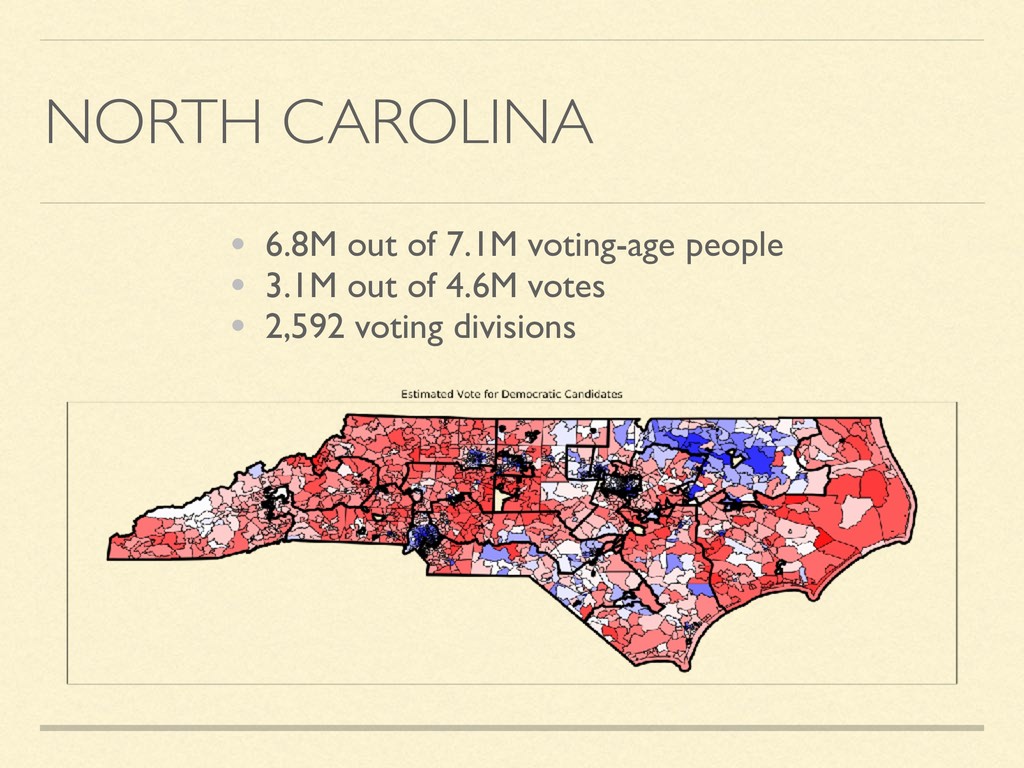
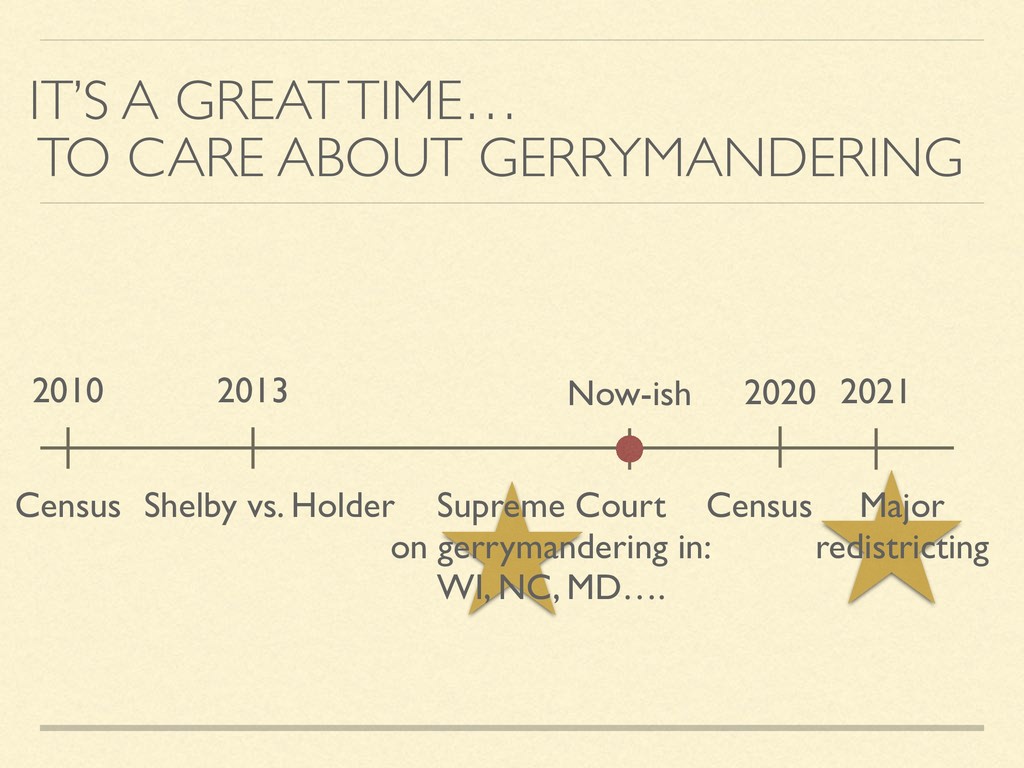
At the end of 2017, there were seven states with ongoing redistricting litigation. We will discuss a statistical model that is relevant to certain cases of racial gerrymandering and vote dilution under the Voting Rights Act, and show how it can be implemented and used with the library PyMC3. We will also discuss what the model tells us about racial gerrymandering in North Carolina.

Karin Knudson

May 12, 2018
Tweet

Transcript

  1. PLAN FOR THE DAY History of the Voting Rights Act

    What do we need to model? Ecological inference Modelling fake data Modelling real data
  2. THE VOTING RIGHTS ACT OF 1965 “ I want you

    to write me the goddamndest, toughest, voting rights act that you can devise.” - LBJ to Attorney General Nicholas Katzenback
  3. "So long as I do not firmly and irrevocably possess

    the right to vote I do not possess myself. I cannot make up my mind — it is made up for me. I cannot live as a democratic citizen, observing the laws I have helped to enact — I can only submit to the edict of others.” - Martin Luther King
  4. VOTING RIGHTS ACT Section 2 - Prohibits racial discrimination in

    voting, vote denial and vote dilution Section 3 - Bail-in Section 4 - Coverage formula Section 5 - Pre-clearance http://www.nytimes.com/interactive/2013/06/23/us/voting-rights-act-map.html
  5. SHELBY V. HOLDER (2013) Section 4 coverage formula unconstitutional Leaves

    section 5 preclearance intact but unenforceable Section 2 intact - challenges still possible and still slow and expensive Will congress write a new coverage formula? Credit Pablo Martinez Monsivais/Associated Press “the Act imposes current burdens and must be justified by current needs.”
  6. THORNBURG V. GINGLES (1986) WHAT DOES A VRA CHALLENGE REQUIRE?

    AMONG OTHER GUIDANCE…. 1. The history of official discrimination in the jurisdiction that affects the right to vote; 2. The degree to which voting in the jurisdiction is racially polarized; 3. The extent of the jurisdiction's use of majority vote requirements, unusually large electoral districts, prohibitions on bullet voting, and other devices that tend to enhance the opportunity for voting discrimination; 4. Whether minority candidates are denied access to the jurisdiction's candidate slating processes, if any; 5. The extent to which the jurisdiction's minorities are discriminated against in socioeconomic areas, such as education, employment, and health; 6. Whether overt or subtle racial appeals in campaigns exist; 7. The extent to which minority candidates have won elections; 8. The degree that elected officials are unresponsive to the concerns of the minority group; and 9. Whether the policy justification for the challenged law is tenuous. 1. compactness - racial/language minority group is “sufficiently numerous and compact to form a majority in a single- member district” 2. the minority group is “politically cohesive” 3. “majority votes sufficiently as a block to enable it…usually to defeat the minority’s preferred candidate” SENATE FACTORS (1982)
  7. THORNBURG V. GINGLES (1986) WHAT DOES A VRA CHALLENGE REQUIRE?

    AMONG OTHER GUIDANCE…. ….. 2. The degree to which voting in the jurisdiction is racially polarized; …. 1. compactness - racial/language minority group is “sufficiently numerous and compact to form a majority in a single-member district” 2. the minority group is “politically cohesive” 3. “majority votes sufficiently as a block to enable it…usually to defeat the minority’s preferred candidate” SENATE FACTORS (1982)
  8. QUESTIONS OF INTEREST - ECOLOGICAL INFERENCE GROUP A GROUP B

    Group 1 bi11 = ?? bi12 = ?? X1,i Group 2 bi21 = ?? bi22 = ?? X2,i T1,i T2,i i = 1,…, p i
  9. QUESTIONS OF INTEREST - ECOLOGICAL INFERENCE GROUP A GROUP B

    Group 1 bi11 = ?? bi12 = ?? X1,i Group 2 bi21 = ?? bi22 = ?? X2,i T1,i T2,i i = 1,…, p i Census Election
  10. precinct 1: 90% Dem, 10% Rep, 85% Black, 15% White

    precinct 2: 40% Dem, 60% Rep, 35% Black, 65% White PRECINCT DEMOCRAT REPUBLICAN Black bi11 = ?? bi12 = ?? X1,i White bi21 = ?? bi22 = ?? X2,i T1,i T2,i QUESTIONS OF INTEREST- ECOLOGICAL INFERENCE i = 1,…, p i
  11. precinct 1: 90% Dem, 10% Rep, 85% Black, 15% White

    precinct 2: 40% Dem, 60% Rep, 35% Black, 65% White PRECINCT DEMOCRAT REPUBLICAN Black bi11 = ?? bi12 = ?? X1,i White bi21 = ?? bi22 = ?? X2,i T1,i T2,i QUESTIONS OF INTEREST- ECOLOGICAL INFERENCE i = 1,…, p i Census Election
  12. QUESTIONS OF INTEREST- ECOLOGICAL INFERENCE i = 1,…, p PRECINCT

    DEMOCRAT REPUBLICAN NO VOTE Black bi11 = ?? bi12 = ?? bi13 = ?? X1,i White bi21 = ?? bi22 = ?? bi23 = ?? X2,i Other bi31 = ?? bi32 = ?? bi33 = ?? X3,i T1,i T2,i T3,i i
  13. WISHLIST Give accurate estimates when possible Give possible estimates (e.g.

    rates between 0% and 100%!) Quantify uncertainty Make assumptions explicit Results clearly communicable to courts (!)
  14. GOODMAN’S ECOLOGICAL REGRESSION PRECINCT DEMOCRAT REPUBLICAN Black bi11 = ??

    bi12 = ?? X1,i White bi21 = ?? bi22 = ?? X2,i =1 - X1,i T1,i T2,i = 1 - T1,i i = 1,…, p Tc,i = b1c X1,i + b21 X2,i + … + brc Xr,i + eic i
  15. GOODMAN’S ECOLOGICAL REGRESSION PRECINCT DEMOCRAT REPUBLICAN Black bi11 = ??

    bi12 = ?? X1,i White bi21 = ?? bi22 = ?? X2,i =1 - X1,i T1,i T2,i = 1 - T1,i i = 1,…, p Tc,i = b1c X1,i + b21 X2,i + … + brc Xr,i + eic i Election
  16. GOODMAN’S ECOLOGICAL REGRESSION PRECINCT DEMOCRAT REPUBLICAN Black bi11 = ??

    bi12 = ?? X1,i White bi21 = ?? bi22 = ?? X2,i =1 - X1,i T1,i T2,i = 1 - T1,i i = 1,…, p Tc,i = b1c X1,i + b21 X2,i + … + brc Xr,i + eic i Election Census
  17. "requires, in all but the smallest of jurisdictions, reliance on

    computers to perform the calculations." GOODMAN’S ECOLOGICAL REGRESSION
  18. A HIERARCHICAL BAYESIAN APPROACH - THE MODEL* bi1 T’i bi2

    *King, Rosen, and Tanner 1999; Rosen et al. 2001
  19. A HIERARCHICAL BAYESIAN APPROACH - THE MODEL* bi1 T’i bi2

    *King, Rosen, and Tanner 1999; Rosen et al. 2001 T’i | bi1 bi2, Xi ~ Binomial(Ni,θi) θi=Xi bi1 + (1-Xi)b2i
  20. A HIERARCHICAL BAYESIAN APPROACH - THE MODEL* bi1 T’i bi2

    *King, Rosen, and Tanner 1999; Rosen et al. 2001 T’i | bi1 bi2, Xi ~ Binomial(Ni,θi) θi=Xi bi1 + (1-Xi)b2i Election Census
  21. A HIERARCHICAL BAYESIAN APPROACH - THE MODEL* bi1 T’i p

    bi2 *King, Rosen, and Tanner 1999; Rosen et al. 2001 T’i | bi1 bi2, Xi ~ Binomial(Ni,θi) θi=Xi bi1 + (1-Xi)b2i Election Census
  22. A HIERARCHICAL BAYESIAN APPROACH - THE MODEL* c1 d1 c2

    d2 bi1 T’i p bi2 *King, Rosen, and Tanner 1999; Rosen et al. 2001 T’i | bi1 bi2, Xi ~ Binomial(Ni,θi) bi1 | c1,d1 ~ Beta(c1,d1) i.i.d. bi2 | c2,d2 ~ Beta(c2,d2) i.i.d. θi=Xi bi1 + (1-Xi)b2i Election Census
  23. A HIERARCHICAL BAYESIAN APPROACH - THE MODEL* λ c1 d1

    c2 d2 bi1 T’i p bi2 *King, Rosen, and Tanner 1999; Rosen et al. 2001 T’i | bi1 bi2, Xi ~ Binomial(Ni,θi) bi1 | c1,d1 ~ Beta(c1,d1) i.i.d. bi2 | c2,d2 ~ Beta(c2,d2) i.i.d. c1~ Exponential(λ) d1~ Exponential(λ) c2~ Exponential(λ) d2~ Exponential(λ) θi=Xi bi1 + (1-Xi)b2i Election Census
  24. WITH COVARIATES p(α) = p(β) = p(γ) = p(δ)∝1 d1

    ~ Exponential(λ) d2 ~ Exponential(λ) bi1 | Zi, d1, α, β ~ Beta(d1exp(α+βZi ), d1) bi2 | Zi, d2, γ, δ ~ Beta(d2exp(γ+δZi ), d2) θi=Xi b1i + (1-Xi) bi2 T’i ~ Binomial(Ni,θi) Note: log (b1i)/( 1-(b1,i)) =α+βZi
  25. WITH MORE CATEGORIES (RXC) rc ~ Exponential(λ1) i.i.d. bir |

    r ~ Dirichlet(r) i.i.d. r = 1,…,R θic=Xir bi1c + XiRbiRc c = 1… C T’ic ~ Multinomial(Ni,θi) bi1 biR T’i p 1 R λ vectors of length C
  26. WITH MORE CATEGORIES AND COVARIATES dr ~ Exponential (λ) i.i.d.

    r = 1….R r = (dr exp( r1 + r1 Zi),…,dr exp( rC-1 + rC-1 Zi), dr ) r = 1,…,R bri | r ~ Dirichlet(r) i.i.d. r = 1,…,R θic=Xi1 bi1c + XiRbiRc c = 1,…,C T’ic ~ Multinomial(Ni,θi) Note: log (birc)/( 1-(birc)) = rc + rc Zi λ d1 dR T’i p Zi R R bi1 biR 1 1
  27. A HIERARCHICAL BAYESIAN APPROACH - SIMULATION STUDY PETE 2018 FOR

    PRESIDENT MORE HEAD PATS FEWER LOUD NOISES
  28. SIMULATING DATA n_precincts = 14 # Hidden minority_pete = np.random.rand(n_precincts)

    * 0.3 + 0.7 majority_pete = np.random.rand(n_precincts) * 0.3
  29. SIMULATING DATA # Observed pct_minority = np.random.rand(n_precincts) pct_for_pete = (pct_minority

    * minority_pete + (1 - pct_minority) * majority_pete) Census Election
  30. NORTH CAROLINA • 6.8M out of 7.1M voting-age people •

    3.1M out of 4.6M votes • 2,592 voting divisions
  31. NORTH CAROLINA • 6.8M out of 7.1M voting-age people •

    3.1M out of 4.6M votes • 2,592 voting divisions
  32. NORTH CAROLINA • 6.8M out of 7.1M voting-age people •

    3.1M out of 4.6M votes • 2,592 voting divisions
  33. IT’S A GREAT TIME… TO CARE ABOUT GERRYMANDERING 2010 2013

    2020 2021 Census Census Major redistricting Shelby vs. Holder Supreme Court on gerrymandering in: WI, NC, MD…. Now-ish
  34. • King, Gary and Roberts, Molly.(2016). ei: Ecological Inference. R

    package version 1.3-3. • King, Gary, Ori Rosen and Martin A. Tanner. Ecological Inference: New Methodological Strategies • King, Gary, Ori Rosen, and Martin A. Tanner. "Binomial-beta hierarchical models for ecological inference." Sociological Methods & Research 28.1 (1999): 61-90. • King, Gary (1997). A Solution to the Ecological Inference Problem. Princeton, NJ: Princeton University Press. • Rosen, Ori, et al. "Bayesian and frequentist inference for ecological inference: The R× C case." Statistica Neerlandica 55.2 (2001): 134-156. • James Greiner, “Ecological Inference in Voting Rights Act Disputes: Where Are We Now, and Where Do We Want to Be?”, 47 Jurimetrics J. 115-167 (2007). • Bullock, Charles S. et al. The Rise and Fall of the Voting Rights Act. Oklahoma University Press: Norman, 2006. • Thornburg v. Gingles, 478 U.S. 30,49 (1986). • Shelby County v. Holder, No. 570 U.S 12-96, (2013) • Metric Geometry and Gerrymandering Group https://sites.tufts.edu/gerrymandr/ (particular acknowledgment to Dr. Mira Bernstein of the MGGG and Dr. Megan A. Gall of the Lawyers’ Committee for Civil Rights Under Law) • NC data from: OpenElections http://www.openelections.net/ and the US Census
  35. KING’S ECOLOGICAL INFERENCE precinct 1: 70% Dem, 30% Rep, 65%

    Black, 35% White precinct 2: 50% Dem, 50% Rep, 25% Black, 75% White .70 = .65b11 + .35b12 .50 = .25b11 + .75b12 b11 b12
  36. METHOD OF BOUNDS precinct 1: 90% Dem, 10% Rep, 85%

    Black, 15% White Note: 0.9 = .85b11 + .15b12 .33 < b12 ≤ 1 PRECINCT DEMOCRAT REPUBLICAN Black bi11 = ?? bi12 = ?? X1,i White bi21 = ?? bi22 = ?? X2,i =1 - X1,i T1,i T2,i = 1 - T1,i
  37. A HIERARCHICAL BAYESIAN APPROACH - THE MODEL* c1~ Exponential(λ) d1~

    Exponential(λ) c2~ Exponential(λ) d2~ Exponential(λ) bi1 | c1,d1 ~ Beta(c1,d1) i.i.d. bi2 | c2,d2 ~ Beta(c2,d2) i.i.d. θi=Xi bi1 + (1-Xi)b2i T’i | bi1 bi2, Xi ~ Binomial(Ni,θi) λ c1 d1 c2 d2 bi1 T’i p bi2 *King, Rosen, and Tanner