Upgrade to Pro — share decks privately, control downloads, hide ads and more …

Great Indian Venture Capital Story

Pulkit
March 30, 2019
57

Great Indian Venture Capital Story

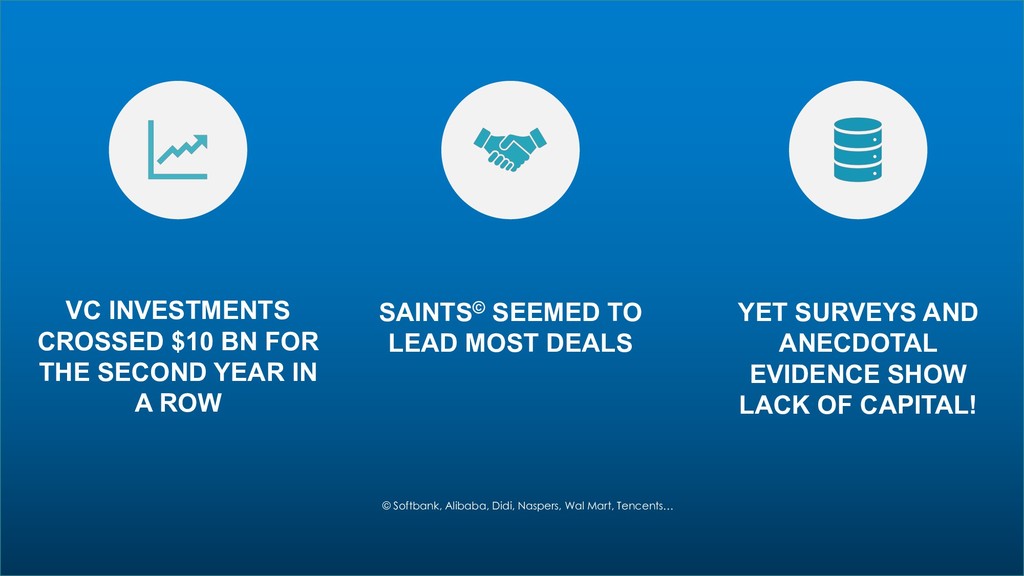
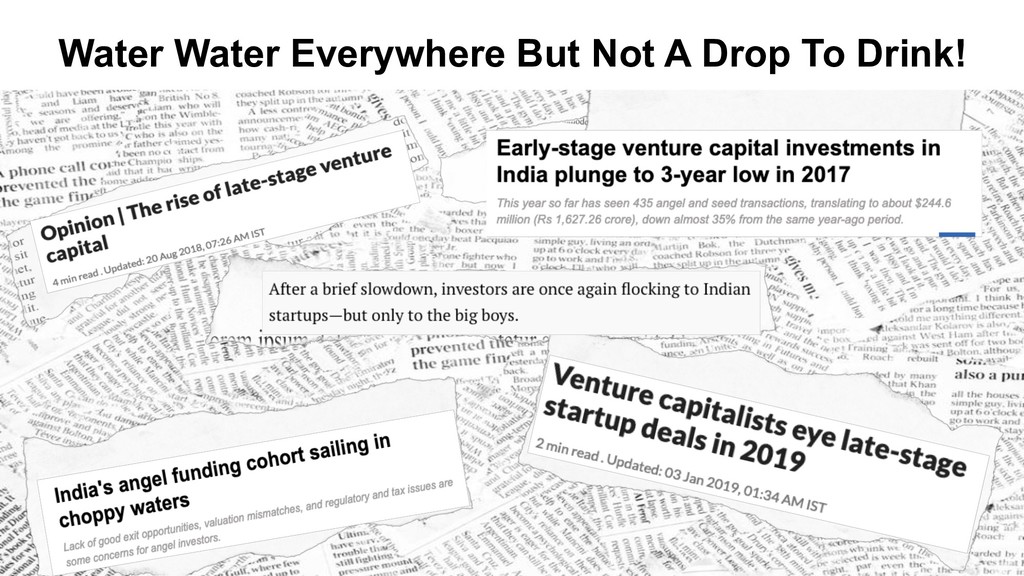
Venture Capital is coming of age in India with a second successive year of $10Bn+ in investments. There is much talk of Unicorns and multi $100 million funding rounds with the occasional flourish of even a $1 Bn+ round. Everyone is in on the action – government, media and general citizens. However, there are a few whispers of discontent. A feeling that perhaps all is not as real as it is made out to be. Some of it tinged by envy of those who missed out, some from the not so hot sectors who feel left out and some from the general it cant be so easy gang. More importantly, even within the eco system, there is a feeling of inequality, a lot of concern around the difficulty of raising money, a feeling that only the big are getting bigger and no one cares about the small.

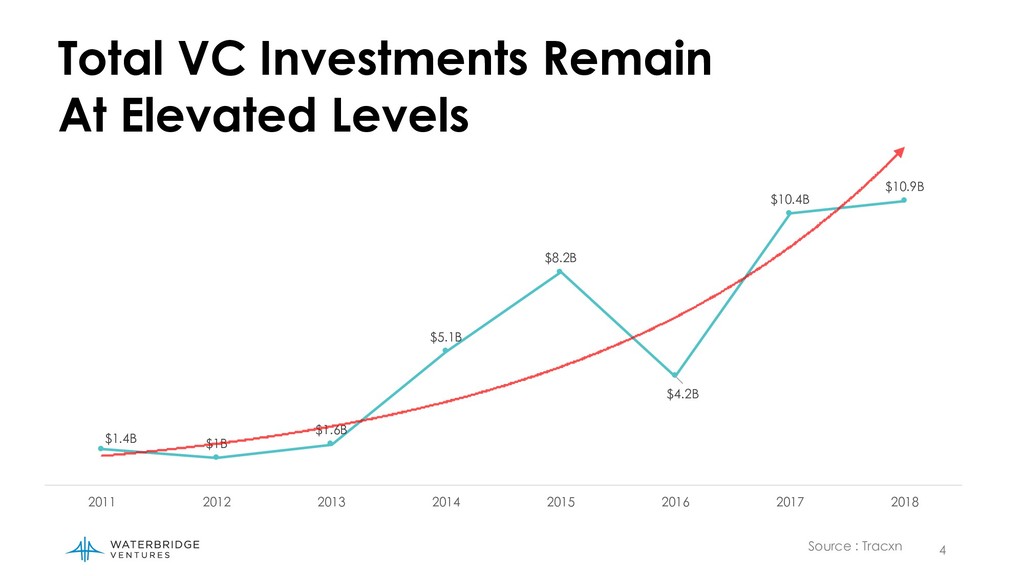
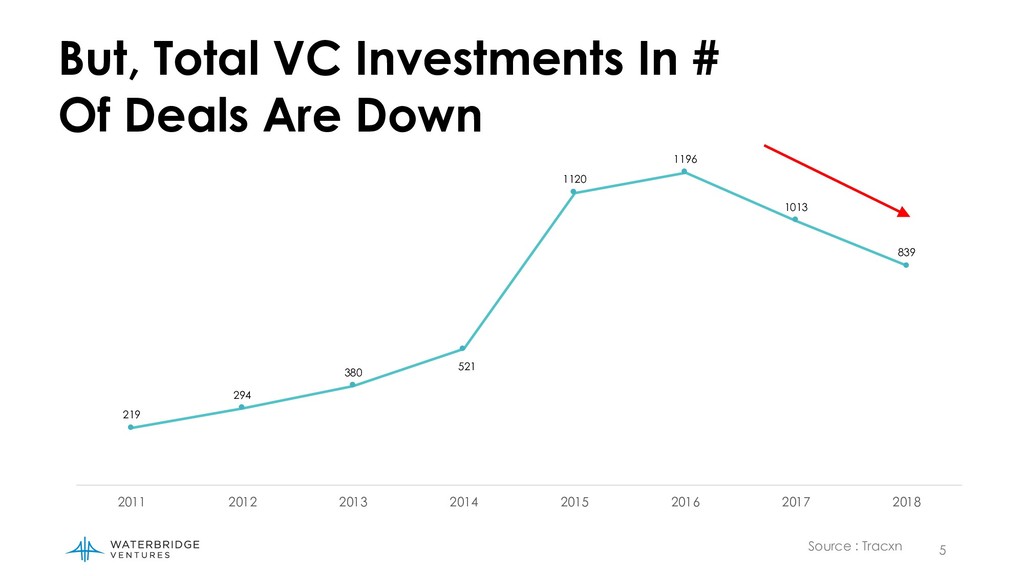
So which of these narratives is true? Are the headline numbers real? Or are the concerns valid? We at WaterBridge Ventures decided to get into the debate starting from first principles. We have looked at data for the last 8 years both in aggregate and in relevant slices to bring to you the reality of the Indian venture capital eco system.

Pulkit

March 30, 2019
Tweet

Transcript

  1. 1 The Great Indian Venture Capital Story - A Tale

    of Two Cities! Sarbvir Singh @pen5ta Pulkit Mehrotra @pulkitmehrotra
  2. 2 VC INVESTMENTS CROSSED $10 BN FOR THE SECOND YEAR

    IN A ROW SAINTS© SEEMED TO LEAD MOST DEALS YET SURVEYS AND ANECDOTAL EVIDENCE SHOW LACK OF CAPITAL! © Softbank, Alibaba, Didi, Naspers, Wal Mart, Tencents…
  3. 3 It was the best of times, it was the

    worst of times, it was the age of wisdom, it was the age of foolishness...
  4. 4 $1.4B $1B $1.6B $5.1B $8.2B $4.2B $10.4B $10.9B 2011

    2012 2013 2014 2015 2016 2017 2018 Source : Tracxn Total VC Investments Remain At Elevated Levels
  5. 5 Source : Tracxn But, Total VC Investments In #

    Of Deals Are Down 219 294 380 521 1120 1196 1013 839 2011 2012 2013 2014 2015 2016 2017 2018
  6. 6 50%+ Of Total $ Invested in Last Two Years

    Has Come From The SAINTS © Softbank, Alibaba, Didi, Naspers, Wal Mart, Tencents…
  7. 8 Let’s take a closer look at what’s actually happening…

    @upfrontvc - https://www.slideshare.net/msuster/is-vc-still-a-thing-final/
  8. 9 Source : Tracxn Seed Investments (<$1M) Have Declined Quite

    Sharply 103 176 239 303 654 $24M $43M $57M $79M $172M 2011 2012 2013 2014 2015 786 611 381 $216M $178M $131M 2016 2017 2018 Number of Deals Investment Amount
  9. 10 Source : Tracxn Pre Series A Investments ($1-3M) Are

    Also Down 34 46 48 102 190 $56M $72M $79M $165M $311M -30 20 70 120 170 220 270 320 0 50 100 150 200 250 2011 2012 2013 2014 2015 202 177 172 $314M $281M $286M 2016 2017 2018 Number of Deals Investment Amount
  10. 11 Source : Tracxn Series A Investments ($3-6M) Are Down

    in $, Flat in # 28 31 37 35 95 $122M $130M $165M $148M $401M 2011 2012 2013 2014 2015 78 93 93 $320M $387M $375M 2016 2017 2018 Number of Deals Investment Amount
  11. 12 Source : Tracxn Series B Investments ($6-15M) Are Up

    Modestly 30 24 35 29 80 $276M $216M $323M $263M $740M 2011 2012 2013 2014 2015 62 59 86 $544M $517M $836M 2016 2017 2018 Number of Deals Investment Amount
  12. 13 Series C & D Investments ($15-100M) Are Growing 23

    15 12 38 94 $583M $431M $580M $1,248M $2,788M 2011 2012 2013 2014 2015 58 50 106 $1,640M $2,302M $2,794M 2016 2017 2018 Source : Tracxn Number of Deals Investment Amount
  13. 14 Mega Deals (>$100M) Are The Ones Really Driving Growth

    2 1 2 9 14 $308M $150M $360M $3200M $3744M 2011 2012 2013 2014 2015 7 10 23 $1131M $6722M $6453M 2016 2017 2018 Source : Tracxn Number of Deals Investment Amount
  14. 15 Source : Tracxn Seed to Series A Deals Are

    Down Larger Deals Are Holding Up The Sky $884M $849M $847M $791M 600 650 700 750 800 850 900 2015 2016 2017 2018 < $6M $7.3B $3.3B $9.5B $10B 3,000 4,000 5,000 6,000 7,000 8,000 9,000 10,000 11,000 2015 2016 2017 2018 >$6M
  15. 17 Consuming Class is Growing Strongly Affluent Class Middle Class

    Emerging Middle Class Lower Class > $37,000 $7,500 - $37,000 $3,300 - $7,500 <$3,300 Annual Income Source : PwC Analysis 2022 1.4bn 2017 1.3bn 360 550 380 20 290 500 540 40
  16. 18 165m 252m 302m 343m 422m 494m 13% 20% 24%

    27% 32% 38% 2013 2014 2015 2016 2017 2018 World’s Second Largest Internet Base Source : RedSeer, Axis Capital
  17. 19 Active Internet Users Are Up Sharply & Are Expected

    To Double From Here On 2012 2017 2022 Digital Champions Digital Live Digital Explorers Digital Beginners < 1mn 5 – 10 mn 10 – 15 mn 50mn+ 10 – 20 mn 50 – 60 mn 80mn+ 200mn+ 50 – 60 mn 100 – 130 mn 130 – 150 mn 500mn+ Source : PwC Analysis
  18. 20 Most Affordable Internet Globally Average Cost Lowest Cost 0

    0.3 0.6 0.9 1.2 1.5 3 6 9 12 15 0 India India Brazil UK China US China US Brazil UK $3.5 $6.7 $12.37 $9.89 $0.26 ( Rs. 18.5) $0.02 $0.26 $0.87 $1.5 Cost of 1GB of data Source : cable.co.uk
  19. 21 0.8 mbps 2009 2014 2018 9mbps 2mbps Quality of

    Internet Access Up Sharply 5% 21% 36% Internet Speed Smartphone Penetration Source : Medianama, Statista
  20. 22 4mn 2mn 2009 70mn 110mn 15mn 8mn 2014 250mn

    225mn 30mn 75mn 20mn 20mn 2018 Social Networks Have Achieved Scale Monthly Active Users ( India ) Source : Economic Time, Factor daily, Statista
  21. 23 Mobile Payments Are Growing Rapidly 2009 2010 2011 2012

    2013 2014 2015 2016 2017 2018 RTGS Cheque NEFT IMPS NACH Credit Card POS Debit Card POS m-wallet Mobile Banking UPI 3bn 4.5bn 3.9bn 4.1bn 1.6bn 2.8bn 1.5bn 2.2bn 1.2bn # of Transactions - $82bn UPI and $13bn m-wallet transaction In 2018 - p2p mobile payments growing quickly post UPI Source : RBI, NPCI
  22. 25 Fund Sizes Have Increased Resulting In Changed Focus To

    Larger Deals 2007 2014 2018 2008 2011 2016 2010 2015 2017 2015 2018 2007 2012 2015 2006 2011 2018 2007 2012 2015 2013 2016 $100M 1
  23. 26 SAINTS And Global Players Are On The Lookout For

    Bigger Opportunities 2 India Is The Only OPEN Large Market For Global Investors Their Focus Is On Less Risky Late Stage Deals
  24. 28

  25. 29 What Does The Future Hold? 1. Rising Incomes with

    Digital Infrastructure & Rails In Place – Devices, Access, Social, Payments 2. Pace of Change Will Accelerate As Emerging Technologies Mature - AI/ML/AR/VR/IoT/Blockchain 3. Early Stage Deals (Seed to Series A) will see a Renaissance as Technology Disrupts More Sectors and Becomes An Integral Part Of Consumers & Businesses 4. New Set of Funds & Programs Emerging To Fill The Early Stage Gap & Are Rapidly Deploying More Capital 5. Later Stage Deals (Series B+) Will Continue To Grow But At A Pace More Aligned With Early Stage Deals
  26. 30 It is a far, far better thing that I

    do, than I have ever done; it is a far, far better future that I go to than I have ever known. Sarbvir Singh @pen5ta Pulkit Mehrotra @pulkitmehrotra