Upgrade to Pro — share decks privately, control downloads, hide ads and more …

Residual Mix: The Next Data Frontier

Residual Mix: The Next Data Frontier

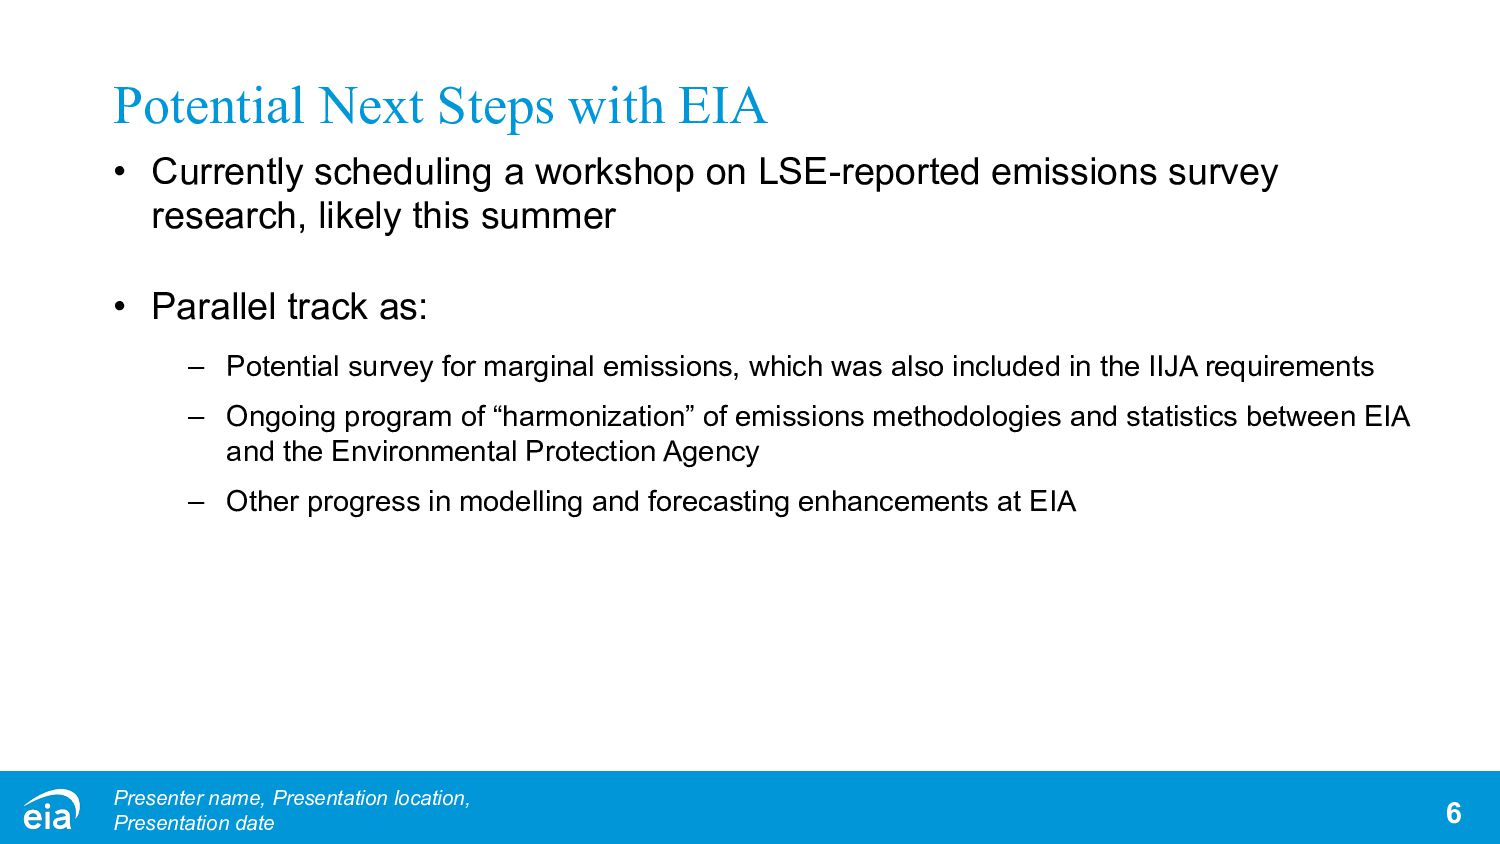
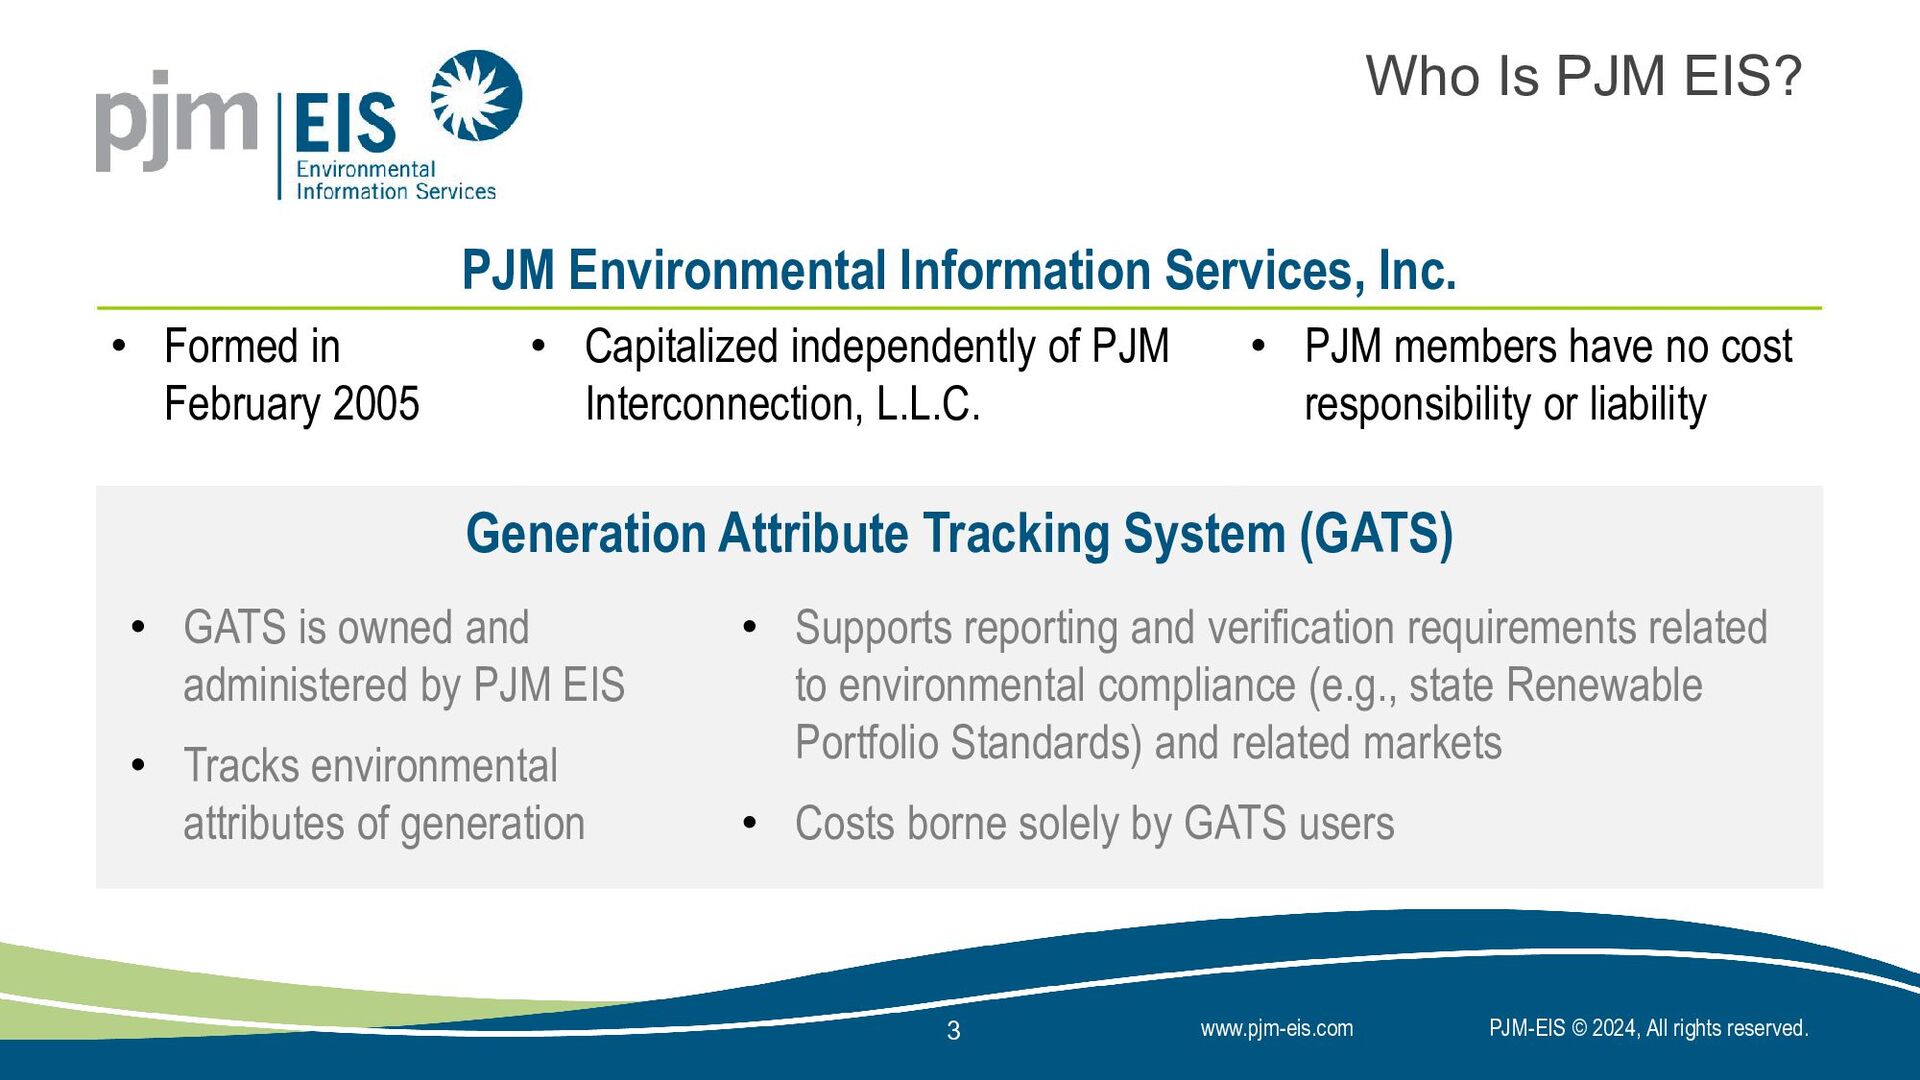
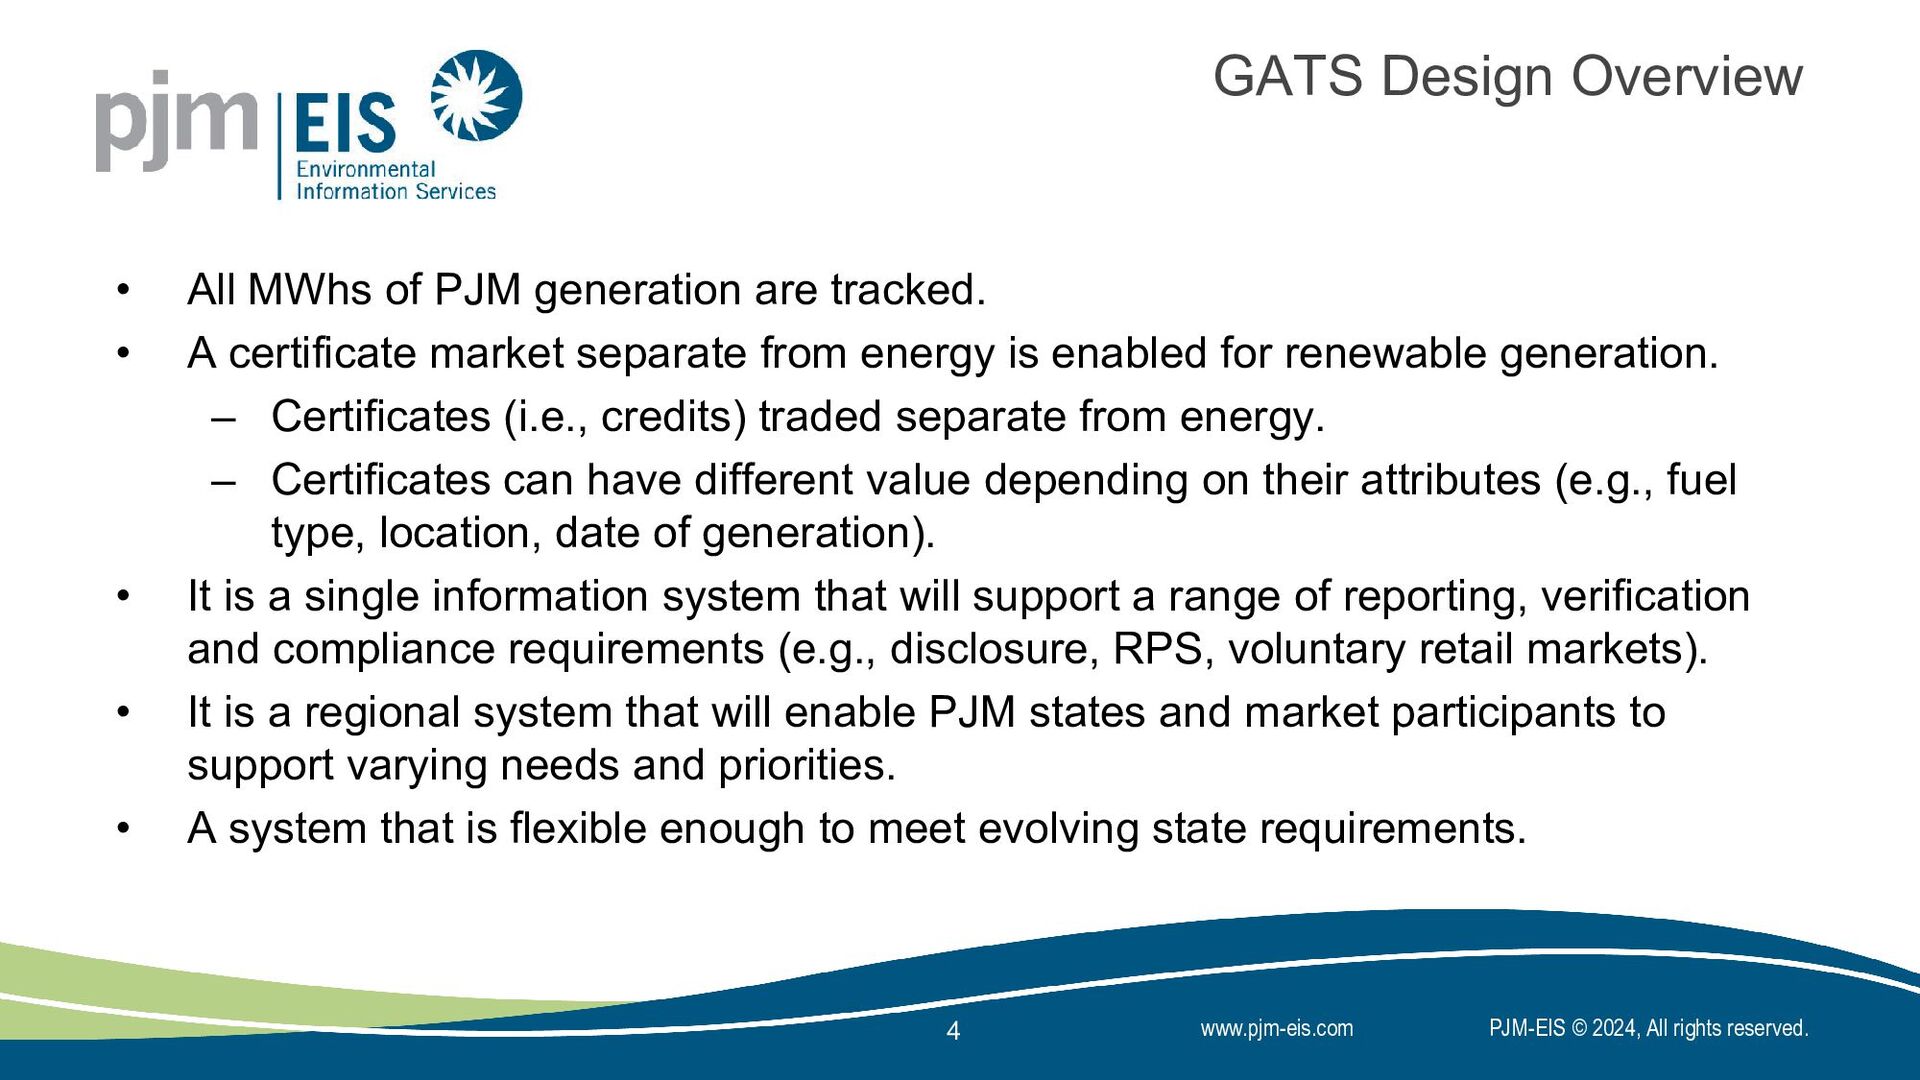
In this session, Lucas Grimes from the Center for Resource Solutions, Ken Schuyler from PJM EIS, and Tyson Brown from the U.S. Energy Information Administration will delve into CEAP’s "Guidance for Calculating Residual Mix," share relevant insights from PJM’s All-Generation Tracking System, and discuss the Infrastructure Investment and Jobs Act (IIJA) implications for EIA residual mix data. Participants will have the opportunity to engage in a dynamic Q&A session, making this webinar essential for energy industry professionals, policymakers, researchers, and anyone interested in advancing transparency in electricity emissions reporting.

More Decks by Center for Resource Solutions

Transcript

  1. Welcome! Residual Mix: The Next Data Frontier April 22, 2024

    | 10:00 AM – 11:00 AM PT This webinar is being recorded.
  2. 2 © 2023 CENTER FOR RESOURCE SOLUTIONS. ALL RIGHTS RESERVED.

    10:00 AM Residual Mix Guidance Review: Lucas 10:15 AM U.S. Energy Information Administration discussion of the Infrastructure Investment and Jobs Act and its role in providing electricity emissions data: Tyson Brown 10:30 AM PJM’s All-Generation Tracking System role in residual mix calculations: Ken Schuyler 10:45 AM Questions Agenda
  3. PAGE 3 Nongovernmental Organization (NGO) creating policy and market solutions

    to advance sustainable energy since 1997. • Expert assistance • Renewable energy and climate policy • Clean Energy Accounting Project (CEAP) • Renewable Energy Markets annual conference • Green-e® certification for suppliers and users of renewable energy, carbon offsets and biomethane in the voluntary market Center for Resource Solutions © 2021 Center for Resource Solutions. All rights reserved.
  4. Develops standardized, stakeholder-reviewed clean energy and GHG emissions accounting guidance

    and best practices Addresses outstanding questions in voluntary and regulatory markets Clean Energy Accounting Project (CEAP) PAGE 4 © 2021 Center for Resource Solutions. All rights reserved. To Learn More: www.resource-solutions.org/CEAP • 3Degrees • Apple • CDP • Clean Energy Buyers Institute • Constellation • University of California Office of the President • Entergy • Google • Meta • Priority Power • Target • U.S. EPA’s Green Power Partnership Focus areas include: • Accounting for Clean Energy Use • Hourly Renewable Energy Accounting • Renewable Energy Impact Metrics • Clean Energy Storage • Regulatory Policy Our Advisory Committee includes:
  5. 5 © 2023 CENTER FOR RESOURCE SOLUTIONS. ALL RIGHTS RESERVED.

    § How should residual mixes be calculated and defined in the United States? Main Question Overall Goal § User-friendly report that demonstrates the best practices and considerations for calculating a residual mix for different objectives under different circumstances
  6. 6 © 2023 CENTER FOR RESOURCE SOLUTIONS. ALL RIGHTS RESERVED.

    CRM Working Group § Air Liquide Large Industries, U.S. L.P. § APX § Blue Dot Capital § CDP § Clean Energy Buyers Institute (CEBI) § Constellation § Electricity Maps § Entergy § FlexiDAO § Google § Hydro-Québec § Insight Sourcing Group (ISG) § Meta § M-RETS § New York State Energy Research and Development Authority (NYSERDA) § The NorthBridge Group § PJM EIS § Power Advisory § Priority Power § Regulatory Assistance Project (RAP) § Resource Energy § Rhode Island Public Utilities Commission § Singularity § Southern Company § U.S. Environmental Protection Agency § University of California Office of the President § Walmart § WRI § Xcel Energy
  7. 7 © 2023 CENTER FOR RESOURCE SOLUTIONS. ALL RIGHTS RESERVED.

    What are Residual Mixes? • The generation that is left over • What you get when you’re not buying anything specified • Total regional generation minus the specified transactions
  8. 8 © 2023 CENTER FOR RESOURCE SOLUTIONS. ALL RIGHTS RESERVED.

    Residual Mix Guidance 1. Focuses on annual and regional residual mixes. 2. For the US only. 3. Is not about utility “residual mixes” or utility-specific default product emissions factors, like the EEI utility “residual mix” database.
  9. Application Use Case Consumer’s market-based scope 2 accounting Load not

    covered by specified purchases where utility-specific mixes are not available Default-delivered or standard delivery/non-voluntary specified energy where utility-specific mixes are not available Null power State GHG reporting by LSEs (Company level) Unspecified purchases (from within the same market) Imported unspecified electricity (purchase from a different market) Default emissions rate for electricity delivery where utility-specific mixes are not available or not used (e.g., clean fuels/transportation programs) Null power State power source or environmental disclosure labeling by LSEs (electricity product level) Unspecified purchases or wholesale market purchases Unfulfilled LSE load Null power 9 Application and Use Cases
  10. 10 © 2023 CENTER FOR RESOURCE SOLUTIONS. ALL RIGHTS RESERVED.

    Residual Mix Types A & B 1. Type A: only the unclaimed or unsold electricity generation attributes in a given time period. 2. Type B: is Type A plus RPS and publicly shared specified attributes
  11. Application Use Case Residual Mix Type Geographic Boundary Consumer’s market-based

    scope 2 accounting Load not covered by specified purchases where utility-specific mixes are not available B Consumer’s state Default-delivered or standard delivery/non- voluntary specified energy where utility- specific mixes are not available B Consumer’s state Null power A Consumer’s ISO/RTO, or consumer’s eGRID subregion in traditionally regulated markets State GHG reporting by LSEs (Company level) Unspecified purchases (from within the same market) A LSE’s organized wholesale market (e.g., ISO/RTO), or LSE’s eGRID subregion in traditionally regulated markets Imported unspecified electricity (purchase from a different market) A Organized wholesale market (e.g., ISO/RTO) from which the electricity is imported, or eGRID subregion from which electricity is imported in traditionally regulated markets Default emissions rate for electricity delivery where utility-specific mixes are not available or not used (e.g., clean fuels/transportation programs) B State Null power A Organized wholesale market (e.g., ISO/RTO) in which generator participates, or eGRID subregion where generator is located in traditionally regulated markets State power source or environmental disclosure labeling by LSEs (electricity product level) Unspecified purchases or wholesale market purchases A Organized wholesale market from which purchase is made, or eGRID subregion of wholesale seller (e.g., LSE or generator) in traditionally regulated markets Unfulfilled LSE load A LSE’s organized wholesale market (e.g., ISO/RTO), or LSE’s eGRID subregion in traditionally regulated markets Null power A Organized wholesale market (e.g., ISO/RTO) in which generator participates, or eGRID subregion where generator is located in traditionally regulated markets 11
  12. 12 © 2023 CENTER FOR RESOURCE SOLUTIONS. ALL RIGHTS RESERVED.

    Data Categories Data Type General Data Source Regional Total Generation Federal databases (eGRID, EIA), Organized wholesale markets (e.g., ISOs/RTOs) Tracked Specified Transaction Data Regional Generation Attribute Tracking Systems, Green-e® program Untracked Specified Transaction Data ISOs/RTOs, voluntary organized wholesale electricity markets, vertically integrated utilities, other LSEs, distributed generation databases RPS Compliance States, Tracking Systems, Lawrence Berkeley National Laboratory (LBNL)
  13. 13 © 2023 CENTER FOR RESOURCE SOLUTIONS. ALL RIGHTS RESERVED.

    Key Takeaways 1. All-generation tracking improves residual mix data 2. Residual Mixes vary based on use case, location, and data availability 3. Accurate residual mix calculations empower organizations to make informed decisions, reduce double-counting, and improve overall data reporting in the clean energy sector
  14. Center for Resource Solutions M. Tyson Brown April 22, 2024

    | Virtual Presentation Electricity-related Emissions Statistics
  15. Overview of complications with emissions: One dimensional example Emissions rates

    of electricity (pounds of carbon dioxide per megawatthour) can be calculated with ever increasingly levels of complication, with multiple dimensions that may or may not be appropriate to include. Traditionally, EIA has focused on production-based emissions that tie back to the quantity of fuel combusted when electricity is produced, and then aggregated to a state and national level. Recently, EIA began estimating consumption-denominated emissions as well. • Calculating production-based emissions (pounds of carbon dioxide per unit of generation) is straightforward and have been produced by EIA for many years. • To account for consumption-based emissions (pounds of carbon dioxide per unit of load) on a regional basis, we need to account for the trade between regions. Presenter name, Presentation location, Presentation date 2
  16. IIJA requirements would cover all these dimensions Presenter name, Presentation

    location, Presentation date 3 1. Intensity Statistics a) Consumption-based b) Production-based 2. Formulation a) Average b) Marginal c) Total 3. Measurement Type a) Fuel consumption b) Effluent instrumentation c) Generation-derived 4. Supply type a) Physical power b) Renewable Credits c) Other financial arrangements 5. Granularity a) Geospatial 1) Balancing Areas 2) States 3) LSEs 4) Nodes b) Temporal 1) Annual 2) Monthly 3) Hourly
  17. Ongoing research with supply-type dimension • Conducted cognitive interviews with

    Load Serving Entities aimed at testing the effectiveness of a survey to collect information on the contractual attributes to support LSE-based, consumption-denominated emissions intensities – Largely builds on existing surveys that collect operational information and demand statistics from power plants and load serving entities – Major complications arise in non-uniform contractual vehicles for serving load, multiple data sources, and ambiguous definitions • CEAP Residual Mix offers potential guidance to clear up some ambiguity of definitions, provides method for including null power (which is required to tie back to production-level emissions). 4 Presenter name, Presentation location, Presentation date
  18. Low-hanging fruit for residual mix • Mapping of assets that

    produce “environmental attributes” that are transacted distinct from physical power – This mapping could be used to create a high-level model to remove the carbon-free energy from the supply of the utility-scale power plants – Requires an inventory for each attribute tracking systems • Potential backstop for an all-generation tracking system that would tie back to physical emissions from fuel-combustion 5 Presenter name, Presentation location, Presentation date
  19. Potential Next Steps with EIA • Currently scheduling a workshop

    on LSE-reported emissions survey research, likely this summer • Parallel track as: – Potential survey for marginal emissions, which was also included in the IIJA requirements – Ongoing program of “harmonization” of emissions methodologies and statistics between EIA and the Environmental Protection Agency – Other progress in modelling and forecasting enhancements at EIA 6 Presenter name, Presentation location, Presentation date
  20. www.pjm-eis.com PJM-EIS © 2024, All rights reserved. Residual Mix Functionality

    in the PJM Generation Attribute Tracking System (GATS) Ken Schuyler President, PJM EIS, Inc. CRS Webinar – Residual Mix April 22, 2024
  21. PJM©2024 2 www.pjm.com | Public PJM as Part of the

    Eastern Interconnection As of 2/2024 • 26% of generation in Eastern Interconnection • 25% of load in Eastern Interconnection • 20% of transmission assets in Eastern Interconnection 21% of U.S. GDP Produced in PJM Key Statistics Member companies 1,090 Millions of people served 65+ Peak load in megawatts 165,563 Megawatts of generating capacity 183,254 Miles of transmission lines 88,185 Gigawatt hours of annual energy 770 Generation sources 1,419 Square miles of territory 368,906 States served 13 + DC
  22. 3 www.pjm-eis.com PJM-EIS © 2024, All rights reserved. Who Is

    PJM EIS? PJM Environmental Information Services, Inc. • Formed in February 2005 • Capitalized independently of PJM Interconnection, L.L.C. • PJM members have no cost responsibility or liability Generation Attribute Tracking System (GATS) • GATS is owned and administered by PJM EIS • Tracks environmental attributes of generation • Supports reporting and verification requirements related to environmental compliance (e.g., state Renewable Portfolio Standards) and related markets • Costs borne solely by GATS users
  23. 4 www.pjm-eis.com PJM-EIS © 2024, All rights reserved. GATS Design

    Overview • All MWhs of PJM generation are tracked. • A certificate market separate from energy is enabled for renewable generation. – Certificates (i.e., credits) traded separate from energy. – Certificates can have different value depending on their attributes (e.g., fuel type, location, date of generation). • It is a single information system that will support a range of reporting, verification and compliance requirements (e.g., disclosure, RPS, voluntary retail markets). • It is a regional system that will enable PJM states and market participants to support varying needs and priorities. • A system that is flexible enough to meet evolving state requirements.
  24. 5 www.pjm-eis.com PJM-EIS © 2024, All rights reserved. Certificate Creation

    Process Last business day of the month 5-Day Delay
  25. PJM©2024 6 www.pjm.com | Public Emissions Data Sources (PJM and

    GATS) • PJM Emissions Report: https://www.pjm.com/-/media/library/reports-notices/special- reports/2023/2022-emissions-report.ashx • PJM Data Miner: Contains the marginal emission rates for individual load nodes on the wholesale grid (refer to the Marginal Emissions Primer) – Five Minute Marginal Emission Rates – Hourly Marginal Emission Rates – NEW – Hourly Total Emissions by fuel type • PJM System Mix: https://gats.pjm-eis.com/gats2/PublicReports/PJMSystemMix – Reflects the average attributes of all PJM Generation (i.e., every MWh of generation sold in the PJM wholesale market). Includes certificates being claimed by other parties (e.g., retired for RPS or voluntary claims). • PJM Residual Mix: https://gats.pjm-eis.com/GATS2/PublicReports/PJMResidualMix/Filter – PJM Residual Mix excludes attributes from certificates that were claimed or used for another purpose, such as a State RPS or corporate sustainability goal. – Typically used by electricity suppliers to satisfy state fuel mix and emissions disclosure requirements when supplying customers with undifferentiated system power from the PJM market.
  26. PJM©2024 7 www.pjm.com | Public Percentage of Renewable Energy Is

    Small but Growing PJM Generation Mix – 2023 Annual Energy As of 12/2023
  27. 10 www.pjm-eis.com PJM-EIS © 2024, All rights reserved. Comparison of

    “Grid Supply” Emission Factors Gas, 338 Nuclear, 271 Coal, 163 Renewables, 58 Oil, 3 eGRID (2022 data) System Mix (TWh) Gas, 360 Nuclear, 273 Coal, 121 Renewables, 56 Oil, 2 2023 PJM System Mix (TWh) 733 CO2 (lbs/MWh) Gas, 360 Nuclear, 178 Coal, 117 Renewables, 0 Oil, 2 Imports, 13 2023 PJM Residual Mix (TWh) 866 CO2 (lbs/MWh) 794 CO2 (lbs/MWh)
  28. 11 www.pjm-eis.com PJM-EIS © 2024, All rights reserved. Monthly Residual

    Mix is Now Available 0.0 0.2 0.4 0.6 0.8 1.0 1.2 0 200 400 600 800 1,000 1,200 Jun Jul Aug Sep Oct Nov Dec Jan Feb Mar Apr May SO2 and NOx lbs/MWh CO2 lbs/MWh EY2023 Monthly Residual Mix Emissions Carbon Dioxide Sulfur Dioxide Nitrogen Oxides Gas, 51.7% Nuclear, 25.9% Coal, 20.0% Imports, 2.2% Oil, 0.3% Renewables, 0.0% EY2023 PJM Residual Mix 906 CO2 (lbs/MWh)
  29. 12 www.pjm-eis.com PJM-EIS © 2024, All rights reserved. Using the

    Residual Mix Gas, 51.7% Nuclear, 25.9% Coal, 20.0% Imports, 2.2% Oil, 0.3% Renewables, 0.0% EY2023 PJM Residual Mix 906 CO2 (lbs/MWh) 38.8% 19.4% 15.0% 1.6% 0.2% 14.8% 6.4% 2.5% 1.2% 0.1% 0.1% 25.0% Electricity Supplier ABC Disclosure Label EY2023 - 25% RPS Gas Nuclear Coal Imports Oil Wind Solar Solid Waste Landfill Methane Hydro Biogas 679 CO2 (lbs/MWh)
  30. 13 www.pjm-eis.com PJM-EIS © 2024, All rights reserved. Information publicly

    available to improve market transparency: https://www.pjm- eis.com/reports-and- events/public- reports.aspx • Aggregator/Broker Listing: Listing of Aggregators and Brokers in GATS • Renewable Generators Registered in GATS: Listing of All RE Systems and Their State RPS Enrollment(s) • Solar Weighted Average Price: Listing of SREC Trades by State, by Month • Bulletin Board & Buyer’s Bulletin Board: Listing of Credits for Sale/Purchase • RPS Eligible Certificates & RPS Retired Certificates: Listing of Eligible/ Used RECs (i.e., supply and demand) Improving Market Efficiency and Transparency