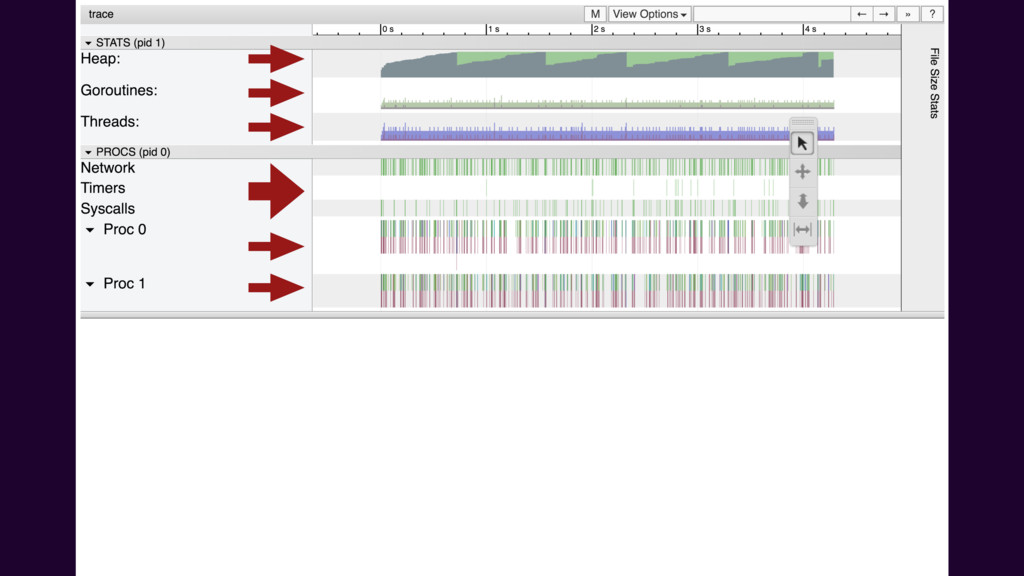
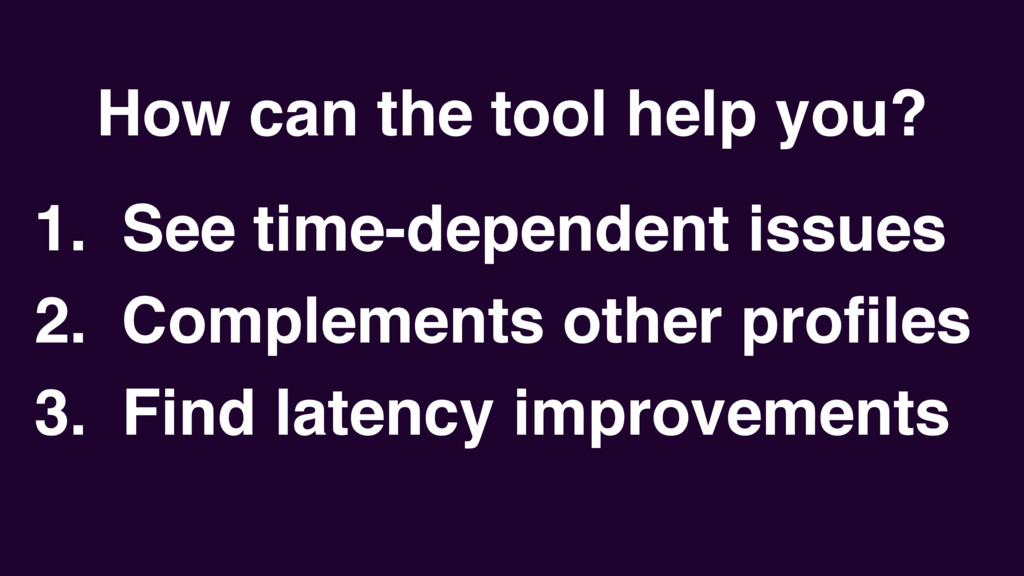
Go's tools can help you diagnose problems with your applications—if you can wield them effectively. The Execution Tracer provides great visibility into the scheduler, to help solve timing dependent bugs and track down latency problems. Learn how to use the tools before you have a time-critical need.