Upgrade to Pro — share decks privately, control downloads, hide ads and more …

BetaGlide - Deck

Avatar for Amritanshu Anand Amritanshu Anand
November 21, 2013
59

BetaGlide - Deck

Avatar for Amritanshu Anand

Amritanshu Anand

November 21, 2013
Tweet

Transcript

  1. BetaGlide Google analytics for mobile device performance. Analyse performance and

    usability data across real devices and users, get higher ratings and user ready apps www.betaglide.com
  2. Anshul IIT Kharagpur Operations Amritanshu IIT Kharagpur Business Development Executive

    Summary BetaGlide is a mobile application performance and usability analytics platform that allows developers to gather information in real-time about the system usage and the behaviour of their mobile application to improve its stability and performance. Product Customer Android V 1.0 for testing and production launched Expansion to iOS and Windows Emulators and Device Lab to enhance testing IMEI based selective targeting enabled Main customers in India 100 Users and 5 Paid users at the end of 2013 Expansion US and other Developer rich zones 14000 Users and 2100 Paid users at the end of 2015 Distribution Strategy PR, SEO and Organic Experimentation with SEM Experimentation with Content Marketing PR, SEO and Organic SEM and Content Marketing Reaching out to Enterprise Customers through private Hunt by Sales Team. 100 4000 14000 29000 5 400 2100 5000 0 5000 10000 15000 20000 25000 30000 35000 2013 2014 2015 2016 Sales Projection Number of Users Number of Paid Users 2013 2014-15 0 1,000 2,000 3,000 4,000 5,000 6,000 7,000 8,000 2013 H1 2014 H1 2014 H2 2015 H1 2015 H2 2016 H1 2016 H2 2017 H1 2017 H2 Revenue vs. Expense Revenue (In Lacs) Total Expense (in Lacs) Customers +41 Srijan IIT Kharagpur Product Development Team
  3. Device Fragmentation: Android has more than 9 versions, number of

    devices has increased tremendously from 3997 in 2012 to 11,868 in 2013. Apple has also more than 20 devices floating in the market. All these devices have different CPU/Memory specification, screen sizes, operating systems and other parameters which makes it very difficult for an app developer to analyze their app performance across all these devices . Time Lag for responses: Most of the analytics companies are not real time. One can see crashes only after they occur and not do anything about it in prior. The analytics is mostly summarized for a day and not mapping against time is not available. Poor interaction with users: Users are not mapped against one particular self generated unique id. The communication is one way i.e. data is sent from user to the developer but not vice versa. It is very tough for a developer to reach out to their users individually for any feedback or notification. Challenges for an app developer
  4. How big is the Pie Apps which use analytics tool

    Apps which don't use analytics tool App Market 2013 Total addressable Apps is 925000. Assuming a ticket size of $100 per month, the TAM amount to $100 X 12 X 925000 = $1.1 B Apps which use analytics tool Apps which don't use analytics tool App Market 2017 Total addressable Apps is 1850000. Assuming a ticket size of $100 per month, the TAM amount to $100 X 12 X 925000 = $2.22 B Total Apps: 2.5 M 37 of them use Analytics tool Total Apps: 5.0 M 37 of them use Analytics tool This does not include the TAM due to testing suite, which is estimated to be 200M in 2013 by ABI Research and will grow to 800 M by 2017.
  5. Solution Testing Suite • Measure CPU and Memory usage across

    each at session, handset and version level • Get Logs for each session, fix issues if any • Screenshot at activity level across session • User touch data analyzed at session level • Automatic Code injection and Library • Distribution platform to distribute your apps among testers and users For Production Apps • Prevent crashes before they happen, get alerts for ill performing devices • See WHEN and WHERE user touches on app • Know how the app looks across devices • Minimal network consumption with a light weight plug-play library • Crash/Error reporting and trends • IMEI based selective targeting for feedback, detailed reports and logs
  6. How it works Integrate BetaGlide •Using Automatic Code Injection or

    Integrating our library •Lightweight Library (<30kb) and has minimal network consumption Distribute the app to users • For testing version , either you can invite testers using our platform or you can use your own distribution channel •For production version, just upload it on the app store See the Analyzed results •Data is collected on the device and sent to our servers where we analyze it and give you comprehensive information •Grouped on the basis of Device, OS, IMEI, usage pattern
  7. Company Competitive Intensity Strategy New Relic Primarily involved in performance

    aspects and alerts. Usability and UI/UX not part of offering. Wide reach in developer community and aggressive marketing. Not present in testing space. Little Eye Labs Primarily a desktop software. Good for testing but not feasible for production apps. New entrant in global market. Flurry Has a large network of developers. Provides user insights as its part of their vision. Google Analytics Free of cost. Similar to GA for website. Focuses on user insight. Test Fairy Focuses on initial beta testing. Can shift focus towards production apps. New to market MixPanel Has a pricing model. Focuses on funneling and how users follow trends. Localytics Mainly focused on Usability aspects. Available across all platforms. Competitors Features Testing Production Production & Testing Performance Usability UI/UX Functional Convenience Growth Trend
  8. Validation Users • Independent App Developers 28 signed up till

    now • Startups 18 signed up till now • Development Shops 5 signed up till now • Large Players 7 signed up till now Engagement • 37 apps uploaded till date • Users from India as well as US • Maximum session of duration of 8+ hours • 45 activities opened in a session of duration 57 minutes • Large majority of them signed up organically
  9. Strategy How we plan to move •Start-ups, Developer Shops and

    Big apps in India •Startups in US •100 Users and 5 Paid users at the end of 2013 •Reaching out to Big app developers and Developer Shops in US •Opening up office in US •4000 Users and 400 Paid users at the end of 2014 •Reaching out to Enterprise customers in India and US •Expansion to European Markets •14000 Users and 2100 Paid users at the end of 2015 •Reaching out to Enterprise Customers across Globe •Targeting other dev rich zones •29000 Users and 5800 Paid users at the end of 2016 2013 2016 2015 2014 Customers 100 4000 14000 29000 5 400 2100 5000 0 5000 10000 15000 20000 25000 30000 35000 2013 2014 2015 2016 Number of Users Number of Paid Users
  10. How we plan to move •Testing Version 1.0 Launched •Production

    Version 1.0 Launched •Only on Android as of now •Windows and iOS version launched •IMEI based selective mapping created •Testing over emulators powered by BetaGlide to start •Development of push ad feature by capturing historic user time and touch data •Private server option available for Enterprise customers •Device Lab to enable Testing •Ad Push Feature Launched As per market demand 2013 2016 2015 2014 Product
  11. How we plan to move •PR, SEO and Organic •Experimentation

    with SEM •Experimentation with Content Marketing (blogs, eBooks, white papers and community answers) •PR, SEO and Organic •SEM and Content Marketing (blogs, eBooks, white papers and community answers) •PR and conferences in US •PR, SEO and Organic •SEM and Content Marketing (blogs, eBooks, white papers and community answers) •Reaching out to Enterprise Customers through private Hunt by Sales Team. •PR, SEO and Organic •SEM and Content Marketing (blogs, eBooks, white papers and community answers) •Reaching out to Enterprise Customers through private Hunt by Sales Team. •Private Sales Team across Globe for enterprise customers. 2013 2016 2015 2014 Distribution Strategy
  12. Financials 2013 2014 2015 2016 2017 Q4 Q1 Q2 Q3

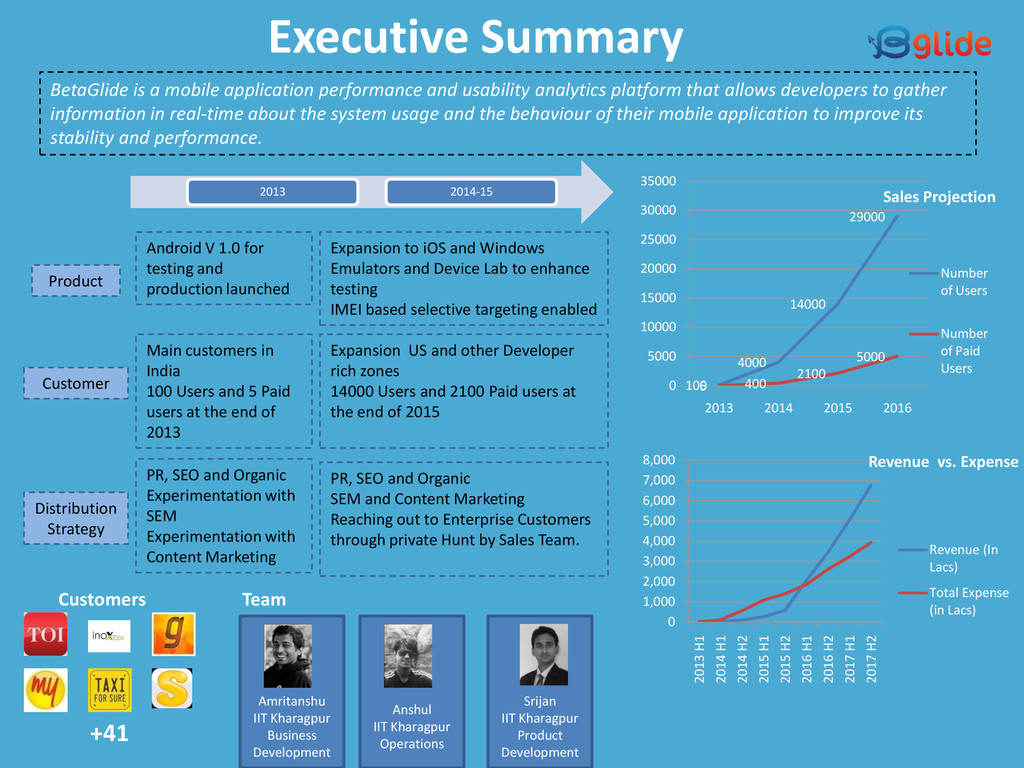
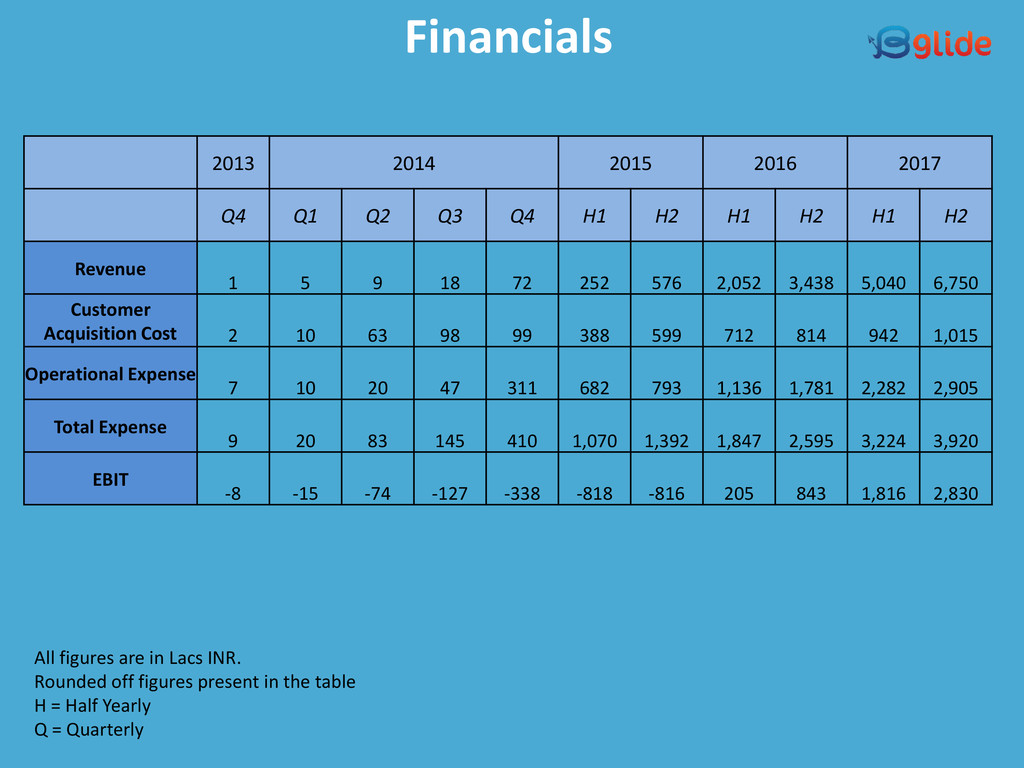
    Q4 H1 H2 H1 H2 H1 H2 Revenue 1 5 9 18 72 252 576 2,052 3,438 5,040 6,750 Customer Acquisition Cost 2 10 63 98 99 388 599 712 814 942 1,015 Operational Expense 7 10 20 47 311 682 793 1,136 1,781 2,282 2,905 Total Expense 9 20 83 145 410 1,070 1,392 1,847 2,595 3,224 3,920 EBIT -8 -15 -74 -127 -338 -818 -816 205 843 1,816 2,830 All figures are in Lacs INR. Rounded off figures present in the table H = Half Yearly Q = Quarterly
  13. Amritanshu Anand, Business Development & Co-founder, IIT Kharagpur: Amritanshu is

    a Kairos Fellow and has worked with various start-ups . He was selected as an Author of Change by NSEF. He is an advisor to the Entrepreneurship Cell of IIT Kharagpur. He was also a Placement Coordinator at IIT Kharagpur and personally was in touch with more than 400 companies. Anshul Singhle, Operations & Co-founder, IIT Kharagpur: Anshul is a software engineer who has expertise in working on scalable web-systems using frameworks such as Django (python), Slim (PHP), Backbone.js and Node.js. He has previously worked for Siemens on Big-Data Workflows and scheduling. He participated in Google Summer of Code 2013 Srijan Kumar, Development & Co-founder, IIT Kharagpur: Srijan was selected for IIM Bangalore and Goldman Sachs, but instead he chose to start-up. His expertise is in the area of mobile technologies and data analytic algorithm design. He spent his 2011 summer working at SUNY Buffalo and 2012 summer at IBM Research India Limited. Team Featured, Awarded and Presented in