Upgrade to Pro — share decks privately, control downloads, hide ads and more …

5 key steps to analysing QuIP data with causal ...

Avatar for Bath SDR Bath SDR
March 28, 2025
30

5 key steps to analysing QuIP data with causal maps

Avatar for Bath SDR

Bath SDR

March 28, 2025
Tweet

Transcript

  1. Explore further Snapshot of change Make a plan Key trends

    Test theory to analysing QuIP data using Causal Map Revisit research questions Reflect on coding experience Review closed question responses Identify most frequent factors and links Check for any key differences between groups Explore maps and quotes for key trends and differences Link back to the theory of change under evaluation
  2. Make a plan When you're first getting started, analysis can

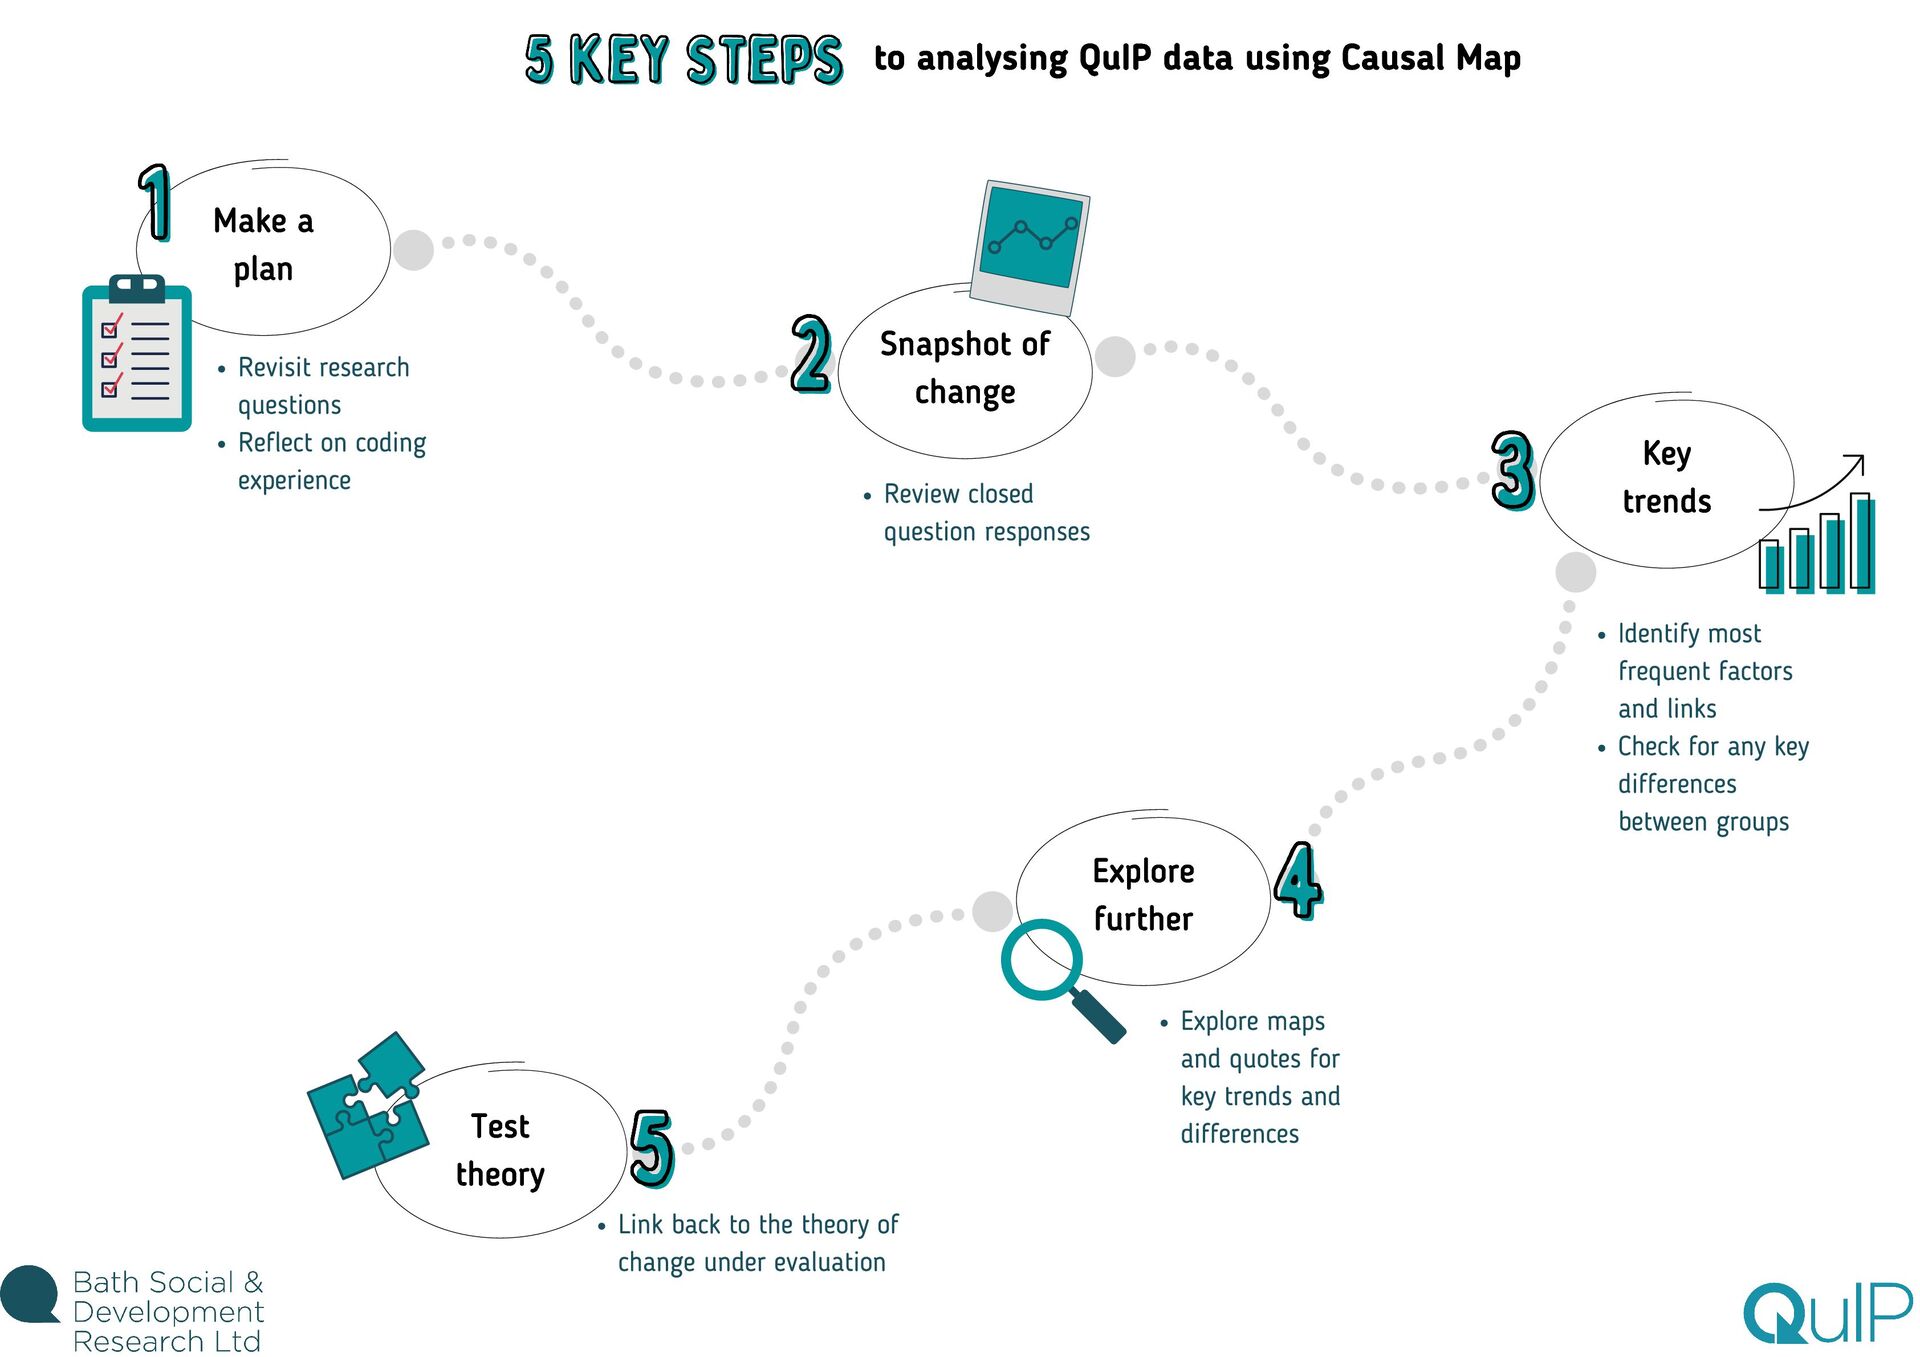
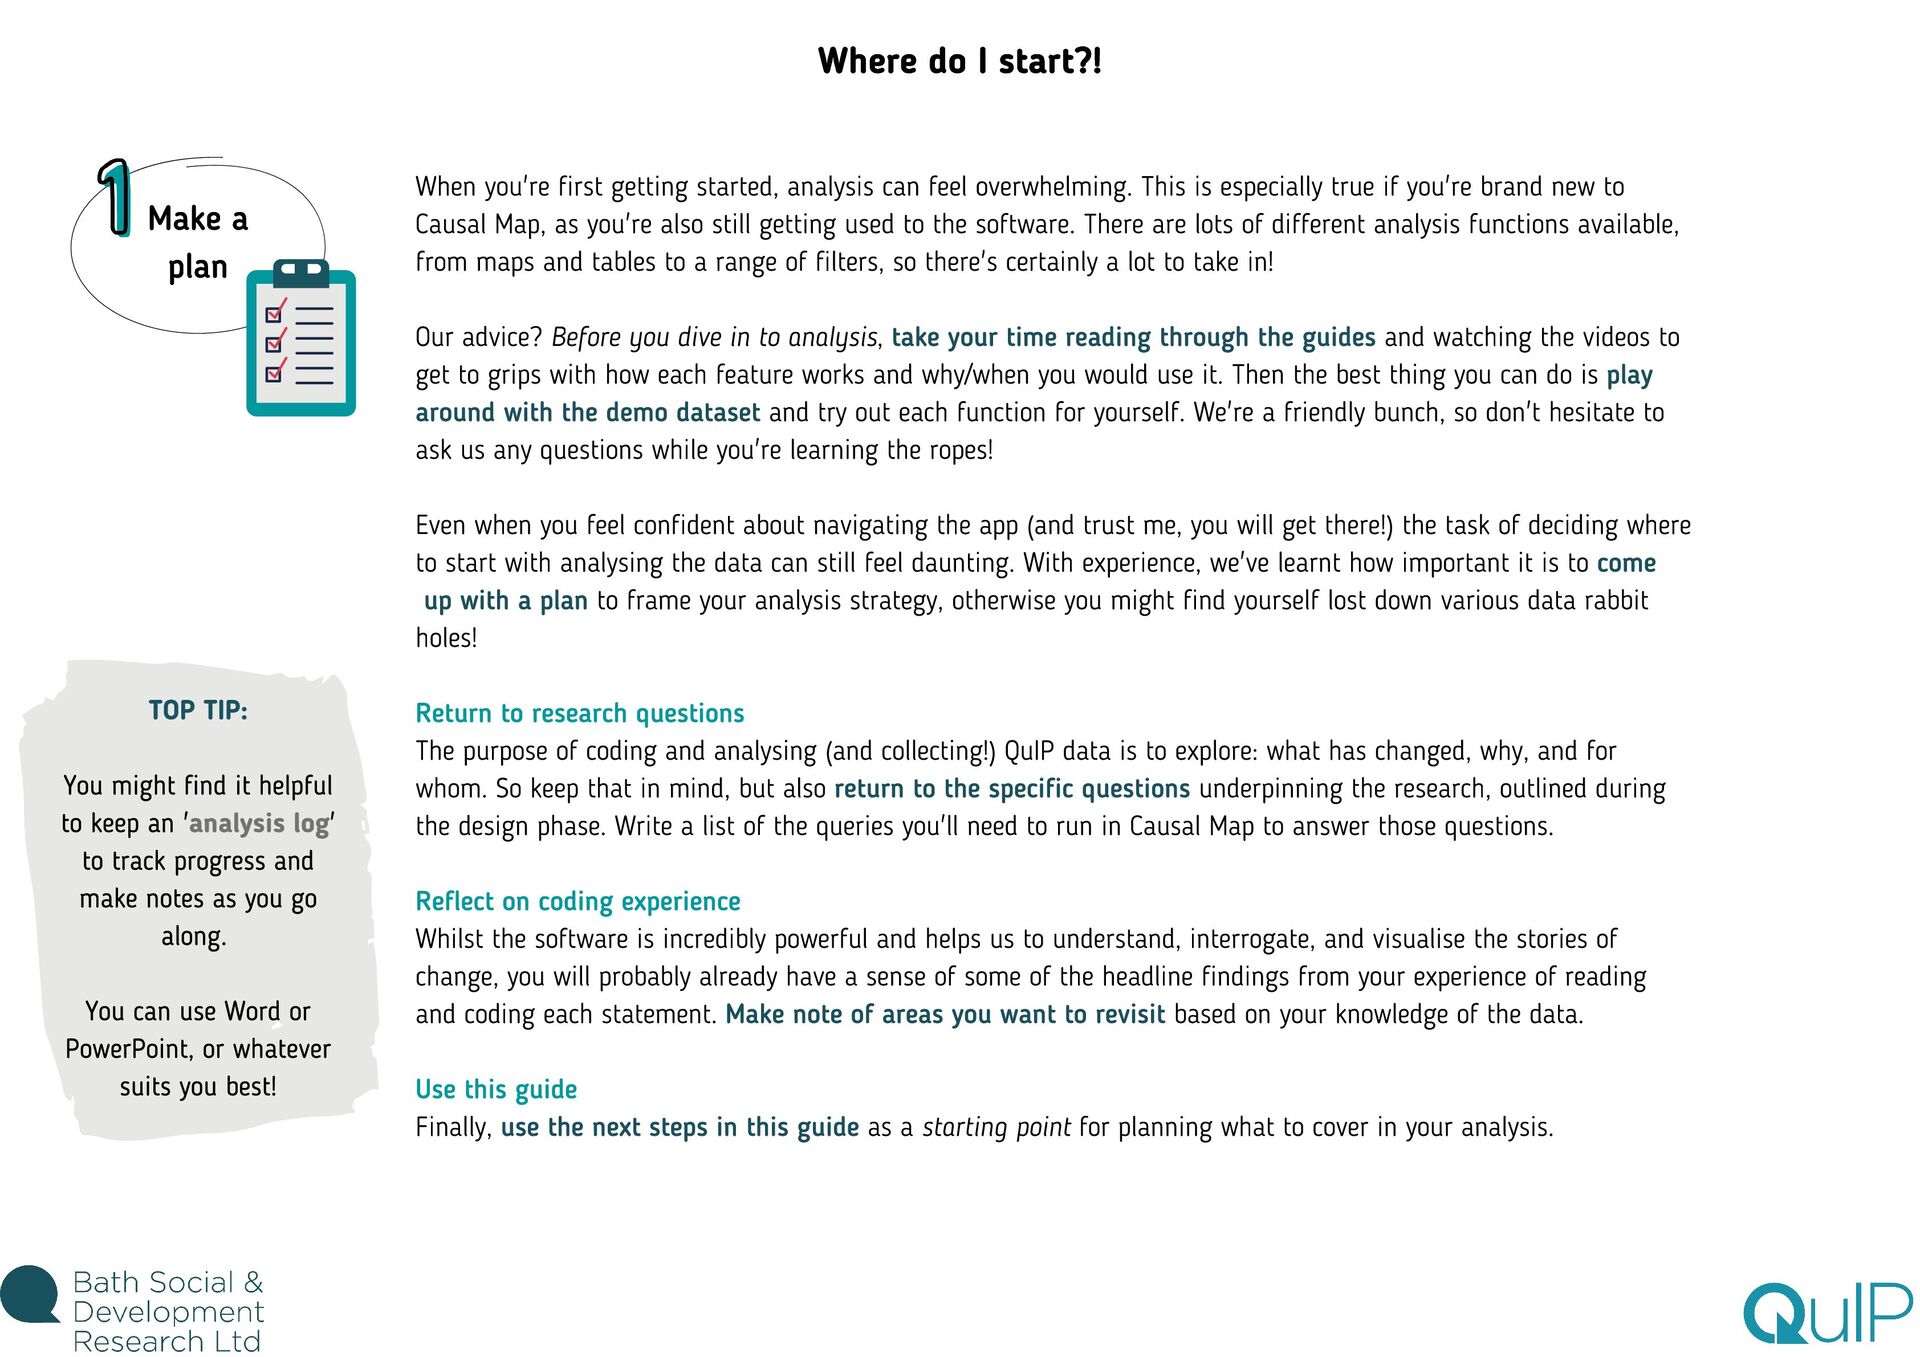
    feel overwhelming. This is especially true if you're brand new to Causal Map, as you're also still getting used to the software. There are lots of different analysis functions available, from maps and tables to a range of filters, so there's certainly a lot to take in! Our advice? Before you dive in to analysis, take your time reading through the guides and watching the videos to get to grips with how each feature works and why/when you would use it. Then the best thing you can do is play around with the demo dataset and try out each function for yourself. We're a friendly bunch, so don't hesitate to ask us any questions while you're learning the ropes! Even when you feel confident about navigating the app (and trust me, you will get there!) the task of deciding where to start with analysing the data can still feel daunting. With experience, we've learnt how important it is to come up with a plan to frame your analysis strategy, otherwise you might find yourself lost down various data rabbit holes! Return to research questions The purpose of coding and analysing (and collecting!) QuIP data is to explore: what has changed, why, and for whom. So keep that in mind, but also return to the specific questions underpinning the research, outlined during the design phase. Write a list of the queries you'll need to run in Causal Map to answer those questions. Reflect on coding experience Whilst the software is incredibly powerful and helps us to understand, interrogate, and visualise the stories of change, you will probably already have a sense of some of the headline findings from your experience of reading and coding each statement. Make note of areas you want to revisit based on your knowledge of the data. Use this guide Finally, use the next steps in this guide as a starting point for planning what to cover in your analysis. TOP TIP: You might find it helpful to keep an 'analysis log' to track progress and make notes as you go along. You can use Word or PowerPoint, or whatever suits you best! Where do I start?!
  3. The closed question responses provide a helpful 'snapshot' or overview

    of what has changed across the different domains and they can be filtered by respondent characteristics to give a high level perspective of what is changing for whom. This is a helpful place to start as it doesn't take long to get an overall sense of what change is being reported, and will likely highlight areas that need exploring further. So head on over to the Tables tab in your Causal Map file and select the 'Closed Question Summary' table from the dropdown menu. What has changed? Take a look to see how many respondents are reporting positive/negative/no change in each domain. At this point, you might want to export the data to Excel to put together a quick graph - or at least note down the key trends. What has changed for whom? The next step is to see if there are any notable differences in responses across different types of respondents. Typically this would involve comparing any clusters from your case selection strategy (e.g. male/female). As with any comparisons across respondent groups, make sure you are clear about how the sample was broken down before you start slicing and dicing the data in this way. We normally present this information towards the beginning of a QuIP report to ease the reader into the findings. However, be careful not to fall into the trap of treating this data as completely separate to the narrative text; as you explore the stories of change relating to each outcome domain, refer back and triangulate the findings - interrogating and commenting on any differences between the closed and open-ended responses. Need a bit more help on this? The analysis guide explains what the closed question tables show you, how they work, and why you'd use them in a bit more detail. How do I get a quick overview of change? TOP TIP: You might find it helpful to keep the sample and QuIP code key handy (on your computer or printed off) to remind you how many people from each category were interviewed - and what their source codes are! Snapshot of change
  4. What are the most common factors influencing change? What are

    the most frequently reported consequence factors? Are there any surprises?! Once you've got a handle on what the closed questions are telling you, it's time to dive deeper and start exploring the factors and links coded based on the respondents' narratives. To build on the snapshot of change you've got so far, identify the most common factors. The 'Factors' table lists all of the factors you applied during coding, along with the counts of how many times each factor was used as an influence or a consequence. Helpfully, these factors are ordered by frequency so you can scan the top half of the table to see the most common factors. Ask yourself questions, such as: Like with the closed questions, you should check whether there is any variation based on respondent groups, but you must differentiate here between interview type - i.e. the individual interviews and focus groups to keep the analysis separate (you can use 'filter statements' or 'group rows' for this!) This step is not all about the tables though, and for good reason - they only show frequency counts of the factors in isolation, which is interesting to an extent, but what we really need to understand is the relationships between factors and the pathways of change. So, now is a good time to move on to the maps to identify the most common links. The simplest way to do this is to use the 'Simplify' filter and move the slider along to hide less frequent links. Use 'Search and filter statements' to filter the overall map and use the slider to show the most distinctive links for different types of respondents - this will help you get a sense for which stories are unique/more common for certain groups. These steps should help you to figure out which factors and relationships need to be explored (and then reported on) in more depth. As ever, check out the analysis guide for more detailed information about how to use the filters referenced here. TOP TIP: When using the 'Factors' table, why not try switching on 'use colours' to visually highlight where a factor has been used more often as an influence/consequence How do I know which factors to explore further? Key trends
  5. Are there any similar influence factors? Are there any key

    differences across source types/respondent groups? Explore further Yes! Not really... Yes! How many times was it cited? How many respondents mentioned it? OK, so how can I go about finding out more about these key factors and links? Factor of interest Consequence Is it (mostly) an influence or a consequence? Search the map for factors downstream, review typical quotes Search the map for factors upstream, review typical quotes Influence Compare robustness Not really... Compare maps and quotes Did you use hierarchical coding for this factor? Yes! Compare maps and counts zoomed in/out No OK, next factor!!
  6. Test theory TOP TIP: It's important to keep the commissioner

    in the loop with how coding and analysis is going; this step in particular benefits from open communication as programme staff are likely to bring further insights to the table. What's the deal with linking back to the theory of change? Did respondents mention key programme inputs/activities/interventions? How often? Did respondents report mostly positive or negative change related to the programme? Have the interventions had any unintended or unexpected outcomes? How did the programme compare to other factors in terms of influencing the main intended outcomes? Are there any key differences between the theory of change and the mapped pathways? Are there any new insights? Or is there perhaps something missing? The final piece of the analysis puzzle is to test the theory of change (as presented in the programme's documentation) and to compare it to the pathways of change mapped out by your analysis. This last step can sometimes overlap with exploring key factors because often (but by no means always!) programme-related drivers and intended outcomes do appear among the most frequently reported factors. If you've used attribution flags in your factor labels (such as E for Explicit / I for Implicit) then you can search and filter for these! Here are some suggestions of questions to reflect on: The answers to these questions often prompt further analysis and are likely to form the basis of the discussion section in the report.
  7. TOP TIP: Gather quotes and visuals (maps/graphs) as you go

    along, it makes reporting so much easier/quicker! Any time you pull out a map or quote make sure you make a note of which filters were applied and/or the source/statement info, etc. What should I include from my analysis in the report? Now that you've spent all that time collecting, coding, and analysing the data - it's time to pull all that information together into a report/presentation. Ultimately, it's up to you to decide how best to present the research findings in a way that works well for your audience; so, take our report structure as a framework and adapt it as required. QuIP reports vary somewhat depending on the commissioner and the project, but they almost always begin with an executive summary (1-2 pages highlighting the headline findings), followed by an overview of the programme and research questions, and then an introduction to QuIP including details about how the methodology was applied in the study (including questionnaire design and case selection strategy). After that necessary groundwork, it's then onto the more substantive sections drawn from the analysis: Snapshot of change We normally present the data from the closed questions upfront as a gentle easing in to the findings, and to provide some overall context about what is reported to have changed during the recall period. This includes an overview graph showing the direction of change for each domain/closed question, supported by a brief narrative summary. If there are any differences in closed responses across respondent groups, then they are noted here; if the differences are particularly noteworthy it's a good idea to use another graph to highlight them. Stories of change We choose around 4-5 key stories of change to focus on - drawn from the exploratory analysis of the (open ended) causal narratives. For each story of change we typically include: - a narrative summary of the pathways of change, which might include reference to factor/link counts - at least 1-2 causal maps (make sure to reference the filters you applied in any figure labels!) - a few carefully selected quotes to ground the story in the words of the respondents - a discussion of key differences between source types (e.g. II/FGD) and respondent groups, supplemented with additional graphs/maps/quotes where relevant Report back
  8. Discussion Here we usually summarise the findings and discuss them

    in relation to the research questions and theory of change under evaluation. Unless a subject specialist has been involved, QuIP reports do not contain recommendations for the programme, but if appropriate they might highlight areas where further research would be beneficial. Need a bit more help on this? If you are working as a freelancer for Bath SDR, check out our report template and data visualisation guide. What's next for this fantastic report?! Whether you write up a full report or prepare a powerpoint, we strongly recommend organising participatory workshops with relevant stakeholders to discuss the research insights, triangulate the findings with other sources of data, and plan next steps. Where possible, research participants should be included in these continuing conversations and offered an opportunity to elaborate on, clarify, and validate results. We've found this validation process works well when facilitated by the research team, but this can also be managed by programme staff. At the very least, there needs to be a plan for unblindfolding respondents - i.e. communicating the purpose and findings of the research. What should I include from my analysis in the report? (cont.) Report back Next steps