Upgrade to Pro — share decks privately, control downloads, hide ads and more …

Business intelligence and data warehousing

Business intelligence and data warehousing

Slides for FIT3003 individual presentation assignment

Jack Oliver

October 09, 2021
Tweet

More Decks by Jack Oliver

Other Decks in Technology

Transcript

  1. Business intelligence tools in the domain of data warehousing Jack

    Oliver; 30734592; FIT3003 — Business intelligence and data warehousing; Tutorial 04 (Chin, 2020)
  2. Agenda Motivation; what are BI tools? Two case studies; function

    and purpose; evaluation Role of BI tools in conjunction with data warehousing Use cases & conclusion
  3. Summary statistics: Anscombe’s Quartet Motivation x y 8.0 6.58 8.0

    5.76 8.0 7.71 8.0 8.84 8.0 8.47 8.0 7.04 8.0 5.25 19.0 12.50 8.0 5.56 8.0 7.91 8.0 6.89 x y 10.0 8.04 8.0 6.95 13.0 7.58 9.0 8.81 11.0 8.33 14.0 9.96 6.0 7.24 4.0 4.26 12.0 10.84 7.0 4.82 5.0 5.68 x y 10.0 9.14 8.0 8.14 13.0 8.74 9.0 8.77 11.0 9.26 14.0 8.10 6.0 6.13 4.0 3.10 12.0 9.13 7.0 7.26 5.0 4.74 x y 10.0 7.46 8.0 6.77 13.0 12.74 9.0 7.11 11.0 7.81 14.0 8.84 6.0 6.08 4.0 5.39 12.0 8.15 7.0 6.42 5.0 5.73 𝜇 x 9.0 V[x] 11.0 𝜇 y 7.50 V[y] 4.125 cor(x, y) 0.816 R2 0.67 (Anscombe, 1973)
  4. Anscombe’s Quartet Motivation 𝜇 x 9.0 V[x] 11.0 𝜇 y

    7.50 V[y] 4.125 cor(x, y) 0.816 R2 0.67 (Wikipedia, 2010)
  5. Key takeaway: Manually analyzing and interpreting (huge amounts of) data

    in tabular, plain-text format is very difficult.
  6. Solution: BI tools Key takeaway: Manually analyzing and interpreting (huge

    amounts of) data in tabular, plain-text format is very difficult.
  7. Solution: BI tools Key takeaway: Manually analyzing and interpreting (huge

    amounts of) data in tabular, plain-text format is very difficult. … a framework that allows a business to transform data into information, information into knowledge, and knowledge into wisdom. (Haryanto, 2021)
  8. Solution: BI tools Key takeaway: Manually analyzing and interpreting (huge

    amounts of) data in tabular, plain-text format is very difficult. … a framework that allows a business to transform data into information, information into knowledge, and knowledge into wisdom. Programmable and customizable software and suites to produce reports and aid the business intelligence framework (Haryanto, 2021)
  9. Solution: BI tools Key takeaway: Manually analyzing and interpreting (huge

    amounts of) data in tabular, plain-text format is very difficult. … a framework that allows a business to transform data into information, information into knowledge, and knowledge into wisdom. Programmable and customizable software and suites to produce reports and aid the business intelligence framework (Haryanto, 2021) Software to facilitate business intelligence analysis by retrieving data and driving insights, analysis, transforming data into reports.
  10. Solution: Reports in (normally) non-tabular format to visualize and interact

    with data intuitively ("What is a dashboard and how do I open it?", 2021) (de Boisset, 2021)
  11. Solution: Reports in (normally) non-tabular format to visualize and interact

    with data intuitively ("What is a dashboard and how do I open it?", 2021) (de Boisset, 2021) • “... decreases the amount of manual work and enables resource optimization” (Ratia, Myllärniemi & Helander, 2017) • Transform fed data into information to deliver insights via reports ◦ Visualization ◦ Interactivity ◦ Presentation ◦ (Narrative) theoretical goal
  12. Tool 1 — Power BI • Seamless integration with Microsoft

    Office ecosystem • Accessible via desktop, mobile, & hosted online applications • Powerful visualization and analytical tool to allow generation of reports • Allows for transformation of data in-house, and live updation of reports based on data ("Microsoft Power BI", 2021)
  13. Tool 1 — Power BI • Seamless integration with Microsoft

    Office ecosystem • Accessible via desktop, mobile, & hosted online applications • Powerful visualization and analytical tool to allow generation of reports • Allows for transformation of data in-house, and live updation of reports based on data ("Microsoft Power BI", 2021)
  14. Tool 1 — Power BI • Seamless integration with Microsoft

    Office ecosystem • Accessible via desktop, mobile, & hosted online applications • Powerful visualization and analytical tool to allow generation of reports • Allows for transformation of data in-house, and live updation of reports based on data ("Microsoft Power BI", 2021)
  15. Tool 2 — Tableau • Dynamic focus on organizations, businesses,

    and communities • Accessible via desktop, mobile, & hosted online applications • Powerful, highly customizable visualization tool to allow generation of reports • Live updation of reports based on data, with ETL supported by Tableau Prep ("Tableau Prep", 2021)
  16. Tool 2 — Tableau • Dynamic focus on organizations, businesses,

    and communities • Accessible via desktop, mobile, & hosted online applications • Powerful, highly customizable visualization tool to allow generation of reports • Live updation of reports based on data, with ETL supported by Tableau Prep ("Tableau Prep", 2021)
  17. Tool 2 — Tableau • Dynamic focus on organizations, businesses,

    and communities • Accessible via desktop, mobile, & hosted online applications • Powerful, highly customizable visualization tool to allow generation of reports • Live updation of reports based on data, with ETL supported by Tableau Prep ("Tableau Prep", 2021)
  18. present information in a visual format that is intuitive and

    insightful Aside: where do BI tools come into play? aggregate & consolidate data from database(s) to support decision-making analysis
  19. Is there a difference? • Dynamic focus on organizations, businesses,

    and communities • Accessible via desktop, mobile, & hosted online applications • Powerful, highly customizable visualization tool to allow generation of reports • Live updation of reports based on data, with ETL supported by Tableau Prep • Seamless integration with Microsoft Office ecosystem • Accessible via desktop, mobile, & hosted online applications • Powerful visualization and analytical tool to allow generation of reports • Allows for transformation of data in-house, and live updation of reports based on data
  20. Is there a difference? — Similarities • Dynamic focus on

    organizations, businesses, and communities • Accessible via desktop, mobile, & hosted online applications • Powerful, highly customizable visualization tool to allow generation of reports • Live updation of reports based on data, with ETL supported by Tableau Prep • Seamless integration with Microsoft Office ecosystem • Accessible via desktop, mobile, & hosted online applications • Powerful visualization and analytical tool to allow generation of reports • Allows for transformation of data in-house, and live updation of reports based on data
  21. Is there a difference? — Separation • Dynamic focus on

    organizations, businesses, and communities • Accessible via desktop, mobile, & hosted online applications • Powerful, highly customizable visualization tool to allow generation of reports • Live updation of reports based on data, with ETL supported by Tableau Prep ("Tableau Prep", 2021) • Seamless integration with Microsoft Office ecosystem • Accessible via desktop, mobile, & hosted online applications • Powerful visualization and analytical tool to allow generation of reports • Allows for transformation of data in-house, and live updation of reports based on data
  22. • Visualized a marketing summary of applicants in higher education

    • Found Tableau to “accommodate the presence of data warehousing and business intelligence process faster” • Concluded Tableau did “not have complete ETL tools … combining [data warehouse] certainly makes Tableau as a BI tool more useful in presenting data” In motion: Tableau (Lokaadinugroho, Girsang & Burhanudin, 2021)
  23. • Visualized 46 sensors and thermocouples of green roofs •

    Claimed Power BI bridged the gap between “spreadsheets and statistical tools, [and] knowledge workers and the piles of data” • Concluded Power BI was a “user-friendly package with Microsoft’s industrial-sized support infrastructure” In motion: Power BI (Becker & Gould, 2019) (Carlisle, 2018)
  24. BI tools are a means to facilitate business intelligence analytics

    through (interactive) visualization and reports Concluding thoughts BI tools have varying degrees of power and transformative capacity in regards to ETL processes Data warehousing is strongly encouraged and can be used with both Tableau and Power BI to speed up and enhance statistical insights by transformation of data prior to visualization Tableau and Power BI have vast similarities, but their slight differences makes them uniquely geared towards different methodologies
  25. Anscombe, F. (1973). Graphs in Statistical Analysis. The American Statistician,

    27(1), 17. doi: 10.2307/2682899 Becker, L., & Gould, E. (2019). Microsoft Power BI: Extending Excel to Manipulate, Analyze, and Visualize Diverse Data. Serials Review, 45(3), 184-188. doi: 10.1080/00987913.2019.1644891 Carlisle, S. (2018). Software: Tableau and Microsoft Power BI. Technology|Architecture + Design, 2(2), 256-259. doi: 10.1080/24751448.2018.1497381 Chin, C. (2020). The Rise and Fall of the OLAP Cube. Retrieved 7 October 2021, from https://www.holistics.io/blog/the-rise-and-fall-of-the-olap-cube/ de Boisset, S. (2021). 6 dashboards from Tableau partners to help you mitigate COVID-19 impacts. Retrieved 7 October 2021, from https://www.tableau.com/about/blog/2020/5/6-dashboards-tableau-partners-help-you-mitigate-covid-19-impacts Haryanto, A. (2021). – Introduction to Business Intelligence and Data Warehousing. Presentation, Monash University. Lokaadinugroho, I., Girsang, A., & Burhanudin, B. (2021). Tableau Business Intelligence Using the 9 Steps of Kimball’s Data Warehouse & Extract Transform Loading of the Pentaho Data Integration Process Approach in Higher Education. Engineering, Mathematics And Computer Science (EMACS) Journal, 3(1), 1-11. doi: 10.21512/emacsjournal.v3i1.6816 Microsoft Power BI. (2021). Retrieved 7 October 2021, from https://powerbi.microsoft.com/en-us/power-bi-and-office/ Ratia, M., Myllärniemi, J., & Helander, N. (2017). Benefits and required capabilities of BI-tools in the private healthcare. Proceedings Of The 21St International Academic Mindtrek Conference. doi: 10.1145/3131085.3131128 Tableau Prep. (2021). Retrieved 7 October 2021, from https://www.tableau.com/products/prep What is a dashboard and how do I open it?. (2021). Retrieved 7 October 2021, from https://docs.microsoft.com/en-us/power-bi/consumer/end-user-dashboards Wikipedia. (2010). [Image]. Retrieved from https://commons.wikimedia.org/w/index.php?curid=9838454 Reference list
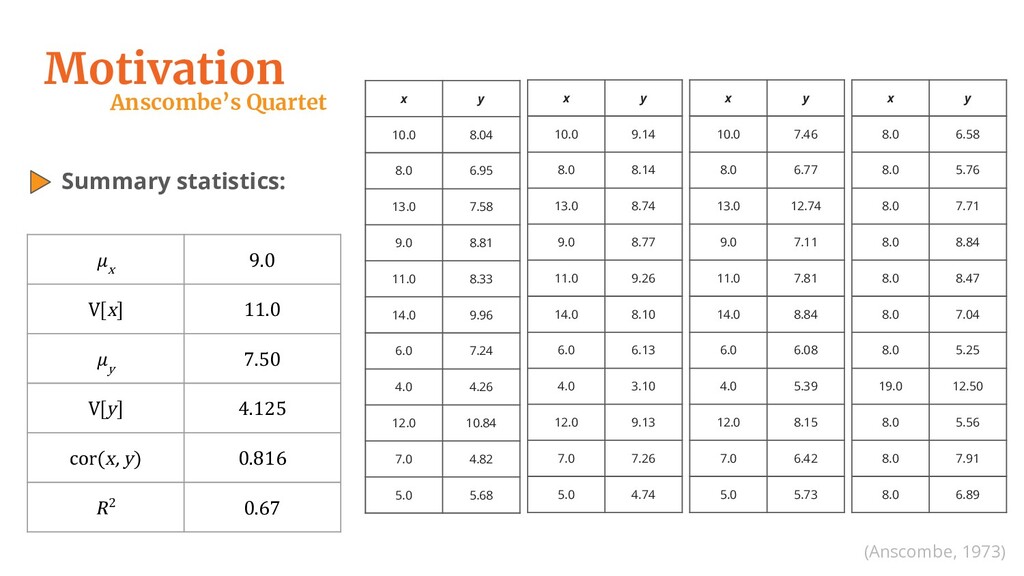