Upgrade to Pro — share decks privately, control downloads, hide ads and more …

Inspect The Uninspected

Inspect The Uninspected

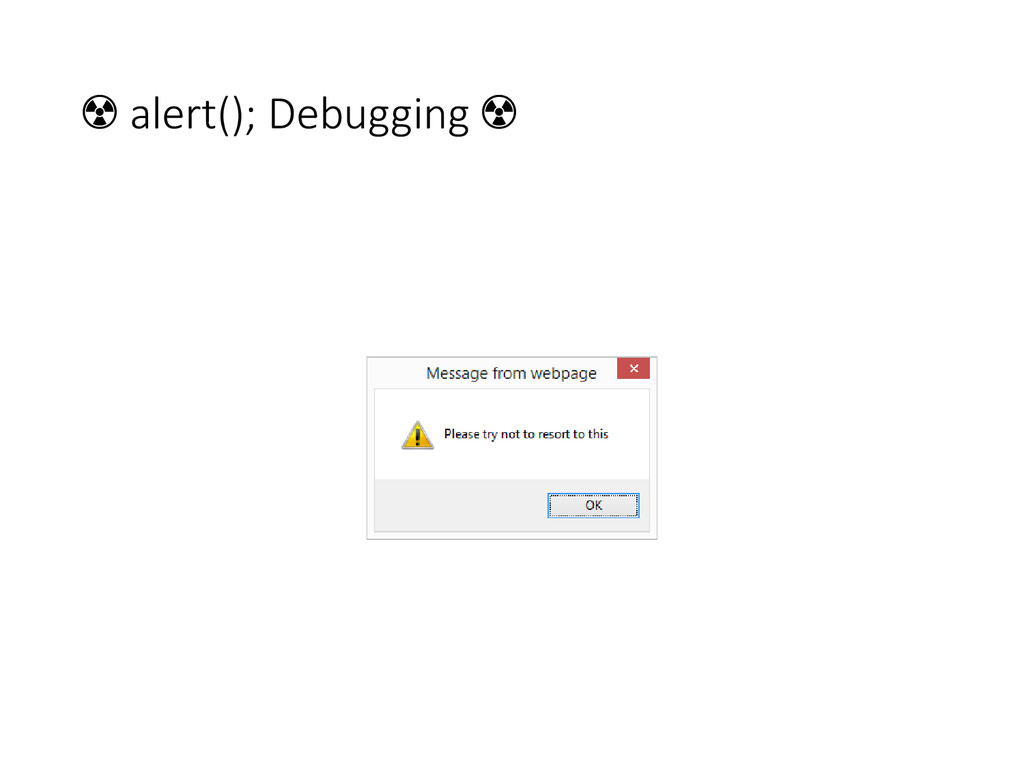
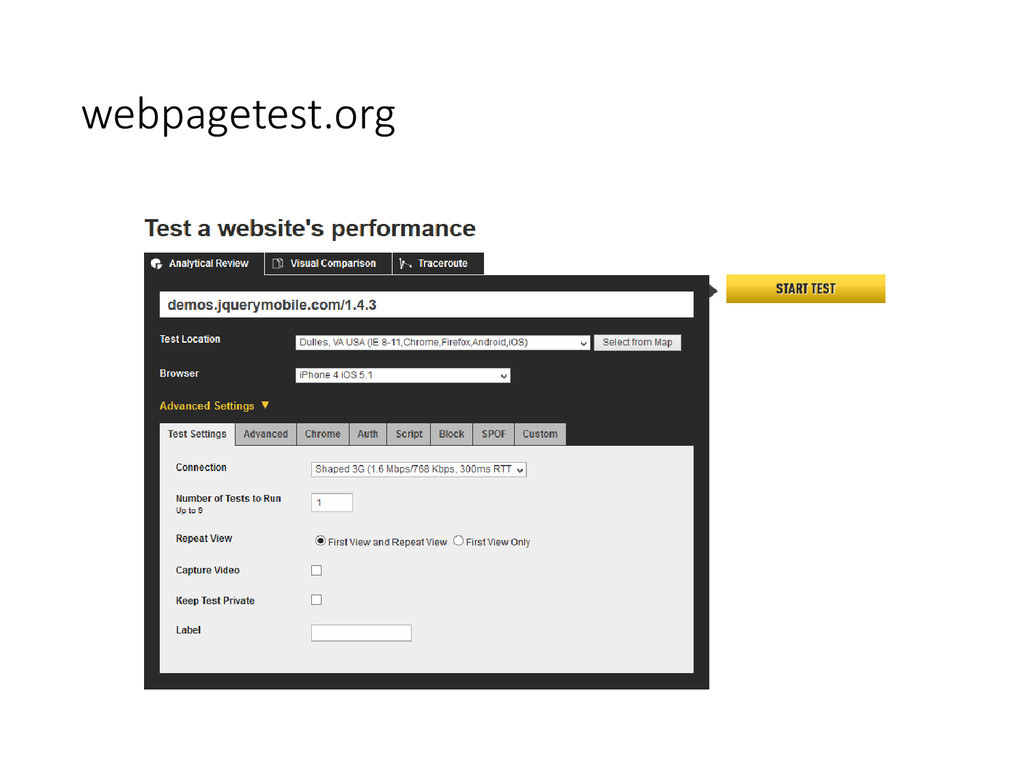
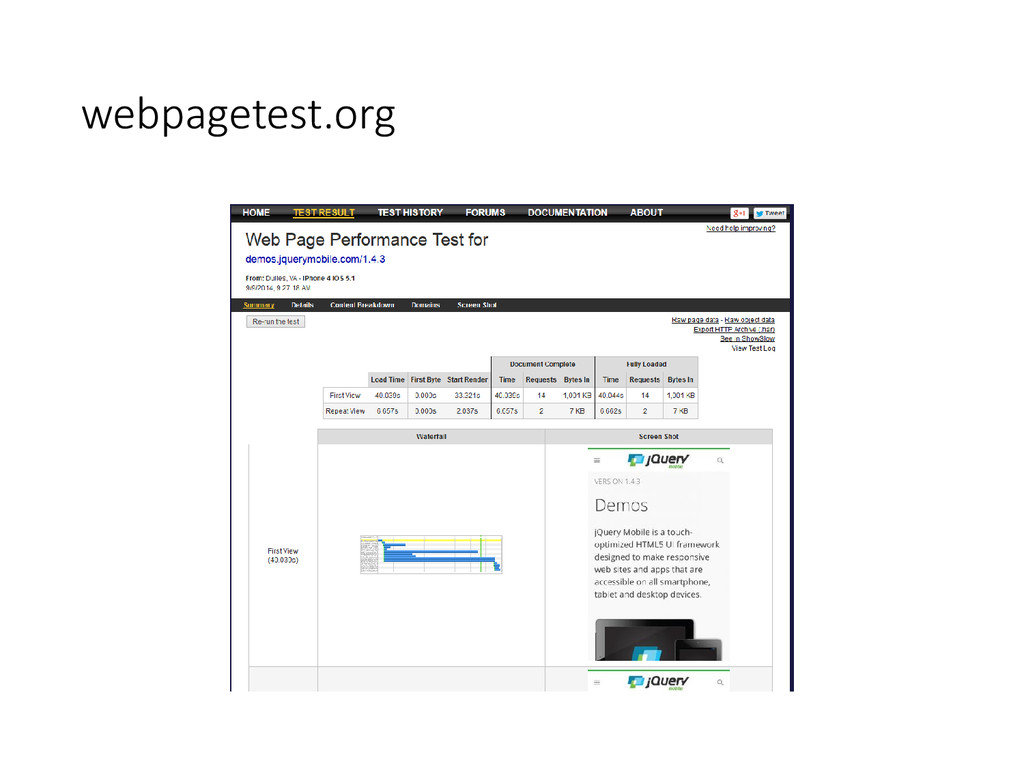
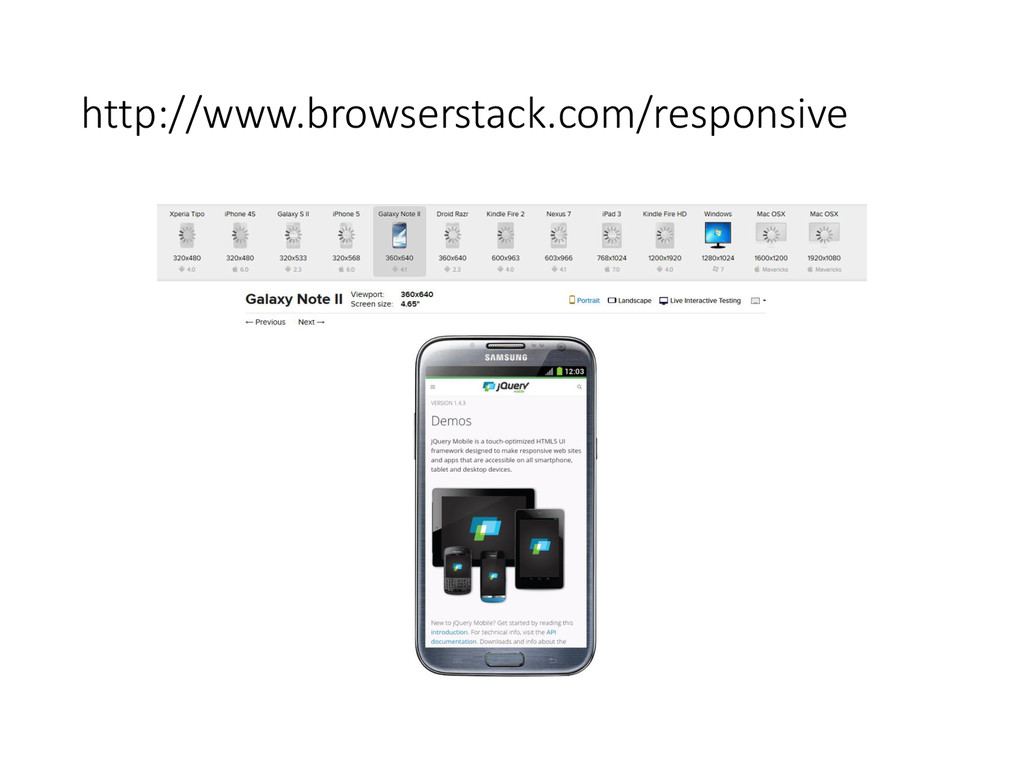
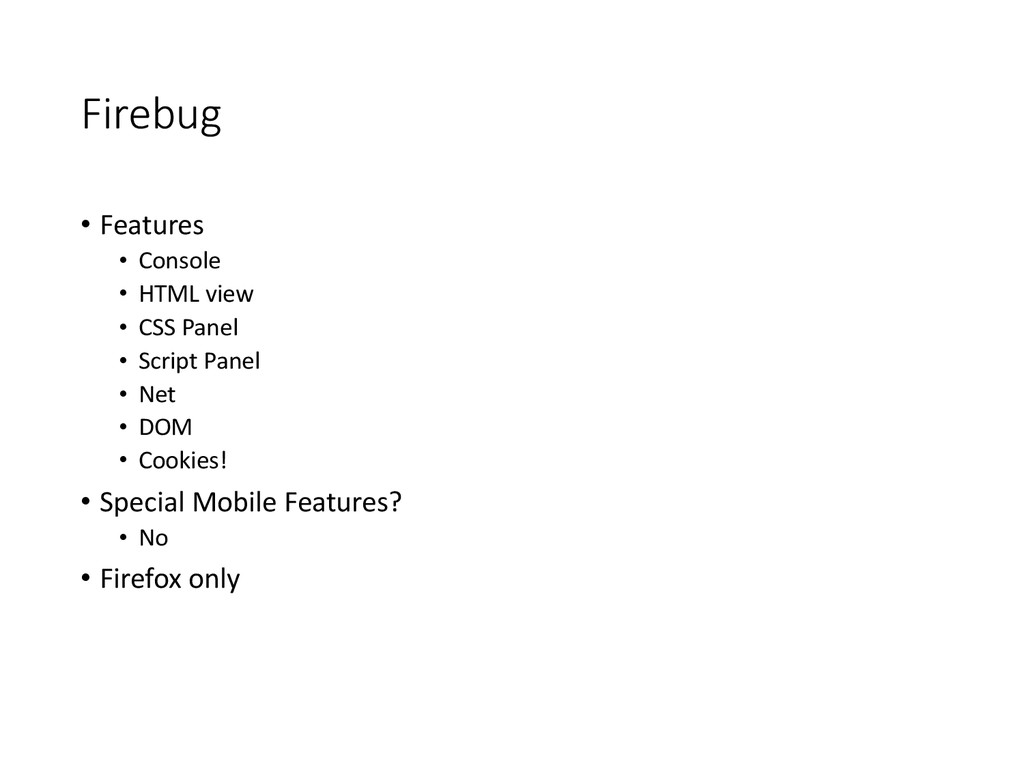
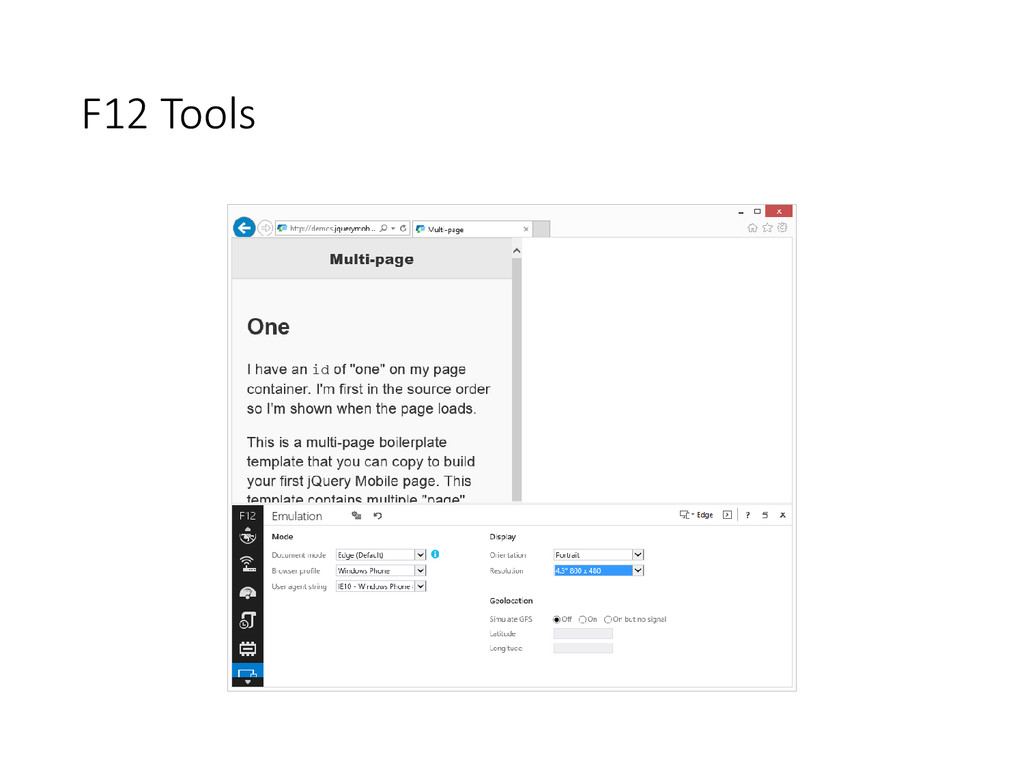
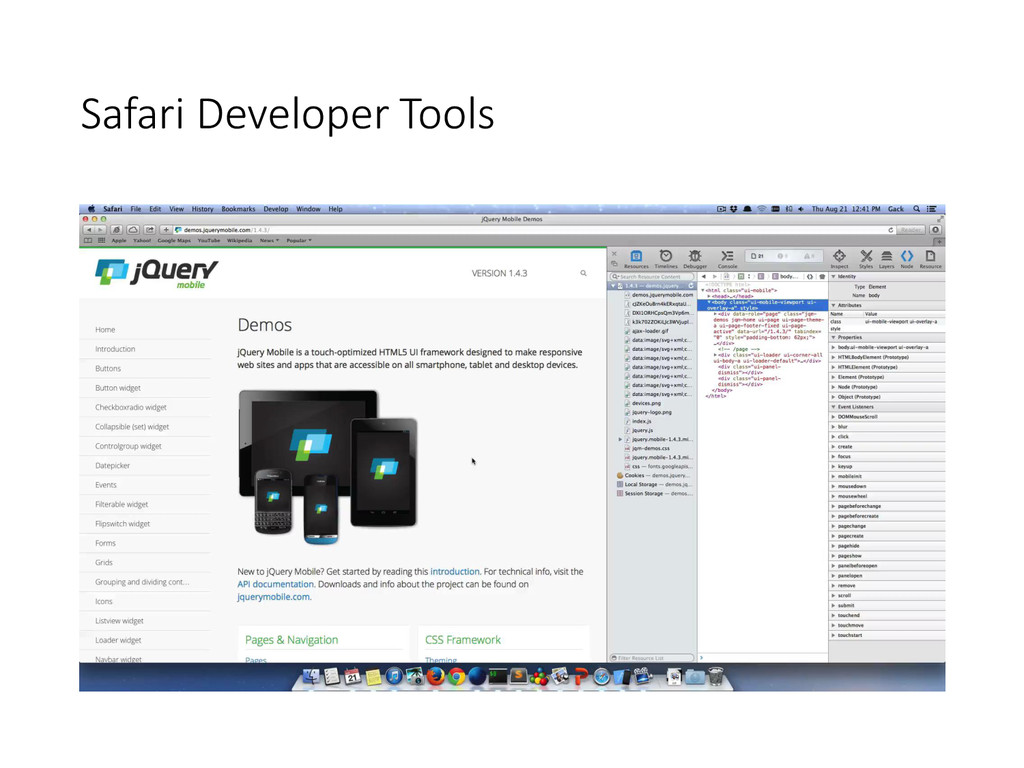
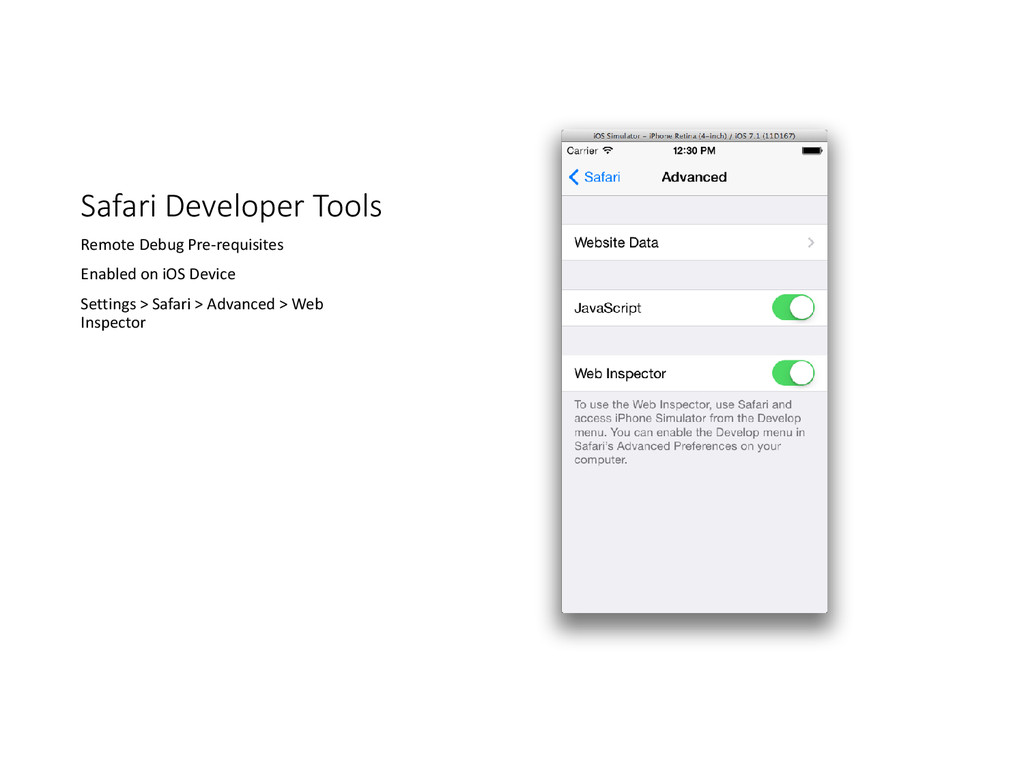
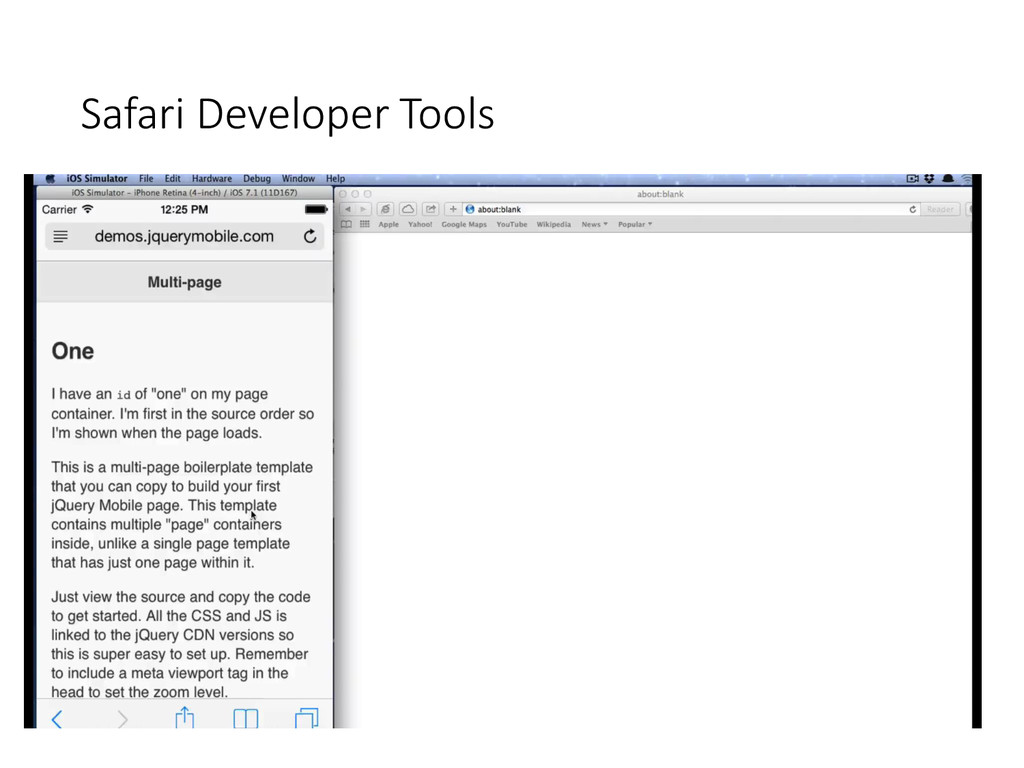
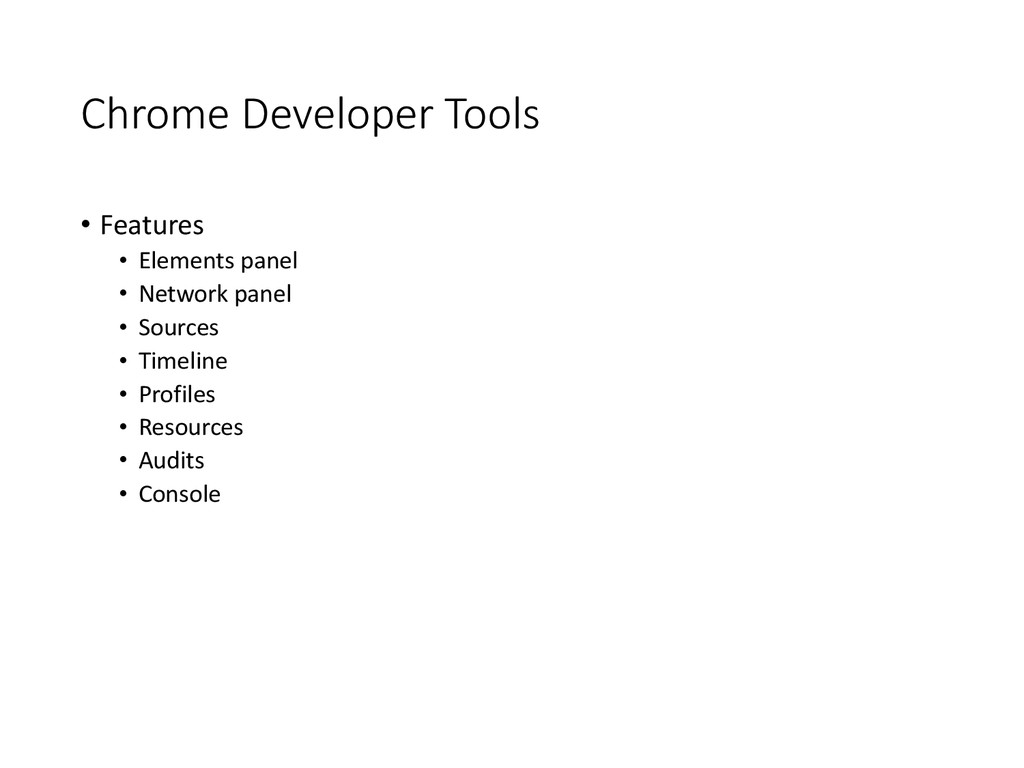
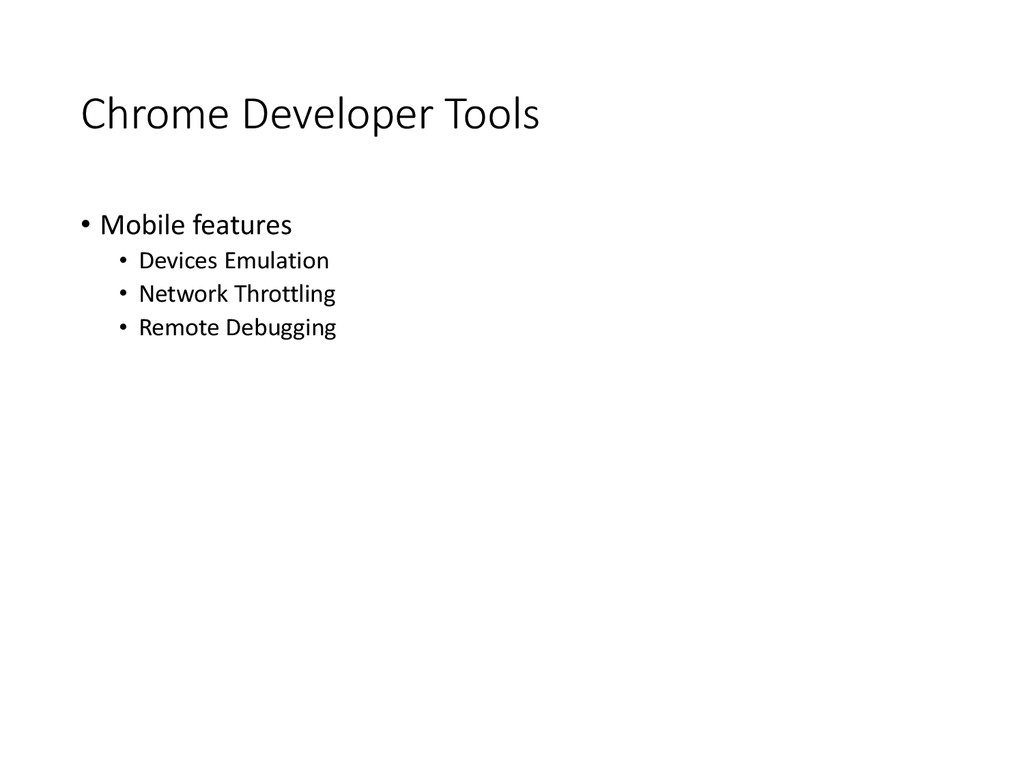
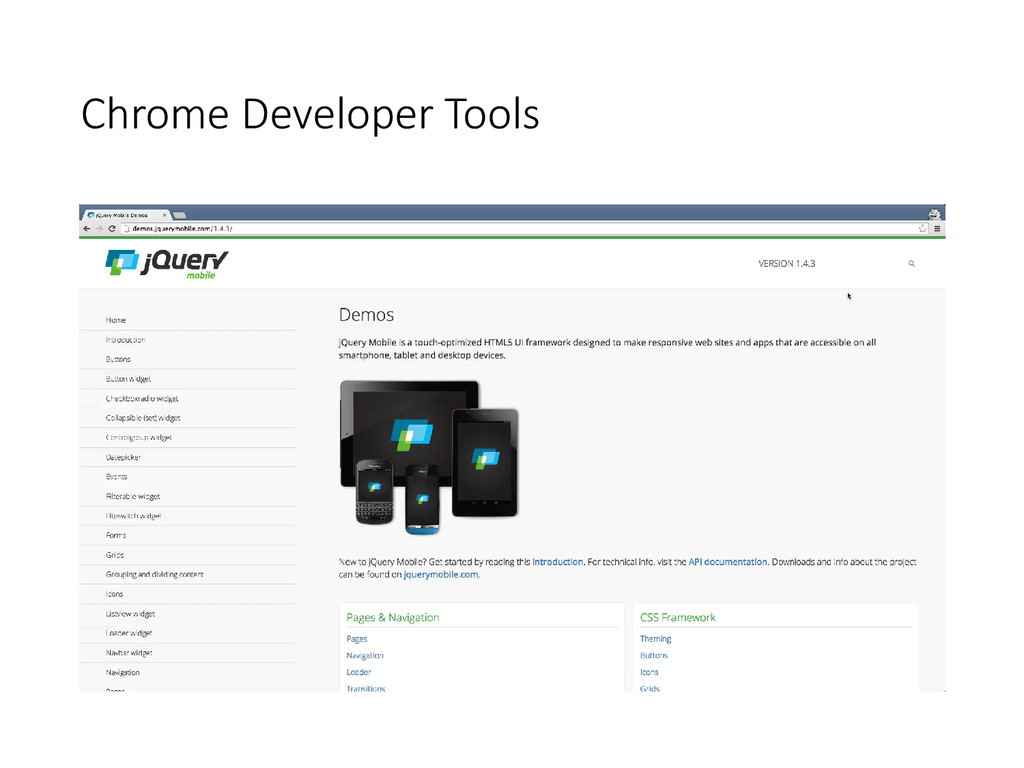
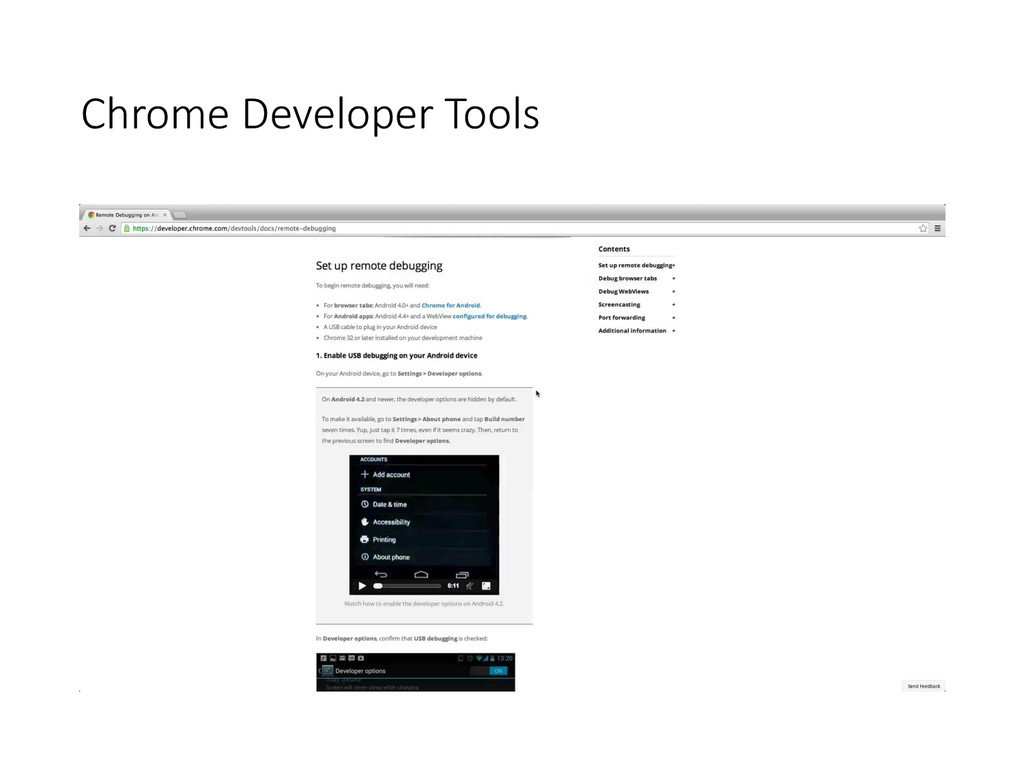
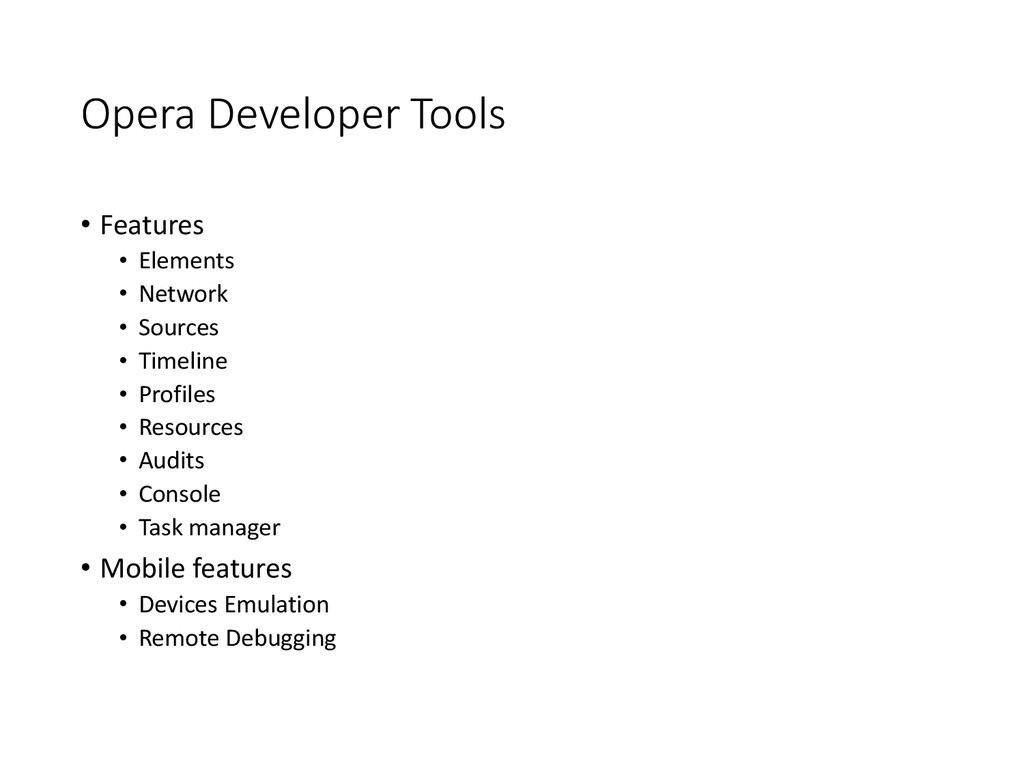
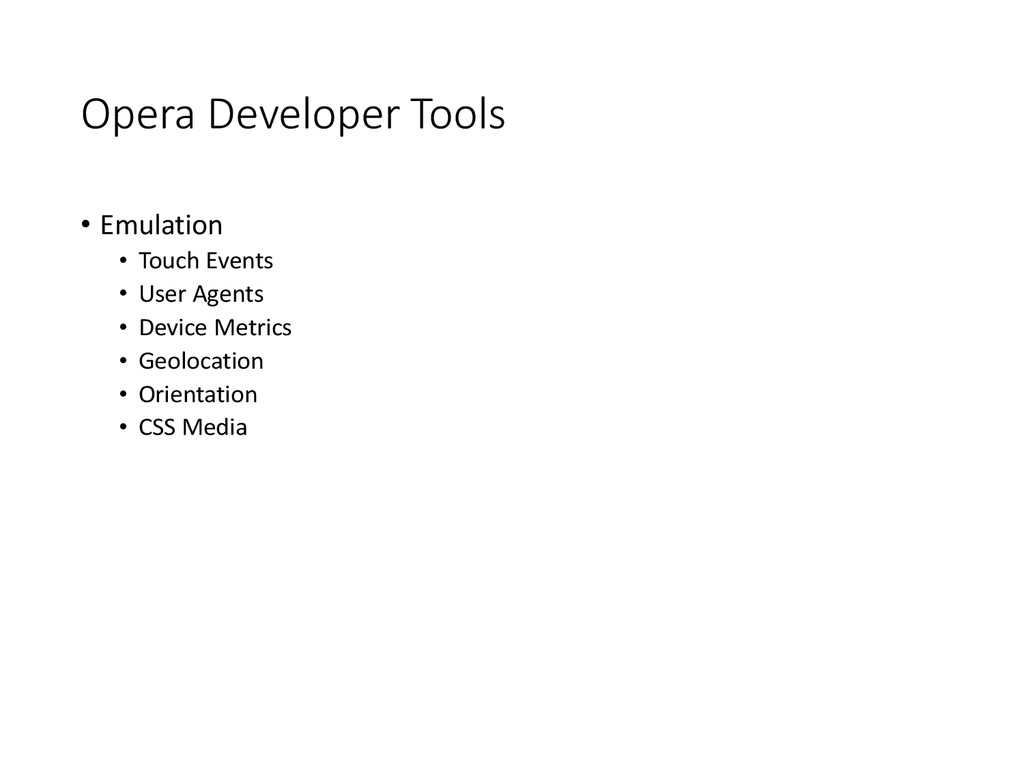
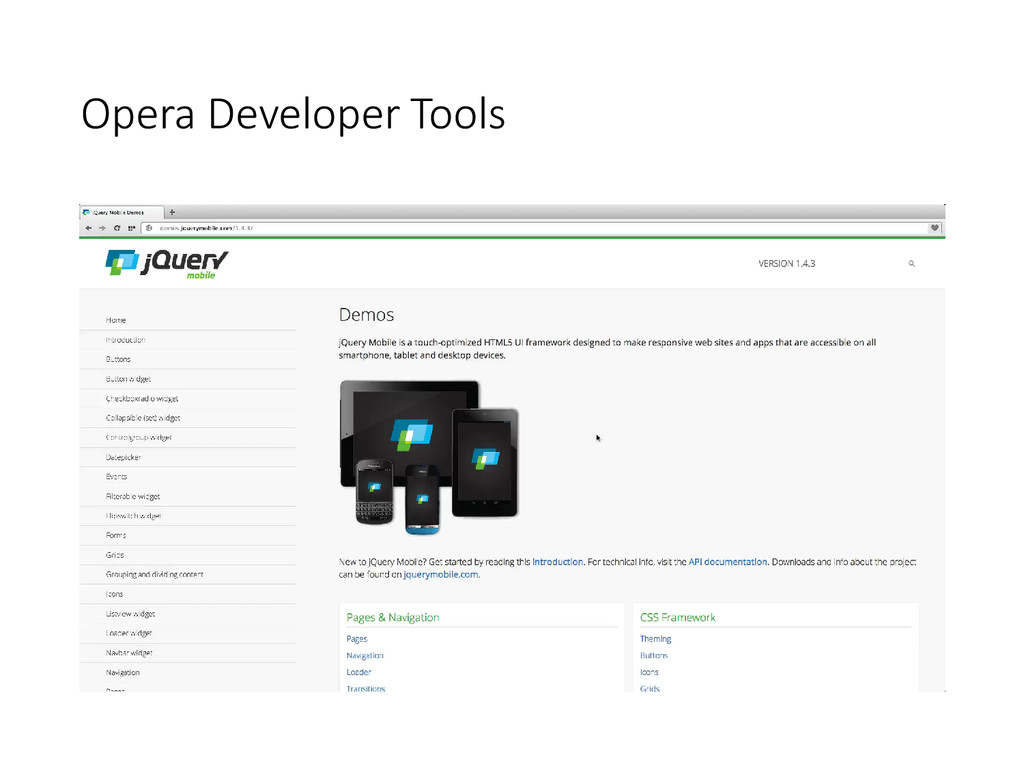
Web sites and web applications provide a special flavor of debugging for developers. The techniques used can range from archaic and brute force alert() debugging, to simply altering the code and refreshing your browser until it seems to work. Ideally you will utilize some more advanced developer tooling but many are left confused when it comes to debugging a mobile site because the mobile debugging landscape changes so fast. In this talk I will highlight some common mobile debugging techniques from in-browser emulation to remote debugging solutions from weinre to browser developer tools that allow for remote debugging.

original file with videos: https://www.dropbox.com/s/vtq8ur080it789z/InspectTheUninspected.pptx?dl=0

Cory Gackenheimer

September 13, 2014
Tweet

Other Decks in Programming

Transcript

  1. About Me • Job • @Healthx • Open Source Contributor

    • jQuery Mobile • Mozilla • Author • Node.js Recipes • available @ apress.com • Screencast available soon @ safaribooksonline.com • Debugging Mobile Web Applications • http://leanpub.com/DebuggingMobile
  2. What’s Covered • First Steps • Using Desktop Browsers for

    Mobile Development • Life Outside of Browser Vendors’ Silos • The Promising Future
  3. Firebug • Features • Console • HTML view • CSS

    Panel • Script Panel • Net • DOM • Cookies! • Special Mobile Features? • No • Firefox only
  4. Firebug • Dock Right or Left • Resize panel for

    responsive breakpoint testing • Tip: use the option “Vertical Panels” to limit UI noise when docked left or right.
  5. Firebug lite • Limited Firebug features as a bookmarklet •

    Can be used in nearly any browser • No real-time editing features but does include: • Console • HTML Inspector • CSS Panel • Script Panel (view only) • DOM Panel • No special mobile features
  6. IE’s F12 Tools • Features • DOM Explorer • Console

    • Debugger • Networking • UI Responsiveness • Profiler • Memory • Mobile Special Features • Emulation (also emulate old IE here)
  7. Safari Developer Tools • Features • Resources • Timelines •

    Debugger • Console • Inspect • Node • Layers • Special Mobile Features • Remote Debugging
  8. Chrome Developer Tools • Features • Elements panel • Network

    panel • Sources • Timeline • Profiles • Resources • Audits • Console
  9. Opera Developer Tools • Features • Elements • Network •

    Sources • Timeline • Profiles • Resources • Audits • Console • Task manager • Mobile features • Devices Emulation • Remote Debugging
  10. Opera Developer Tools • Emulation • Touch Events • User

    Agents • Device Metrics • Geolocation • Orientation • CSS Media
  11. Firefox Developer Tools • Features • Inspector • Console •

    Debugger • Style Editor • Performance • Network • Shader Editor • Canvas • Web Audio Editor • Developer Toolbar
  12. jsconsole.com • Browser Based Tool • Can add a script

    to a remote page for console access • I use it for quick access while developing and accessing old Android
  13. Remote Debugging Protocol • Every Vendor has one • A

    Unified one would be great • We could then use <insert favorite tools> to debug anything
  14. Remote Debugging Protocol • A first glimpse of unification •

    https://github.com/campd/fxdt-adapters/ • Use Firefox Developer Tools to debug • Firefox • Firefox for Android • FirefoxOS • Chrome • Chrome for Android • iOS Safari
  15. Fxdt-adapters • Still Early Experiments • Lots of manual configuration

    • Manual port forwarding • Run > node proxy.js • ios_webkit-debug-bridge for safari • Basically an Add-on for Firefox that bridges the debugging protocol gap