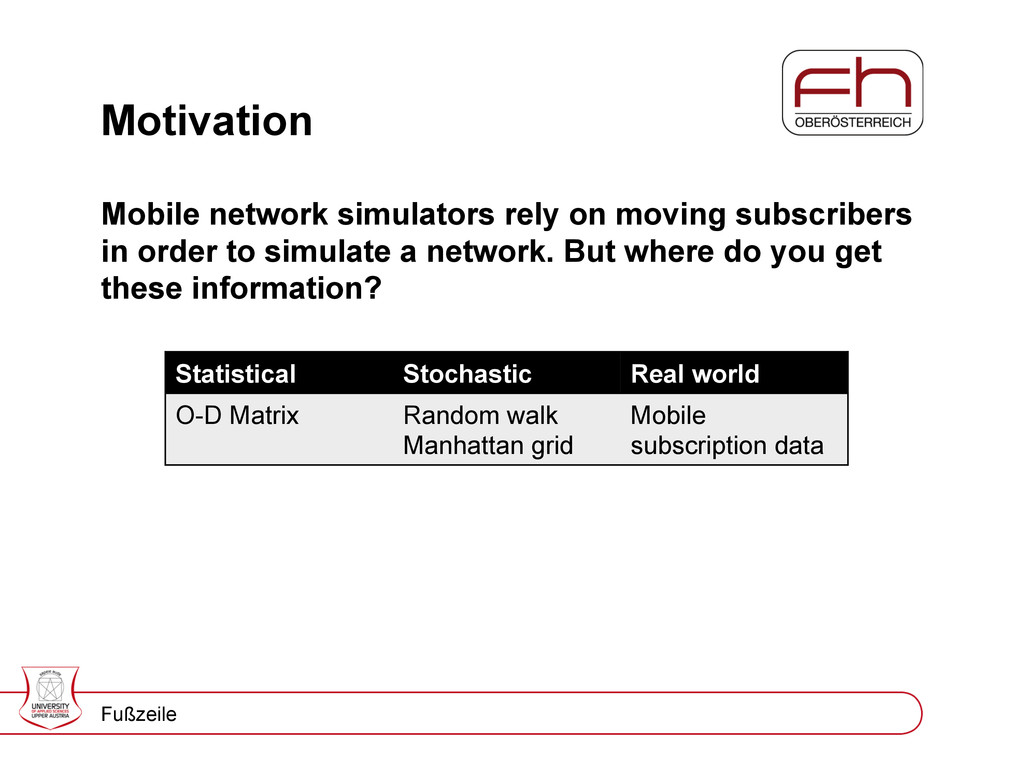
subscribers in order to simulate a network. But where do you get these information? Statistical Stochastic Real world O-D Matrix Random walk Manhattan grid Mobile subscription data
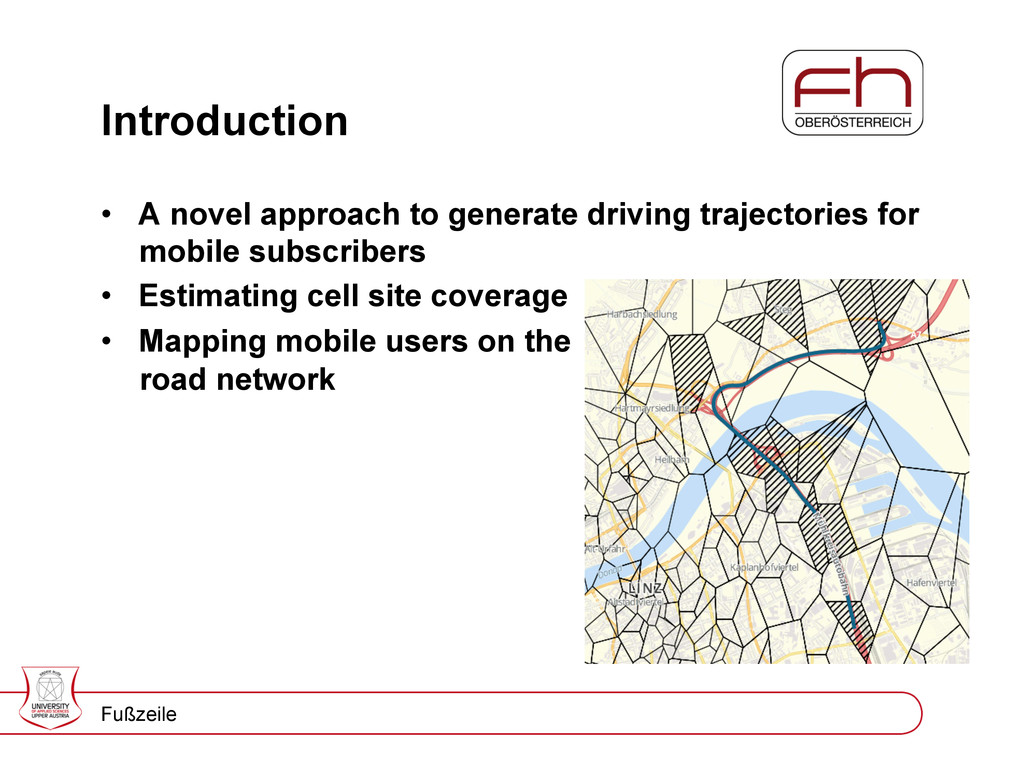
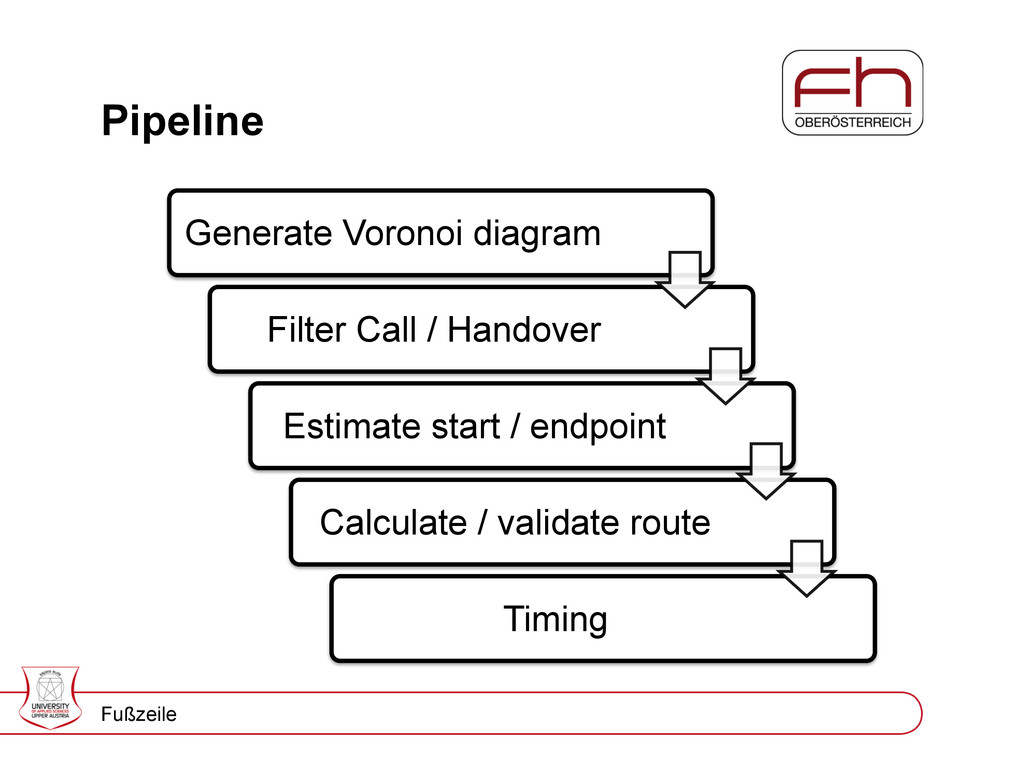
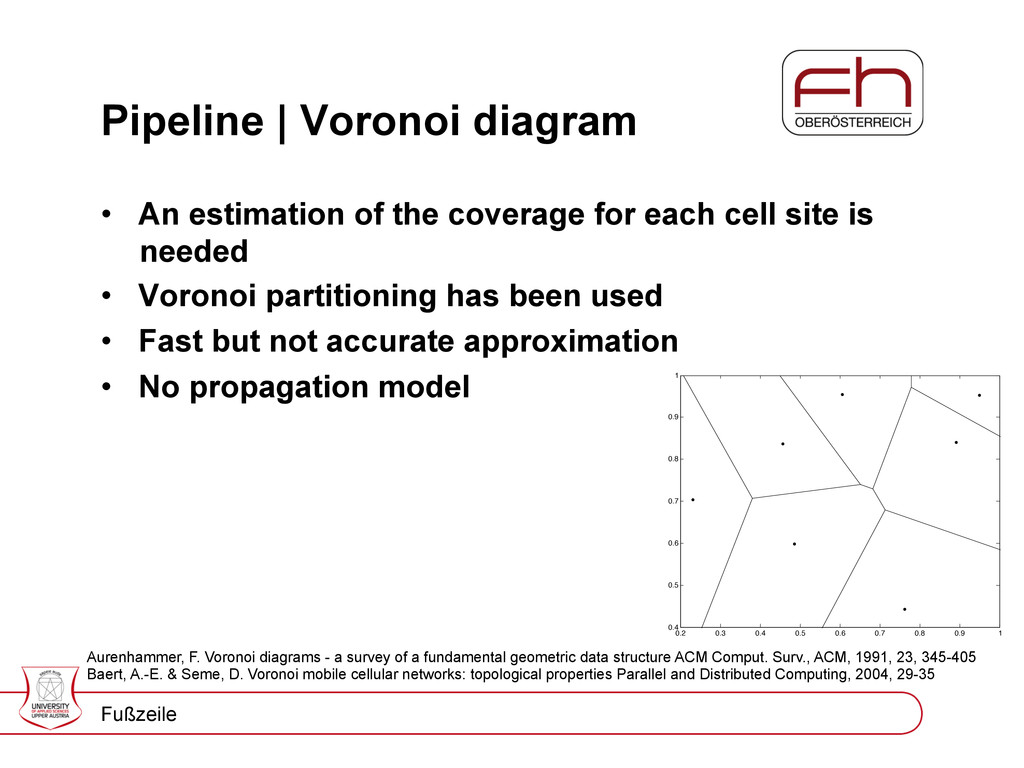
the coverage for each cell site is needed • Voronoi partitioning has been used • Fast but not accurate approximation • No propagation model Fußzeile 0.2 0.3 0.4 0.5 0.6 0.7 0.8 0.9 1 0.4 0.5 0.6 0.7 0.8 0.9 1 Aurenhammer, F. Voronoi diagrams - a survey of a fundamental geometric data structure ACM Comput. Surv., ACM, 1991, 23, 345-405 Baert, A.-E. & Seme, D. Voronoi mobile cellular networks: topological properties Parallel and Distributed Computing, 2004, 29-35
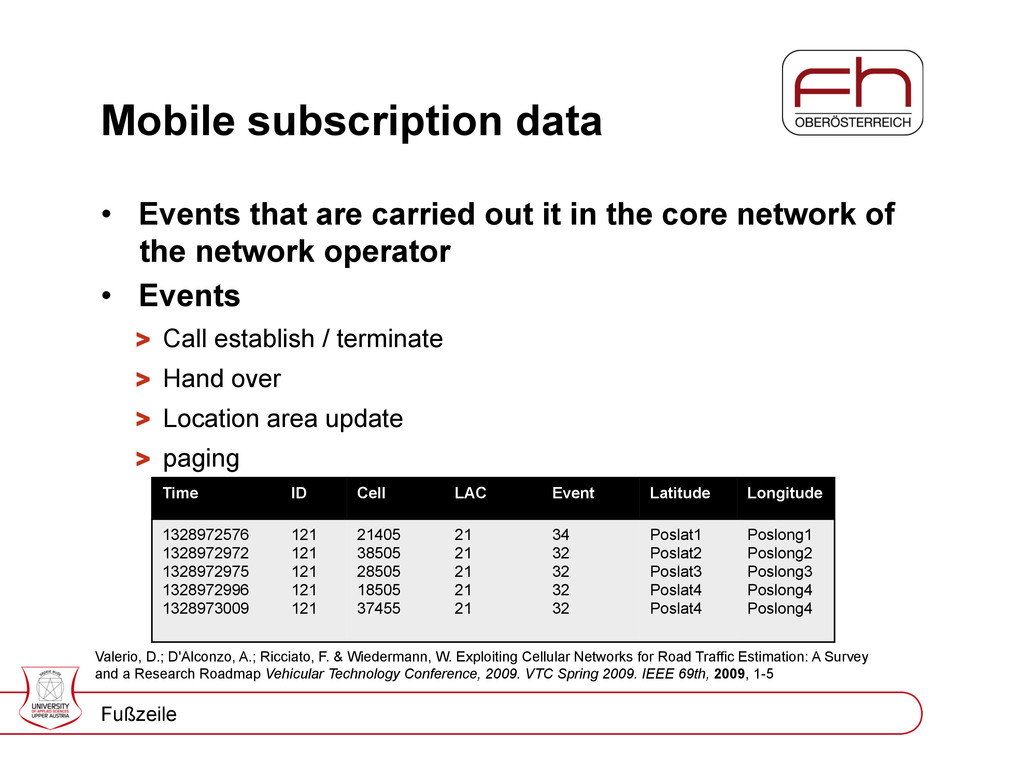
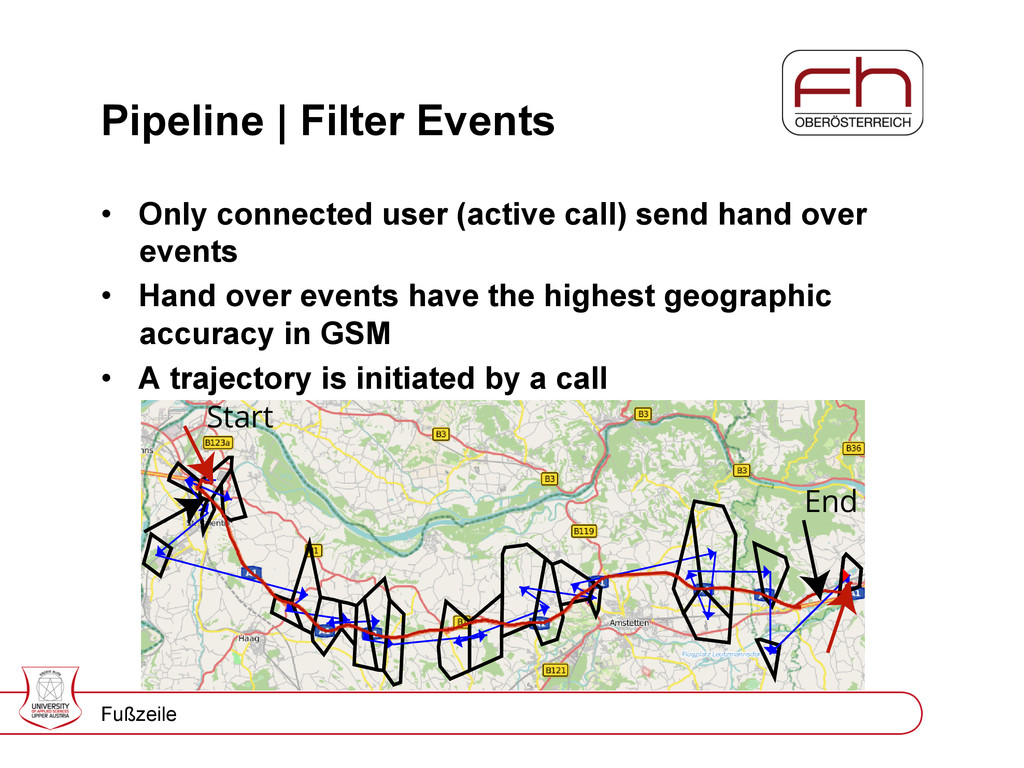
connected user (active call) send hand over events • Hand over events have the highest geographic accuracy in GSM • A trajectory is initiated by a call Fußzeile
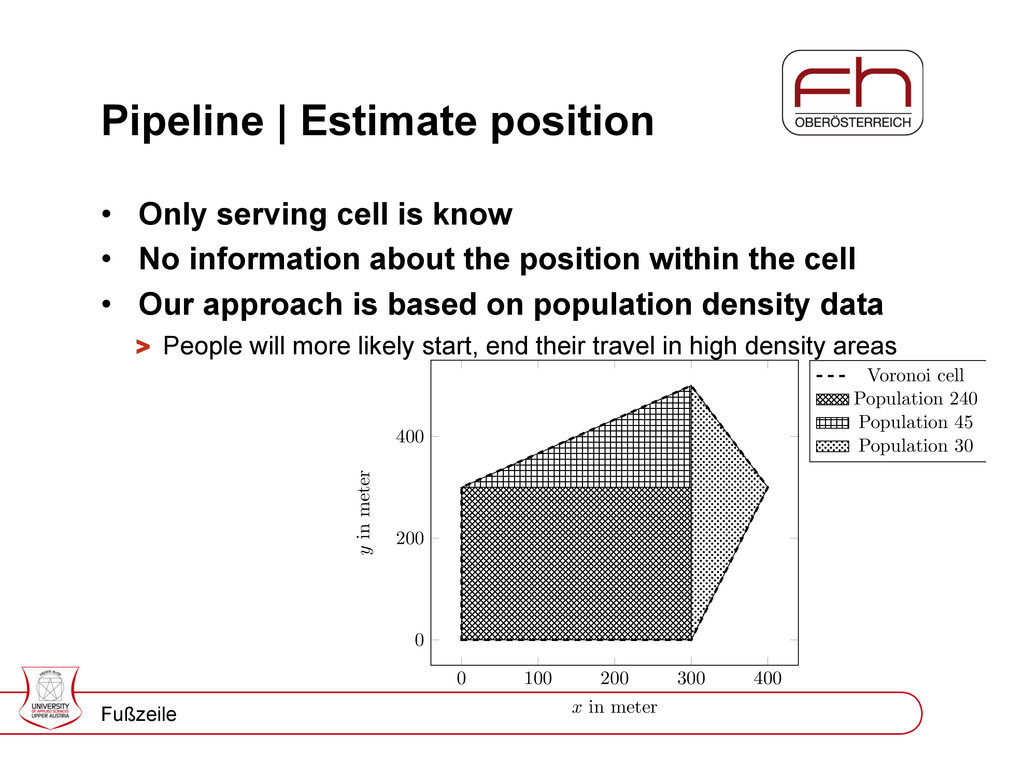
is know • No information about the position within the cell • Our approach is based on population density data " People will more likely start, end their travel in high density areas Fußzeile 0 100 200 300 400 0 200 400 x in meter y in meter Voronoi cell Population 240 Population 45 Population 30
end position • OpenStreetMap road network • Validation " Timing " Euclidean distance " GPS and Hausdorff distance (only fo • Rerouting when validation failed " Different start and end position Fußzeile
timestamp • Timestamp can be used to derive velocity • Hand over points will be annotated with timestamps • Interpolation is done between hand over points • Timing works better for rural than urban areas Fußzeile
rural and urban areas • Trajectories have been validate with GPS tracks • Timing problems were discovered when hand over sequence was week " Voronoi partitioning " Network load Fußzeile
subscribers • They are very precise enough for mobile network simulations • Cover the whole network • Adapt to seasonal changes • Timing information can be added • A better representation of the coverage area is needed Fußzeile


 matthewcrist
 soudai
 kimpetersen
 davidcarrasco
 frankvandijk
 portentint
 cargoodrich
 shlominoach
 chriscoyier
 lfama
 zakiyama
 csswizardry