Upgrade to Pro — share decks privately, control downloads, hide ads and more …

Data Algorithm Visualization: Patterns and Implementations

Data Algorithm Visualization: Patterns and Implementations

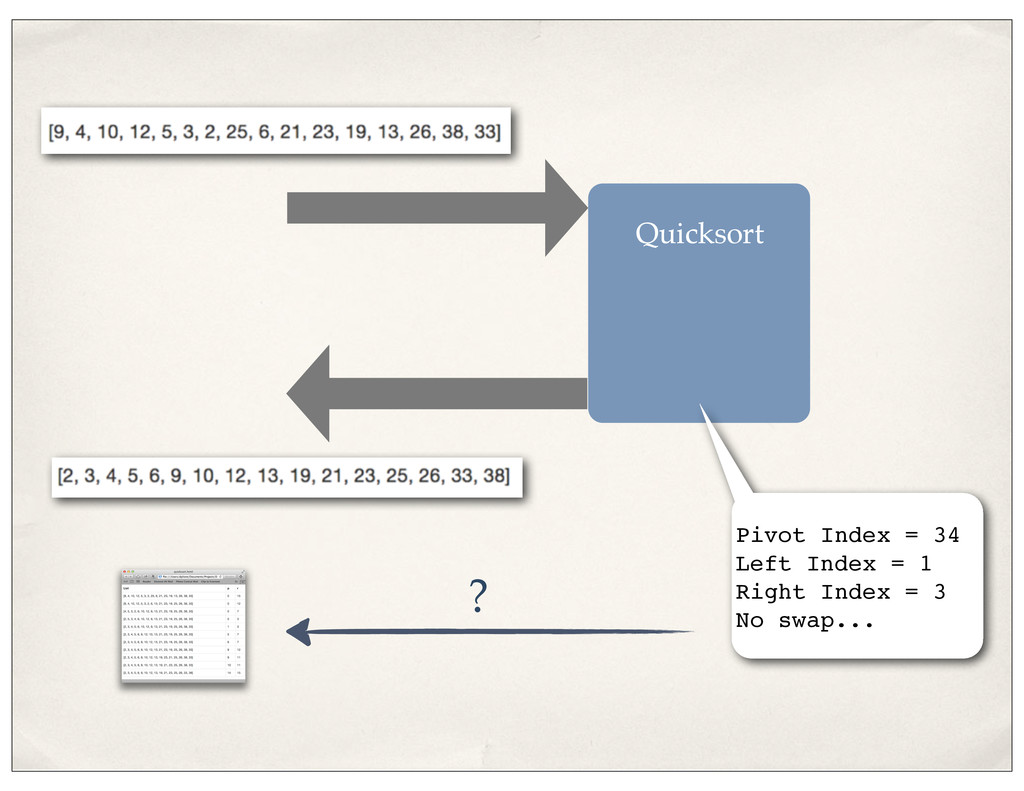
This presentation is part two of a two part discussion of visualizing algorithms and data using web tools. There is usually a lot of interest in using visualizations to help develop and debug after seeing Jason Gilman's talk but concerns over the time investment and complexity of building those visualizations sends developers back to PDD - 'puts' driven development. This presentation approaches the concepts introduced in "Debugging Algorithms With Visualizations" as a skeptic with a day job and real project problems to solve. In this presentation Dan walks through building up an algorithmic visualization using Rails 4's new Live Streaming and HTML5's Server Sent Events (SSE) to stream out-of-band visualization information to a web application for rendering. Along the way, Dan identifies a number of common visualization "problem" patterns and solutions you can apply to get past the initial hurdle of making your data visible. This is a technical presentation and will use a number of visualization techniques including Rails 4, HTML5, CSS, Javascript and ultimately touches on visualization tools including D3.

Dan Pilone

April 09, 2013
Tweet

Other Decks in Programming

Transcript

  1. “Of course maybe some super smart guy will figure out

    the generic solutions for these types of problems. On the other hand, maybe it's really not as easy a problem as it was made to look.” gman - http://www.codinghorror.com/blog/2012/03/visualizing-code-to-fail- faster.html
  2. def  quicksort(list,  p,  r)        if  p  <

     r  then                q  =  partition(list,  p,  r)                quicksort(list,  p,  q-­‐1)                quicksort(list,  q+1,  r)        end end   def  partition(list,  p,  r)        pivot  =  list[r]        i  =  p  -­‐  1        p.upto(r-­‐1)  do  |j|                if  list[j]  <=  pivot                        i  =  i+1                        list[i],  list[j]  =  list[j],list[i]                end                      end        list[i+1],list[r]  =  list[r],list[i+1]        return  i  +  1 end http://opennfo.wordpress.com/2009/02/15/quicksort-in-ruby/
  3. Results...? ✤ Minimal time to implement (< 1hr) ✤ Shows....

    something, but not terribly helpful ✤ Made a mess of the code...
  4. Out-of-band Data ✤ Logs* ✤ Dedicated output files ✤ Simple

    AJAX / Web Service ✤ WebSockets ✤ HTML5 Server Sent Events (SSE)
  5. Basic Visualization Harness ✤ Simple web app (controller) to accept

    input for the algorithm ✤ Simple output from the controller to show the results ✤ Out-of-band support in the browser to render visualization information +
  6. Actually building that harness... ✤ HTML5 Server Sent Events ✤

    Use Rails 4’s live streaming to send SSEs ✤ Native support in HTML5 compliant browsers with minimal JS/CSS to receive events and visualize information
  7. Quicksort ✓ Input / Output Pivot Index = 34 Left

    Index = 1 Right Index = 3 No swap... ✓ Out-of-band
  8. ✤ We want to be able to get at anything

    in the implementation we want ✤ We want it to be maintainable and not significantly impact the implementation ✤ Ideally we want to be able to leave it in there, but disabled, for production release
  9. Quicksort ✓ Input / Output Pivot Index = 34 Left

    Index = 1 Right Index = 3 No swap... ✓ ✓ Out-of-band
  10. Quicksort ✓ Input / Output Pivot Index = 34 Left

    Index = 1 Right Index = 3 No swap... ✓ ✓ Out-of-band
  11. Piety ✤ Simple jQuery Plugin that renders content into drawn

    graphs ✤ Very easy to use ✤ Can support dynamic (animated) data
  12. Google Charts ✤ Well known and reasonably straight-forward to use

    ✤ Several really interesting charts including Geo Charts and Gauges ✤ Wants to be fed via JavaScript. It’s not just a visualization of HTML content.
  13. D3

  14. ✤ Data driven documents ✤ Great support for moving data

    and animation ✤ Core concepts ✤ Node selection ✤ SVG based rendering ✤ Data binding
  15. ✤ Sample Code: http://github.com/dpilone ✤ Rails 4 Streaming: http://tenderlovemaking.com/2012/07/30/is-it-live.html ✤

    Piety: http://benpickles.github.com/peity/ ✤ Google Charts: https://developers.google.com/chart/ ✤ D3: http://d3js.org ✤ D3 Tutorial: http://code.hazzens.com/d3tut/ ✤ NVD3: http://nvd3.org Links and Questions Dan Pilone @danpilone [email protected]