Upgrade to Pro — share decks privately, control downloads, hide ads and more …

Beauty and Personal Care VN market 2024

Beauty and Personal Care VN market 2024

A market research of beauty and personal care in Vietnam market

Transcript

  1. B E A U T Y A N D P

    E R S O N A L C A R E I N V I E T N A M P a s s p o r t i © E u r o m o n i t o r I n t e r n a t i o n a l LIST OF CONTENTS AND TABLES Beauty and Personal Care in Vietnam - Industry Overview .......................................................... 1 EXECUTIVE SUMMARY .............................................................................................................. 1 Beauty and personal care in 2022: The big picture .................................................................. 1 2022 key trends ........................................................................................................................ 1 Competitive landscape ............................................................................................................. 2 Retailing developments ............................................................................................................ 2 What next for beauty and personal care? ................................................................................. 3 MARKET DATA ............................................................................................................................ 3 Table 1 Sales of Beauty and Personal Care by Category: Value 2017-2022 ............ 3 Table 2 Sales of Beauty and Personal Care by Category: % Value Growth 2017-2022 .................................................................................................... 4 Table 3 GBO Company Shares of Beauty and Personal Care: % Value 2018- 2022 ............................................................................................................. 4 Table 4 NBO Company Shares of Beauty and Personal Care: % Value 2018- 2022 ............................................................................................................. 5 Table 5 LBN Brand Shares of Beauty and Personal Care: % Value 2019-2022 ....... 6 Table 6 Distribution of Beauty and Personal Care by Format: % Value 2017- 2022 ............................................................................................................. 7 Table 7 Distribution of Beauty and Personal Care by Format and Category: % Value 2022 ................................................................................................... 8 Table 8 Forecast Sales of Beauty and Personal Care by Category: Value 2022-2027 .................................................................................................. 10 Table 9 Forecast Sales of Beauty and Personal Care by Category: % Value Growth 2022-2027 ..................................................................................... 10 DISCLAIMER ............................................................................................................................. 11 SOURCES .................................................................................................................................. 11 Summary 1 Research Sources ...................................................................................... 11 Baby and Child-specific Products in Vietnam - Category Analysis ............................................. 13 KEY DATA FINDINGS................................................................................................................ 13 2022 DEVELOPMENTS ............................................................................................................. 13 Growth despite fewer children, due to higher spending per child ........................................... 13 Product preferences vary between rural and urban parents ................................................... 13 Global brands dominate baby and child-specific products in Vietnam .................................... 13 PROSPECTS AND OPPORTUNITIES....................................................................................... 14 Rising incomes set to drive solid growth for baby and child-specific products ........................ 14 Continued dominance of global brands expected ................................................................... 14 Specialist retailers expected to remain important ................................................................... 15 CATEGORY DATA ..................................................................................................................... 15 Table 10 Sales of Baby and Child-specific Products by Category: Value 2017- 2022 ........................................................................................................... 15 Table 11 Sales of Baby and Child-specific Products by Category: % Value Growth 2017-2022 ..................................................................................... 15 Table 12 Sales of Baby and Child-specific Products by Premium vs Mass: % Value 2017-2022 ........................................................................................ 16 Table 13 NBO Company Shares of Baby and Child-specific Products: % Value 2018-2022 .................................................................................................. 16
  2. B E A U T Y A N D P

    E R S O N A L C A R E I N V I E T N A M P a s s p o r t ii © E u r o m o n i t o r I n t e r n a t i o n a l Table 14 LBN Brand Shares of Baby and Child-specific Products: % Value 2019-2022 .................................................................................................. 17 Table 15 LBN Brand Shares of Baby and Child-specific Skin Care: % Value 2019-2022 .................................................................................................. 17 Table 16 LBN Brand Shares of Baby and Child-specific Sun Care: % Value 2019-2022 .................................................................................................. 18 Table 17 Forecast Sales of Baby and Child-specific Products by Category: Value 2022-2027 ........................................................................................ 18 Table 18 Forecast Sales of Baby and Child-specific Products by Category: % Value Growth 2022-2027 ........................................................................... 19 Table 19 Forecast Sales of Baby and Child-specific Products by Premium vs Mass: % Value 2022-2027 ......................................................................... 19 Bath and Shower in Vietnam - Category Analysis ...................................................................... 20 KEY DATA FINDINGS................................................................................................................ 20 2022 DEVELOPMENTS ............................................................................................................. 20 Bath and shower records growth as hygiene habits are maintained ....................................... 20 Scent and moisturising are important features in bath and shower products .......................... 20 Global player Unilever continues to lead bath and shower ..................................................... 21 PROSPECTS AND OPPORTUNITIES....................................................................................... 21 Dynamic growth forecast for bath and shower in Vietnam as penetration rises ...................... 21 Green and male-specific products expected to gain popularity .............................................. 22 Offline channels set to remain important as chains expand .................................................... 22 CATEGORY DATA ..................................................................................................................... 22 Table 20 Sales of Bath and Shower by Category: Value 2017-2022 ........................ 22 Table 21 Sales of Bath and Shower by Category: % Value Growth 2017-2022 ........ 22 Table 22 Sales of Bath and Shower by Premium vs Mass: % Value 2017-2022 ...... 23 Table 23 NBO Company Shares of Bath and Shower: % Value 2018-2022 ............. 23 Table 24 LBN Brand Shares of Bath and Shower: % Value 2019-2022 .................... 24 Table 25 LBN Brand Shares of Premium Bath and Shower: % Value 2019- 2022 ........................................................................................................... 25 Table 26 Forecast Sales of Bath and Shower by Category: Value 2022-2027 ......... 25 Table 27 Forecast Sales of Bath and Shower by Category: % Value Growth 2022-2027 .................................................................................................. 25 Table 28 Forecast Sales of Bath and Shower by Premium vs Mass: % Value 2022-2027 .................................................................................................. 26 Colour Cosmetics in Vietnam - Category Analysis ..................................................................... 27 KEY DATA FINDINGS................................................................................................................ 27 2022 DEVELOPMENTS ............................................................................................................. 27 Colour cosmetics returns to growth as mobility returns .......................................................... 27 Diverse colour cosmetics trends ............................................................................................. 27 Global brands still dominate colour cosmetics in Vietnam ...................................................... 27 PROSPECTS AND OPPORTUNITIES....................................................................................... 28 Strong growth expected for colour cosmetics, leading to full recovery ................................... 28 Global brands expected to continue to lead, and premium products will perform well ............ 28 Brands likely to focus more on e-commerce ........................................................................... 28 CATEGORY DATA ..................................................................................................................... 29 Table 29 Sales of Colour Cosmetics by Category: Value 2017-2022 ........................ 29 Table 30 Sales of Colour Cosmetics by Category: % Value Growth 2017-2022 ....... 30
  3. B E A U T Y A N D P

    E R S O N A L C A R E I N V I E T N A M P a s s p o r t iii © E u r o m o n i t o r I n t e r n a t i o n a l Table 31 NBO Company Shares of Colour Cosmetics: % Value 2018-2022 ............ 31 Table 32 LBN Brand Shares of Colour Cosmetics: % Value 2019-2022 ................... 32 Table 33 LBN Brand Shares of Eye Make-up: % Value 2019-2022 .......................... 33 Table 34 LBN Brand Shares of Facial Make-up: % Value 2019-2022 ....................... 34 Table 35 LBN Brand Shares of Lip Products: % Value 2019-2022 ........................... 36 Table 36 LBN Brand Shares of Nail Products: % Value 2019-2022 .......................... 37 Table 37 LBN Brand Shares of Premium Colour Cosmetics: % Value 2019- 2022 ........................................................................................................... 37 Table 38 Forecast Sales of Colour Cosmetics by Category: Value 2022-2027 ......... 38 Table 39 Forecast Sales of Colour Cosmetics by Category: % Value Growth 2022-2027 .................................................................................................. 40 Deodorants in Vietnam - Category Analysis ............................................................................... 42 KEY DATA FINDINGS................................................................................................................ 42 2022 DEVELOPMENTS ............................................................................................................. 42 Stable growth for deodorants recoups most of the previous year’s losses ............................. 42 Consumers look for added features, and increasingly for unscented products ....................... 42 Shopping behaviour affected by social media and marketing activities .................................. 43 PROSPECTS AND OPPORTUNITIES....................................................................................... 43 Healthy growth expected for deodorants in the forecast period .............................................. 43 Packaging changes and different sizes to appeal to consumers ............................................ 43 Modern trade channels expected to remain important ............................................................ 43 CATEGORY DATA ..................................................................................................................... 44 Table 40 Sales of Deodorants by Category: Value 2017-2022 ................................. 44 Table 41 Sales of Deodorants by Category: % Value Growth 2017-2022 ................. 44 Table 42 Sales of Deodorants by Premium vs Mass: % Value 2017-2022 ............... 44 Table 43 NBO Company Shares of Deodorants: % Value 2018-2022 ...................... 44 Table 44 LBN Brand Shares of Deodorants: % Value 2019-2022............................. 45 Table 45 LBN Brand Shares of Premium Deodorants: % Value 2019-2022 ............. 46 Table 46 Forecast Sales of Deodorants by Category: Value 2022-2027 .................. 46 Table 47 Forecast Sales of Deodorants by Category: % Value Growth 2022- 2027 ........................................................................................................... 46 Table 48 Forecast Sales of Deodorants by Premium Vs Mass: % Value 2022- 2027 ........................................................................................................... 47 Depilatories in Vietnam - Category Analysis ............................................................................... 48 KEY DATA FINDINGS................................................................................................................ 48 2022 DEVELOPMENTS ............................................................................................................. 48 Depilatories returns to growth in Vietnam, driven by hair removers/bleaches ........................ 48 Points of differentiation are increasingly seen amongst hair removers/bleaches .................... 48 Global player leads due to strong distribution and A good reputation ..................................... 49 PROSPECTS AND OPPORTUNITIES....................................................................................... 49 Depilatories set to see stable growth in the coming years ...................................................... 49 Consumers expected to demand innovations to improve the hair removal experience .......... 49 E-commerce likely to contribute to growth due to price promotions ........................................ 50 CATEGORY DATA ..................................................................................................................... 50 Table 49 Sales of Depilatories by Category: Value 2017-2022 ................................. 50 Table 50 Sales of Depilatories by Category: % Value Growth 2017-2022 ................ 50 Table 51 Sales of Women's Razors and Blades by Type: % Value Breakdown 2018-2022 .................................................................................................. 50
  4. B E A U T Y A N D P

    E R S O N A L C A R E I N V I E T N A M P a s s p o r t iv © E u r o m o n i t o r I n t e r n a t i o n a l Table 52 NBO Company Shares of Depilatories: % Value 2018-2022 ...................... 51 Table 53 LBN Brand Shares of Depilatories: % Value 2019-2022 ............................ 51 Table 54 Forecast Sales of Depilatories by Category: Value 2022-2027 .................. 52 Table 55 Forecast Sales of Depilatories by Category: % Value Growth 2022- 2027 ........................................................................................................... 52 Fragrances in Vietnam - Category Analysis ............................................................................... 53 KEY DATA FINDINGS................................................................................................................ 53 2022 DEVELOPMENTS ............................................................................................................. 53 Fragrances records A sales rebound in Vietnam as social and work events resume ............. 53 Sustainable offerings in fragrances are exciting younger consumers ..................................... 53 Strong competitive landscape in fragrances in Vietnam ......................................................... 54 PROSPECTS AND OPPORTUNITIES....................................................................................... 54 Rising consumer confidence expected to lead to full recovery for fragrances ........................ 54 Premium fragrances set to drive growth ................................................................................. 54 Despite growth for e-commerce, offline channels will remain important ................................. 55 CATEGORY DATA ..................................................................................................................... 55 Table 56 Sales of Fragrances by Category: Value 2017-2022 .................................. 55 Table 57 Sales of Fragrances by Category: % Value Growth 2017-2022 ................. 55 Table 58 NBO Company Shares of Fragrances: % Value 2018-2022 ...................... 56 Table 59 LBN Brand Shares of Fragrances: % Value 2019-2022 ............................. 56 Table 60 LBN Brand Shares of Premium Men's Fragrances: % Value 2019- 2022 ........................................................................................................... 57 Table 61 LBN Brand Shares of Premium Women's Fragrances: % Value 2019- 2022 ........................................................................................................... 58 Table 62 Forecast Sales of Fragrances by Category: Value 2022-2027 ................... 59 Table 63 Forecast Sales of Fragrances by Category: % Value Growth 2022- 2027 ........................................................................................................... 59 Hair Care in Vietnam - Category Analysis .................................................................................. 61 KEY DATA FINDINGS................................................................................................................ 61 2022 DEVELOPMENTS ............................................................................................................. 61 Hair care maintains fairly stable value sales in 2022 .............................................................. 61 Anti-dandruff is one of the key features when choosing shampoos ........................................ 61 Hair care is led by global brands............................................................................................. 61 PROSPECTS AND OPPORTUNITIES....................................................................................... 62 Stable growth expected for hair care as new variants are launched ....................................... 62 Number of natural products expected to grow, with foaming formulae preferred .................... 62 Offline channel will remain key for basic products, but e-commerce also important ............... 63 CATEGORY DATA ..................................................................................................................... 63 Table 64 Sales of Hair Care by Category: Value 2017-2022 .................................... 63 Table 65 Sales of Hair Care by Category: % Value Growth 2017-2022 .................... 63 Table 66 Sales of Hair Care by Premium vs Mass: % Value 2017-2022 .................. 64 Table 67 NBO Company Shares of Hair Care: % Value 2018-2022 ......................... 64 Table 68 NBO Company Shares of Salon Professional Hair Care: % Value 2018-2022 .................................................................................................. 65 Table 69 LBN Brand Shares of Hair Care: % Value 2019-2022 ................................ 65 Table 70 LBN Brand Shares of Colourants: % Value 2019-2022 .............................. 66 Table 71 LBN Brand Shares of Salon Professional Hair Care: % Value 2019- 2022 ........................................................................................................... 67
  5. B E A U T Y A N D P

    E R S O N A L C A R E I N V I E T N A M P a s s p o r t v © E u r o m o n i t o r I n t e r n a t i o n a l Table 72 LBN Brand Shares of Styling Agents: % Value 2019-2022 ........................ 67 Table 73 LBN Brand Shares of Premium Hair Care: % Value 2019-2022 ................ 68 Table 74 Forecast Sales of Hair Care by Category: Value 2022-2027 ...................... 68 Table 75 Forecast Sales of Hair Care by Category: % Value Growth 2022-2027 ..... 69 Table 76 Forecast Sales of Hair Care by Premium vs Mass: % Value 2022- 2027 ........................................................................................................... 69 Men's Grooming in Vietnam - Category Analysis ....................................................................... 70 KEY DATA FINDINGS................................................................................................................ 70 2022 DEVELOPMENTS ............................................................................................................. 70 Men’s grooming returns to growth in 2022 as restrictions are lifted ........................................ 70 Diversity in brand activities to raise awareness ...................................................................... 70 Men’s demands are similar to those for women ..................................................................... 71 PROSPECTS AND OPPORTUNITIES....................................................................................... 71 Rapid growth projected for men’s grooming in the forecast period ......................................... 71 Increasingly competitive environment as the growth potential is significant ........................... 71 E-commerce will help men’s grooming penetrate rural areas ................................................. 72 CATEGORY DATA ..................................................................................................................... 72 Table 77 Sales of Men’s Grooming by Category: Value 2017-2022 .......................... 72 Table 78 Sales of Men’s Grooming by Category: % Value Growth 2017-2022 ......... 73 Table 79 Sales of Men's Razors and Blades by Type: % Value Breakdown 2019-2022 .................................................................................................. 73 Table 80 Sales of Men's Skin Care by Type: % Value Breakdown 2019-2022 ......... 73 Table 81 NBO Company Shares of Men’s Grooming: % Value 2018-2022 .............. 73 Table 82 LBN Brand Shares of Men’s Grooming: % Value 2019-2022 ..................... 74 Table 83 LBN Brand Shares of Men's Razors and Blades: % Value 2019-2022 ...... 75 Table 84 Forecast Sales of Men’s Grooming by Category: Value 2022-2027 ........... 76 Table 85 Forecast Sales of Men’s Grooming by Category: % Value Growth 2022-2027 .................................................................................................. 76 Oral Care in Vietnam - Category Analysis .................................................................................. 78 KEY DATA FINDINGS................................................................................................................ 78 2022 DEVELOPMENTS ............................................................................................................. 78 Oral care posts stable growth in Vietnam as awareness of oral hygiene rises ....................... 78 Unilever maintains its leading position .................................................................................... 78 Whitening and sensitivity remain key features ........................................................................ 79 PROSPECTS AND OPPORTUNITIES....................................................................................... 79 Oral care expected to continue growing in the coming years ................................................. 79 Whitening likely to remain an important feature ...................................................................... 79 Offline channels will continue to dominate .............................................................................. 79 CATEGORY DATA ..................................................................................................................... 80 Table 86 Sales of Oral Care by Category: Value 2017-2022 .................................... 80 Table 87 Sales of Oral Care by Category: % Value Growth 2017-2022 .................... 80 Table 88 Sales of Toothbrushes by Category: Value 2017-2022 .............................. 80 Table 89 Sales of Toothbrushes by Category: % Value Growth 2017-2022 ............. 81 Table 90 Sales of Toothpaste by Type: % Value Breakdown 2018-2022 ................. 81 Table 91 NBO Company Shares of Oral Care: % Value 2018-2022 ......................... 81 Table 92 LBN Brand Shares of Oral Care: % Value 2019-2022................................ 82 Table 93 LBN Brand Shares of Mouthwashes/Dental Rinses: % Value 2019- 2022 ........................................................................................................... 83
  6. B E A U T Y A N D P

    E R S O N A L C A R E I N V I E T N A M P a s s p o r t vi © E u r o m o n i t o r I n t e r n a t i o n a l Table 94 LBN Brand Shares of Toothpaste: % Value 2019-2022 ............................. 83 Table 95 Forecast Sales of Oral Care by Category: Value 2022-2027 ..................... 84 Table 96 Forecast Sales of Oral Care by Category: % Value Growth 2022-2027 ..... 84 Table 97 Forecast Sales of Toothbrushes by Category: Value 2022-2027 ............... 85 Table 98 Forecast Sales of Toothbrushes by Category: % Value Growth 2022- 2027 ........................................................................................................... 85 Skin Care in Vietnam - Category Analysis .................................................................................. 87 KEY DATA FINDINGS................................................................................................................ 87 2022 DEVELOPMENTS ............................................................................................................. 87 Rising knowledge of skin health drives solid growth in skin care in 2022 ............................... 87 Skinimalism is A key trend ...................................................................................................... 87 Livestreaming and occasion marketing used to attract consumers ........................................ 88 PROSPECTS AND OPPORTUNITIES....................................................................................... 88 Skin care set to register dynamic growth over the forecast period ......................................... 88 Anti-ageing products likely to have opportunities for growth ................................................... 88 Shoppertainment expected to be explored further in the forecast period................................ 89 CATEGORY DATA ..................................................................................................................... 89 Table 99 Sales of Skin Care by Category: Value 2017-2022 .................................... 89 Table 100 Sales of Skin Care by Category: % Value Growth 2017-2022 ................... 90 Table 101 NBO Company Shares of Skin Care: % Value 2018-2022 ......................... 91 Table 102 LBN Brand Shares of Skin Care: % Value 2019-2022 ............................... 92 Table 103 LBN Brand Shares of Basic Moisturisers: % Value 2019-2022 .................. 93 Table 104 LBN Brand Shares of Anti-agers: % Value 2019-2022 ............................... 94 Table 105 LBN Brand Shares of Firming/Anti-cellulite Body Care: % Value 2019- 2022 ........................................................................................................... 95 Table 106 LBN Brand Shares of General Purpose Body Care: % Value 2019- 2022 ........................................................................................................... 96 Table 107 LBN Brand Shares of Premium Skin Care: % Value 2019-2022 ................ 97 Table 108 Forecast Sales of Skin Care by Category: Value 2022-2027 ..................... 97 Table 109 Forecast Sales of Skin Care by Category: % Value Growth 2022-2027..... 99 Sun Care in Vietnam - Category Analysis ................................................................................ 100 KEY DATA FINDINGS.............................................................................................................. 100 2022 DEVELOPMENTS ........................................................................................................... 100 Sun care returns to growth as mobility resumes ................................................................... 100 Global brands dominate sun care in Vietnam ....................................................................... 100 Consumers migrate online due to the wide choice and offers .............................................. 101 PROSPECTS AND OPPORTUNITIES..................................................................................... 101 Sun care set to see dynamic growth due to growth potential in rural areas .......................... 101 Multifunctional products will remain A threat to specialised sun care offerings ..................... 101 Beauty specialists and e-commerce expected to maintain growth ....................................... 102 CATEGORY DATA ................................................................................................................... 102 Table 110 Sales of Sun Care by Category: Value 2017-2022 ................................... 102 Table 111 Sales of Sun Care by Category: % Value Growth 2017-2022 .................. 102 Table 112 NBO Company Shares of Sun Care: % Value 2018-2022 ....................... 103 Table 113 LBN Brand Shares of Sun Care: % Value 2019-2022 .............................. 103 Table 114 LBN Brand Shares of Premium Adult Sun Care: % Value 2019-2022...... 104 Table 115 Forecast Sales of Sun Care by Category: Value 2022-2027 .................... 105 Table 116 Forecast Sales of Sun Care by Category: % Value Growth 2022-2027 ... 105
  7. B E A U T Y A N D P

    E R S O N A L C A R E I N V I E T N A M P a s s p o r t vii © E u r o m o n i t o r I n t e r n a t i o n a l Premium Beauty and Personal Care in Vietnam - Category Analysis ...................................... 107 KEY DATA FINDINGS.............................................................................................................. 107 2022 DEVELOPMENTS ........................................................................................................... 107 Premium beauty and personal care maintains growth as optimism returns .......................... 107 Customer experience is the most important factor................................................................ 107 Offline channels remain important for consumers in the premium segment ......................... 108 PROSPECTS AND OPPORTUNITIES..................................................................................... 108 Continued growth expected in the coming years with normalisation of lifestyles .................. 108 Sustainability likely to be an area for development ............................................................... 108 E-commerce will see further investment by premium brands ............................................... 109 CATEGORY DATA ................................................................................................................... 109 Table 117 Sales of Premium Beauty and Personal Care by Category: Value 2017-2022 ................................................................................................ 109 Table 118 Sales of Premium Beauty and Personal Care by Category: % Value Growth 2017-2022 ................................................................................... 110 Table 119 NBO Company Shares of Premium Beauty and Personal Care: % Value 2018-2022 ...................................................................................... 111 Table 120 LBN Brand Shares of Premium Beauty and Personal Care: % Value 2019-2022 ................................................................................................ 111 Table 121 Forecast Sales of Premium Beauty and Personal Care by Category: Value 2022-2027 ...................................................................................... 113 Table 122 Forecast Sales of Premium Beauty and Personal Care by Category: % Value Growth 2022-2027 ..................................................................... 113 Mass Beauty and Personal Care in Vietnam - Category Analysis ............................................ 115 KEY DATA FINDINGS.............................................................................................................. 115 2022 DEVELOPMENTS ........................................................................................................... 115 Mass beauty and personal care sees solid growth in 2022 .................................................. 115 Global brands continue to lead with dynamic activities ......................................................... 115 Ingredients previously only seen in premium brands now offered by mass brands .............. 116 PROSPECTS AND OPPORTUNITIES..................................................................................... 116 Dynamic growth as spending increases amongst the rural population ................................. 116 Consumers will pay more attention to scents, packaging, formats, and ingredients ............. 116 E-commerce set to remain an important distribution channel ............................................... 117 CATEGORY DATA ................................................................................................................... 117 Table 123 Sales of Mass Beauty and Personal Care by Category: Value 2017- 2022 ......................................................................................................... 117 Table 124 Sales of Mass Beauty and Personal Care by Category: % Value Growth 2017-2022 ................................................................................... 118 Table 125 NBO Company Shares of Mass Beauty and Personal Care: % Value 2018-2022 ................................................................................................ 118 Table 126 LBN Brand Shares of Mass Beauty and Personal Care: % Value 2019-2022 ................................................................................................ 119 Table 127 Forecast Sales of Mass Beauty and Personal Care by Category: Value 2022-2027 ...................................................................................... 120 Table 128 Forecast Sales of Mass Beauty and Personal Care by Category: % Value Growth 2022-2027 ......................................................................... 121
  8. B E A U T Y A N D P

    E R S O N A L C A R E I N V I E T N A M P a s s p o r t 1 © E u r o m o n i t o r I n t e r n a t i o n a l BEAUTY AND PERSONAL CARE IN VIETNAM - INDUSTRY OVERVIEW EXECUTIVE SUMMARY Beauty and personal care in 2022: The big picture Beauty and personal care in Vietnam recorded strong growth in current value terms in 2022, as the easing of the pandemic and the removal of restrictions led consumers to return to in- person work and other activities outside of the home, driving the use of such products. With rising disposable incomes, consumers in Vietnam also had more opportunity to purchase beauty and personal care products in 2022. In this year, for the first time in over 10 years, the country’s GDP reached an 8% growth rate, while inflation was under control, at less than 4%, which gave a boost to consumer confidence. Growth was therefore seen across all beauty and personal care categories in 2022, but as some saw significant declines during COVID-19, not all were able to return to the pre-pandemic level of sales – these included sun care, fragrances, and colour cosmetics. Improving purchasing power also impacted how consumers chose beauty and personal care products for daily use. For instance, more sophisticated demand in terms of product origin and ingredient information was seen across all categories. This also led consumers to prioritise trusted retailers from which to purchase products. However, the minimalist trend made Vietnamese consumers more mindful of their purchases, having an impact in terms of consumers’ expectations of the efficacy of the beauty and personal care products they did purchase. For example, some younger consumers simplified their skin care routine, but demanded effective cleanser, moisturiser, and sun care, and tended to be loyal to a brand if they found it was suitable for them. 2022 key trends Dermocosmetics, which contain active ingredients, and are considered by consumers to restore skin health and treat specific skin issues, have remained popular over the years in Vietnam. These products are particularly popular in skin care, with consumers normally using moisturiser and serum due to the benefits of the ingredients on their body and the environment. Meanwhile, AHA, BHA, and retinols are gradually becoming popular keywords and being applied within beauty and personal care products. Female consumers often prefer combination colour cosmetics, sun care and skin care products. For example, when they are going out to work or socialising, many prefer to choose sun care products with brightening feature, or tinted sun care products that offer light coverage. Meanwhile, men’s skin care maintained current value growth in both the mass and premium segments in 2022, with whitening and moisturising amongst the best-selling features. When it comes to products for women, a wide variety of products is available, and new scents are being released all the time to attract consumers. For instance, bath and shower products are now available from Korea and Singapore that claim to offer a “perfume shower”, with the fragrance claimed to last for between three and eight hours. However, the variety of scents available in men’s personal care products is quite limited, with similar scents used across multiple products. As some men do not want to use the same scent as numerous others, this is leading more of them to choose unisex scents, or unscented products.
  9. B E A U T Y A N D P

    E R S O N A L C A R E I N V I E T N A M P a s s p o r t 2 © E u r o m o n i t o r I n t e r n a t i o n a l Competitive landscape Beauty and personal care in Vietnam continued to be led by Unilever Vietnam International Co Ltd in value terms in 2022. Other global players followed, including L'Oréal Vietnam Co Ltd, Shiseido Cosmetics Vietnam Co Ltd, and Procter & Gamble Vietnam Ltd. Unilever enjoys a sizeable share of sales, and was the only player to hold a double-digit value share in 2022, supported by a wide portfolio of brands across various beauty and personal care categories, including P/S, Lifebuoy, Clear, Sunsilk and Pond’s. Lifebuoy continued to lead the bath and shower category in Vietnam, and is gradually becoming top-of-mind thanks to various marketing activities with added social messaging, such as the “Loc Suc Khoe” campaign during Lunar New Year 2023 across all provinces. There is strong competition amongst global brands in beauty and personal care in Vietnam in terms of product variants, and also in terms of marketing activities, which require both a functional and emotional connection with consumers. Taking the brand Dove from Unilever as an example, its marketing campaign encourages women in any age group to be confident with their appearance and take care of their inner beauty. While the majority of beauty and personal care categories are dominated by global players, local companies are gradually establishing their own positioning, targeting pricing, niche consumer groups and natural ingredients. Local brands are also making efforts in terms of prioritising marketing using social influencers. For example, CO MEM Natural Cosmetics Jsc applies modern science to produce brands containing traditional herbal ingredients, with its products claiming to be 100% non-toxic, safe, and environmentally-friendly. Therefore, the company is tapping into the “green” consumer group. Meanwhile, M.O.I Cosmetic Company Limited was the first local player in professional colour cosmetics in Vietnam, with international quality standards and reasonable prices; the brand focuses on lipstick and skin care products. Local brands are expected to continue to focus on establishing stable growth amongst their target consumer groups, and will try to expand their distribution networks and focus on frequent product improvements. Retailing developments While in some categories, such as bath and shower, and oral care, modern offline channels remain important, the product variety and convenience offered by e-commerce sites such as Lazada, Shopee, and Tiki is attracting consumers, which drove growth in e-commerce in 2022. Shopping entertainment and livestreaming have grown rapidly in recent years, attracting consumers across the board, boosted by frequent activities from global brands. For instance, the L'Oréal Paris Official Store livestreams on e-commerce sites such as Lazada and Shopee from 12:00-13:00hrs daily, hosted by beauty influencers, targeted towards office workers, giving them entertaining shopping content during their lunch break. Short video reviews of products, or adding shopping links into TikTok videos has also been seen widely, especially for teenagers, with the hashtag #tiktokmademebuyit. The use of social networks such as Facebook and TikTok has also emerged as a key marketing tool for companies looking to reach and engage with consumers. The effective use of social media platforms to communicate with consumers and, increasingly, sell products, was imbued with renewed currency in light of the pandemic. Meanwhile, the development of beauty specialists such as Watsons and Guardian, or new players, including Pharmacity and Matsumoto, both online and in stores, has increased the reach of imported products to the middle-classes, as well as wider regions in Vietnam. Beauty specialists therefore remained a strong distribution channel in 2022, supported by the entry of Sociolla and Sephora, amongst others, and an increasingly knowledgeable and sophisticated consumer base.
  10. B E A U T Y A N D P

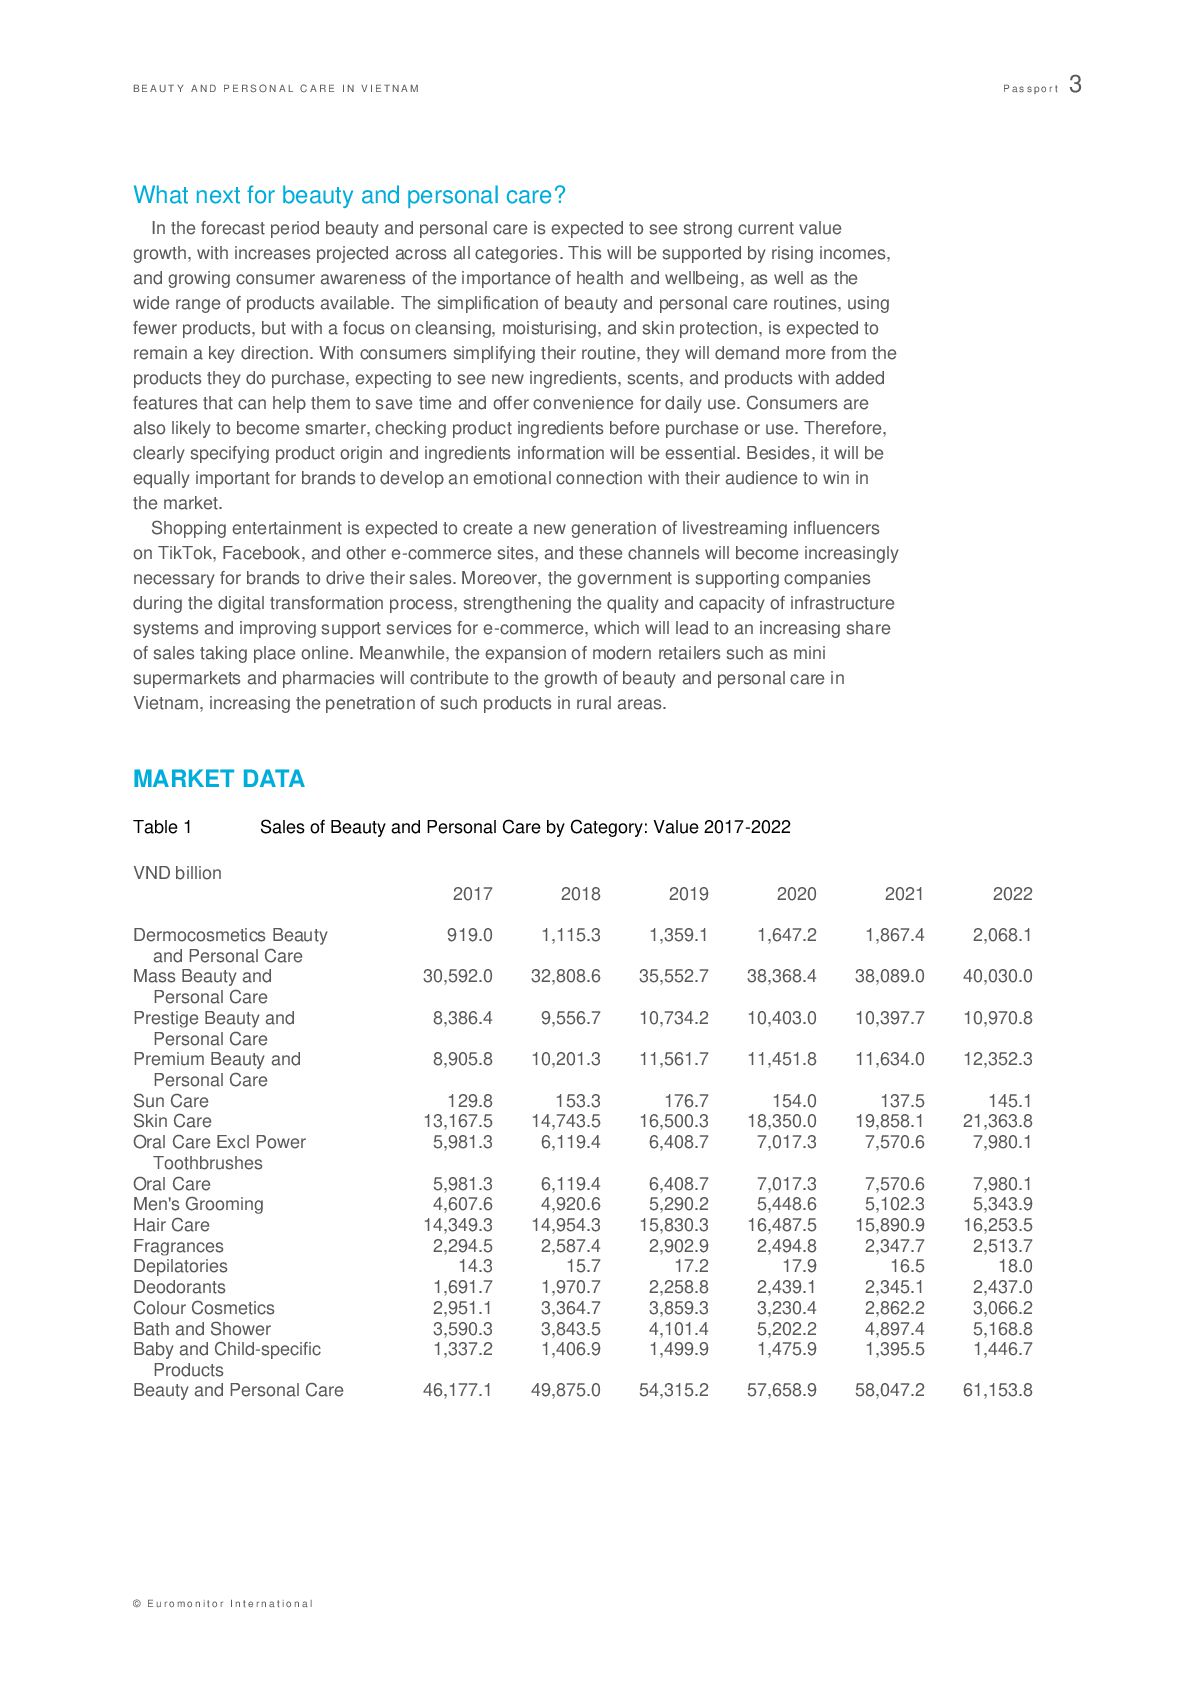
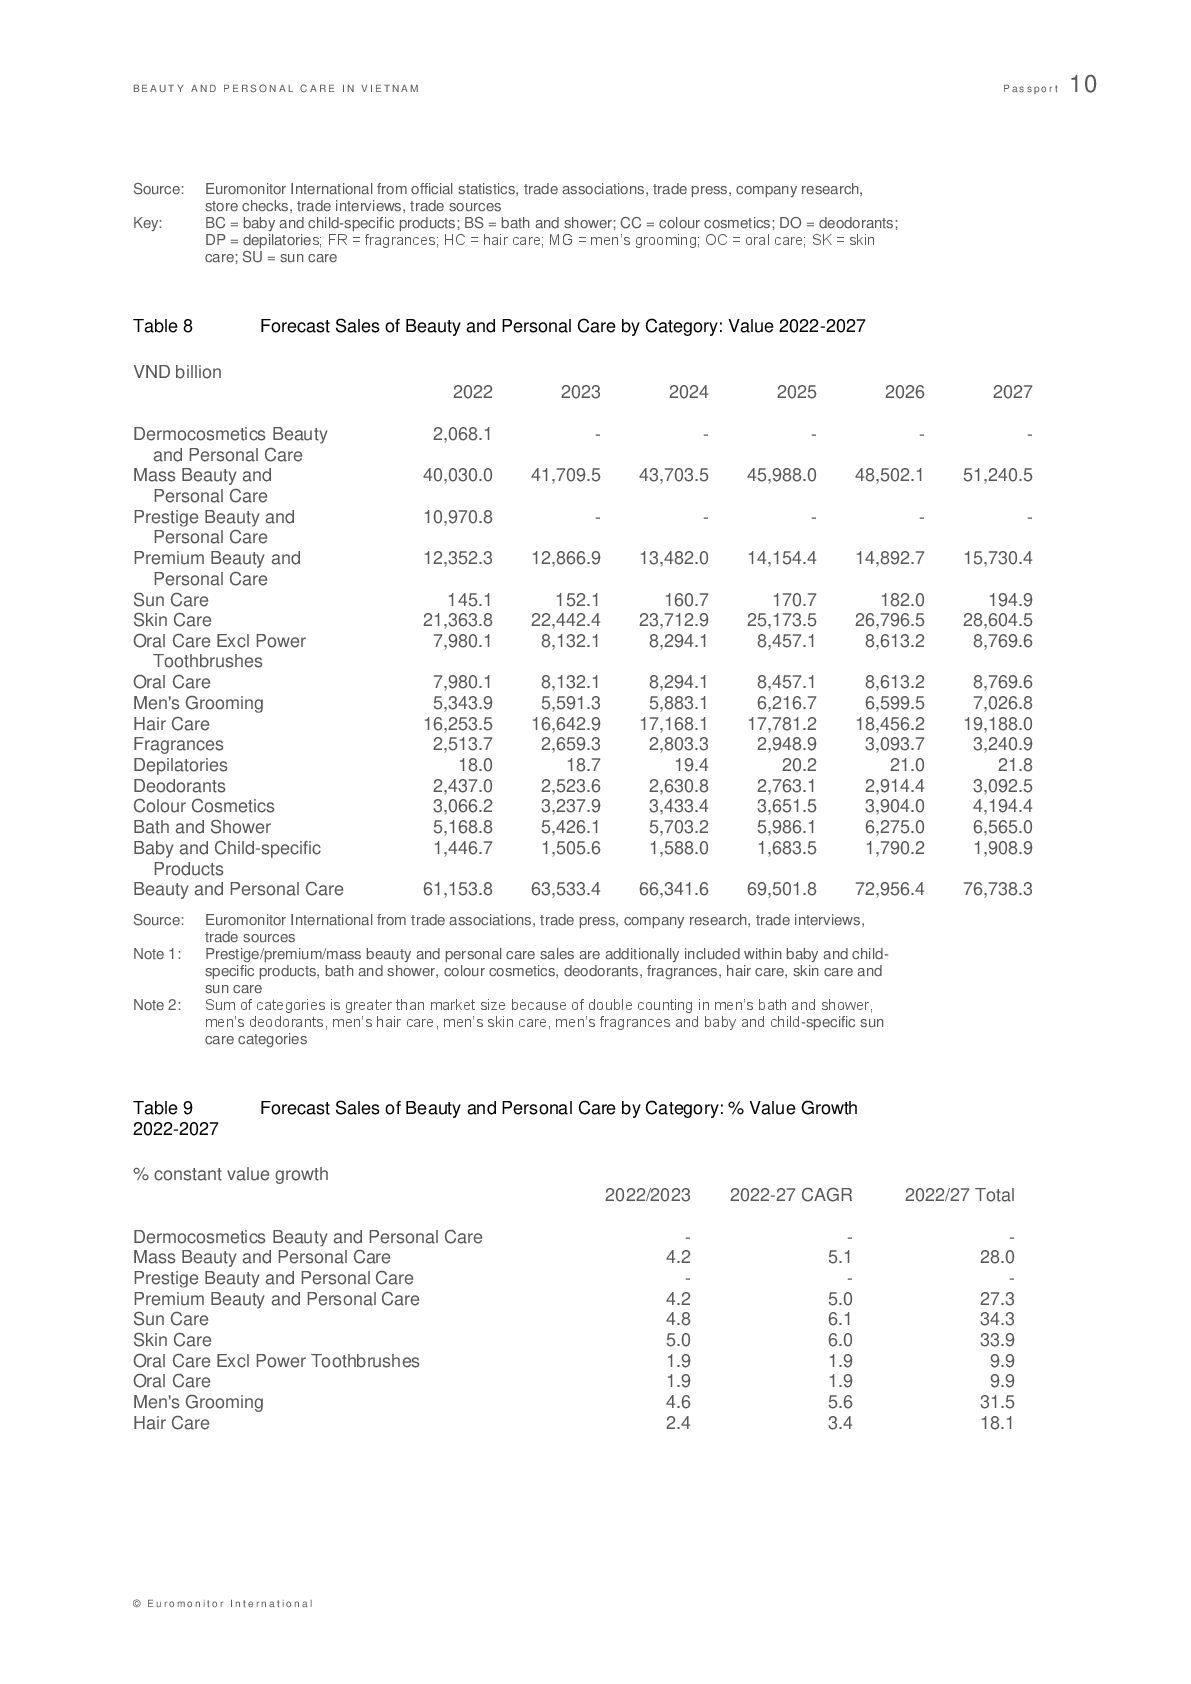
    E R S O N A L C A R E I N V I E T N A M P a s s p o r t 3 © E u r o m o n i t o r I n t e r n a t i o n a l What next for beauty and personal care? In the forecast period beauty and personal care is expected to see strong current value growth, with increases projected across all categories. This will be supported by rising incomes, and growing consumer awareness of the importance of health and wellbeing, as well as the wide range of products available. The simplification of beauty and personal care routines, using fewer products, but with a focus on cleansing, moisturising, and skin protection, is expected to remain a key direction. With consumers simplifying their routine, they will demand more from the products they do purchase, expecting to see new ingredients, scents, and products with added features that can help them to save time and offer convenience for daily use. Consumers are also likely to become smarter, checking product ingredients before purchase or use. Therefore, clearly specifying product origin and ingredients information will be essential. Besides, it will be equally important for brands to develop an emotional connection with their audience to win in the market. Shopping entertainment is expected to create a new generation of livestreaming influencers on TikTok, Facebook, and other e-commerce sites, and these channels will become increasingly necessary for brands to drive their sales. Moreover, the government is supporting companies during the digital transformation process, strengthening the quality and capacity of infrastructure systems and improving support services for e-commerce, which will lead to an increasing share of sales taking place online. Meanwhile, the expansion of modern retailers such as mini supermarkets and pharmacies will contribute to the growth of beauty and personal care in Vietnam, increasing the penetration of such products in rural areas. MARKET DATA Table 1 Sales of Beauty and Personal Care by Category: Value 2017-2022 VND billion 2017 2018 2019 2020 2021 2022 Dermocosmetics Beauty 919.0 1,115.3 1,359.1 1,647.2 1,867.4 2,068.1 and Personal Care Mass Beauty and 30,592.0 32,808.6 35,552.7 38,368.4 38,089.0 40,030.0 Personal Care Prestige Beauty and 8,386.4 9,556.7 10,734.2 10,403.0 10,397.7 10,970.8 Personal Care Premium Beauty and 8,905.8 10,201.3 11,561.7 11,451.8 11,634.0 12,352.3 Personal Care Sun Care 129.8 153.3 176.7 154.0 137.5 145.1 Skin Care 13,167.5 14,743.5 16,500.3 18,350.0 19,858.1 21,363.8 Oral Care Excl Power 5,981.3 6,119.4 6,408.7 7,017.3 7,570.6 7,980.1 Toothbrushes Oral Care 5,981.3 6,119.4 6,408.7 7,017.3 7,570.6 7,980.1 Men's Grooming 4,607.6 4,920.6 5,290.2 5,448.6 5,102.3 5,343.9 Hair Care 14,349.3 14,954.3 15,830.3 16,487.5 15,890.9 16,253.5 Fragrances 2,294.5 2,587.4 2,902.9 2,494.8 2,347.7 2,513.7 Depilatories 14.3 15.7 17.2 17.9 16.5 18.0 Deodorants 1,691.7 1,970.7 2,258.8 2,439.1 2,345.1 2,437.0 Colour Cosmetics 2,951.1 3,364.7 3,859.3 3,230.4 2,862.2 3,066.2 Bath and Shower 3,590.3 3,843.5 4,101.4 5,202.2 4,897.4 5,168.8 Baby and Child-specific 1,337.2 1,406.9 1,499.9 1,475.9 1,395.5 1,446.7 Products Beauty and Personal Care 46,177.1 49,875.0 54,315.2 57,658.9 58,047.2 61,153.8
  11. B E A U T Y A N D P

    E R S O N A L C A R E I N V I E T N A M P a s s p o r t 4 © E u r o m o n i t o r I n t e r n a t i o n a l Source: Euromonitor International from official statistics, trade associations, trade press, company research, store checks, trade interviews, trade sources Note 1: Prestige/premium/mass beauty and personal care sales are additionally included within baby and child- specific products, bath and shower, colour cosmetics, deodorants, fragrances, hair care, skin care and sun care Note 2: Sum of categories is greater than market size because of double counting in men’s bath and shower, men’s deodorants, men’s hair care, men’s skin care, men’s fragrances, and baby and child-specific sun care categories Table 2 Sales of Beauty and Personal Care by Category: % Value Growth 2017-2022 % current value growth 2021/22 2017-22 CAGR 2017/22 Total Dermocosmetics Beauty and Personal Care 10.7 17.6 125.0 Mass Beauty and Personal Care 5.1 5.5 30.9 Prestige Beauty and Personal Care 5.5 5.5 30.8 Premium Beauty and Personal Care 6.2 6.8 38.7 Sun Care 5.5 2.3 11.8 Skin Care 7.6 10.2 62.2 Oral Care Excl Power Toothbrushes 5.4 5.9 33.4 Oral Care 5.4 5.9 33.4 Men's Grooming 4.7 3.0 16.0 Hair Care 2.3 2.5 13.3 Fragrances 7.1 1.8 9.6 Depilatories 9.1 4.7 26.0 Deodorants 3.9 7.6 44.1 Colour Cosmetics 7.1 0.8 3.9 Bath and Shower 5.5 7.6 44.0 Baby and Child-specific Products 3.7 1.6 8.2 Beauty and Personal Care 5.4 5.8 32.4 Source: Euromonitor International from official statistics, trade associations, trade press, company research, store checks, trade interviews, trade sources Note 1: Prestige/premium/mass beauty and personal care sales are additionally included within baby and child- specific products, bath and shower, colour cosmetics, deodorants, fragrances, hair care, skin care and sun care Note 2: Sum of categories is greater than market size because of double counting in men’s bath and shower, men’s deodorants, men’s hair care, men’s skin care, men’s fragrances, and baby and child-specific sun care categories Table 3 GBO Company Shares of Beauty and Personal Care: % Value 2018-2022 % retail value rsp Company 2018 2019 2020 2021 2022 Unilever Group 22.5 21.4 22.2 22.2 21.8 Procter & Gamble Co, The 6.4 6.1 6.0 5.9 5.9 L'Oréal Groupe 4.3 4.7 4.8 5.0 5.3 Shiseido Co Ltd 4.9 4.9 4.6 4.5 4.4 Wipro Ltd 3.0 3.1 3.2 3.2 3.1 Colgate-Palmolive Co 2.7 2.6 2.7 2.9 3.0 Beiersdorf AG 2.8 2.9 2.9 2.9 2.9 LG Household & Health 3.0 3.0 2.7 2.7 2.8 Care Ltd Marico Ltd 2.1 2.0 2.1 1.9 1.8 AmorePacific Corp 1.2 1.3 1.5 1.7 1.8 Estée Lauder Cos Inc 2.3 2.4 2.0 1.9 1.6 Coty Inc 1.1 1.2 0.9 0.8 0.8 Haleon plc - - - - 0.8 Rohto Pharmaceutical Co Ltd 0.7 0.7 0.7 0.7 0.7
  12. B E A U T Y A N D P

    E R S O N A L C A R E I N V I E T N A M P a s s p o r t 5 © E u r o m o n i t o r I n t e r n a t i o n a l Amway Corp 0.7 0.7 0.6 0.7 0.7 Inter Parfums Inc 0.3 0.3 0.2 0.4 0.6 Sao Thai Duong Cosmetics 0.7 0.7 0.7 0.6 0.6 JSC Johnson & Johnson Inc 0.6 0.5 0.5 0.5 0.5 Hoa Linh Pharma Co Ltd 0.5 0.5 0.5 0.5 0.5 Chanel SA 0.5 0.6 0.4 0.4 0.4 Revlon Inc 0.6 0.5 0.5 0.4 0.4 Oriflame Cosmetics SA 1.2 1.2 0.7 0.4 0.4 Nippon Menard Cosmetic Co 0.4 0.4 0.4 0.4 0.4 Ltd Kao Corp 0.5 0.4 0.4 0.4 0.4 Dai Viet Huong Trading 0.5 0.4 0.4 0.4 0.4 Manufacturing Co Ltd Saigon Cosmetics Corp 0.5 0.5 0.4 0.4 0.4 Pierre Fabre SA, 0.2 0.2 0.3 0.3 0.4 Laboratoires Galderma SA - 0.4 0.3 0.4 0.4 LVMH Moët Hennessy Louis 0.4 0.4 0.3 0.3 0.3 Vuitton SA Sanofi 0.3 0.3 0.3 0.3 0.3 Others 35.0 35.4 36.5 37.2 36.3 Total 100.0 100.0 100.0 100.0 100.0 Source: Euromonitor International from official statistics, trade associations, trade press, company research, store checks, trade interviews, trade sources Table 4 NBO Company Shares of Beauty and Personal Care: % Value 2018-2022 % retail value rsp Company 2018 2019 2020 2021 2022 Unilever Vietnam 22.2 21.1 22.0 21.5 21.2 International Co Ltd L'Oréal Vietnam Co Ltd 4.3 4.6 4.7 4.9 5.2 Shiseido Cosmetics 5.1 5.1 4.8 4.6 4.6 Vietnam Co Ltd Procter & Gamble Vietnam 4.1 3.8 3.7 3.5 3.5 Ltd Unza Vietnam Co Ltd 3.0 3.1 3.2 3.2 3.1 Colgate-Palmolive 2.7 2.6 2.7 2.9 3.0 (Vietnam) Co Ltd Beiersdorf Vietnam Ltd Co 2.8 2.9 2.9 2.9 2.9 LG Vina Cosmetics Co Ltd 3.0 3.0 2.7 2.7 2.8 Oral-B (Vietnam) Ltd 2.3 2.3 2.3 2.4 2.4 International Consumer 2.1 2.0 2.1 1.9 1.8 Products Co Ltd AmorePacific Vietnam JSC 1.2 1.3 1.5 1.7 1.8 Estée Lauder Vietnam Co Ltd 2.3 2.4 2.0 1.9 1.6 Coty Beauty Vietnam Co Ltd 0.9 1.0 0.8 0.7 0.8 Rohto-Mentholatum Vietnam 0.7 0.7 0.7 0.7 0.7 Co Ltd GlaxoSmithKline Plc 0.5 0.6 0.6 0.7 0.7 Amway Vietnam Co Ltd 0.7 0.7 0.6 0.7 0.7 Sao Thai Duong Cosmetics 0.7 0.7 0.7 0.6 0.6 JSC Johnson & Johnson Vietnam 0.6 0.5 0.5 0.5 0.5 Co Ltd Hoa Linh Pharma Co Ltd 0.5 0.5 0.5 0.5 0.5 Chanel SA 0.5 0.6 0.4 0.4 0.4
  13. B E A U T Y A N D P

    E R S O N A L C A R E I N V I E T N A M P a s s p o r t 6 © E u r o m o n i t o r I n t e r n a t i o n a l Hanoi International 0.2 0.3 0.3 0.4 0.4 Friendship Hospital JSC Oriflame Vietnam Ltd - - 0.7 0.4 0.4 Nippon Menard Cosmetic Co 0.4 0.4 0.4 0.4 0.4 Ltd Dai Viet Huong Trading 0.5 0.4 0.4 0.4 0.4 Manufacturing Co Ltd Saigon Cosmetics Corp 0.5 0.5 0.4 0.4 0.4 Inter Parfums Asia 0.3 0.3 0.2 0.4 0.4 Pacific Pte Ltd Pierre Fabre SA, 0.2 0.2 0.3 0.3 0.4 Laboratoires Nestlé SA 0.3 0.3 0.3 0.4 0.3 Sanofi-Aventis Vietnam Co 0.3 0.3 0.3 0.3 0.3 Ltd Revlon Inc 0.4 0.4 0.3 0.3 0.3 Thuong Xuan Cosmetic Co Ltd 1.2 1.2 - - - Others 35.4 36.0 36.7 37.5 37.6 Total 100.0 100.0 100.0 100.0 100.0 Source: Euromonitor International from official statistics, trade associations, trade press, company research, store checks, trade interviews, trade sources Table 5 LBN Brand Shares of Beauty and Personal Care: % Value 2019-2022 % retail value rsp Brand (GBO) Company (NBO) 2019 2020 2021 2022 Shiseido (Shiseido Co Shiseido Cosmetics 4.3 4.1 4.1 4.0 Ltd) Vietnam Co Ltd P/S (Unilever Group) Unilever Vietnam 3.5 3.6 3.9 3.8 International Co Ltd Lifebuoy (Unilever Unilever Vietnam 2.6 3.5 3.1 3.0 Group) International Co Ltd Clear (Unilever Group) Unilever Vietnam 3.3 3.3 3.1 3.0 International Co Ltd Sunsilk (Unilever Unilever Vietnam 2.8 2.7 2.5 2.5 Group) International Co Ltd Colgate (Colgate- Colgate-Palmolive 2.2 2.3 2.4 2.5 Palmolive Co) (Vietnam) Co Ltd Pond's (Unilever Group) Unilever Vietnam 2.2 2.2 2.4 2.4 International Co Ltd Dove (Unilever Group) Unilever Vietnam 2.5 2.4 2.2 2.2 International Co Ltd X-Men (Marico Ltd) International Consumer 2.0 2.1 1.9 1.8 Products Co Ltd Closeup (Unilever Unilever Vietnam 1.4 1.5 1.7 1.7 Group) International Co Ltd Oral-B (Procter & Oral-B (Vietnam) Ltd 1.5 1.5 1.6 1.6 Gamble Co, The) Nivea (Beiersdorf AG) Beiersdorf Vietnam Ltd Co 1.6 1.6 1.6 1.5 Enchanteur (Wipro Ltd) Unza Vietnam Co Ltd 1.4 1.5 1.5 1.5 Romano (Wipro Ltd) Unza Vietnam Co Ltd 1.5 1.5 1.5 1.4 The Face Shop (LG LG Vina Cosmetics Co Ltd 1.3 1.3 1.3 1.4 Household & Health Care Ltd) Lancôme (L'Oréal L'Oréal Vietnam Co Ltd 1.2 1.2 1.2 1.2 Groupe) Head & Shoulders Procter & Gamble Vietnam 1.2 1.1 1.0 1.1 (Procter & Gamble Co, Ltd
  14. B E A U T Y A N D P

    E R S O N A L C A R E I N V I E T N A M P a s s p o r t 7 © E u r o m o n i t o r I n t e r n a t i o n a l The) Pantene (Procter & Procter & Gamble Vietnam 1.2 1.2 1.1 1.0 Gamble Co, The) Ltd Vichy (L'Oréal Groupe) L'Oréal Vietnam Co Ltd 0.6 0.8 0.9 1.0 Clear Men (Unilever Unilever Vietnam 1.1 1.0 0.9 0.9 Group) International Co Ltd Rejoice (Procter & Procter & Gamble Vietnam 1.0 0.9 0.9 0.9 Gamble Co, The) Ltd Nivea Men Deodorant Beiersdorf Vietnam Ltd Co 0.8 0.8 0.8 0.7 (Beiersdorf AG) Innisfree AmorePacific Vietnam JSC 0.5 0.6 0.6 0.7 (AmorePacific Corp) La Roche-Posay L'Oréal Vietnam Co Ltd 0.4 0.5 0.6 0.7 (L'Oréal Groupe) Estée Lauder (Estée Estée Lauder Vietnam Co Ltd 0.7 0.7 0.6 0.6 Lauder Cos Inc) Gillette (Procter & Oral-B (Vietnam) Ltd 0.7 0.7 0.6 0.6 Gamble Co, The) Thai Duong Sao Thai Duong Cosmetics JSC 0.7 0.7 0.6 0.6 Maybelline New York L'Oréal Vietnam Co Ltd 0.7 0.5 0.5 0.6 (L'Oréal Groupe) Laneíge (AmorePacific AmorePacific Vietnam JSC 0.4 0.5 0.5 0.6 Corp) L'Oréal Professionnel L'Oréal Vietnam Co Ltd 0.6 0.6 0.6 0.6 (L'Oréal Groupe) Oriflame (Oriflame Thuong Xuan Cosmetic Co Ltd 1.2 - - - Cosmetics SA) Others Others 53.3 53.4 53.7 53.8 Total Total 100.0 100.0 100.0 100.0 Source: Euromonitor International from official statistics, trade associations, trade press, company research, store checks, trade interviews, trade sources Table 6 Distribution of Beauty and Personal Care by Format: % Value 2017-2022 % retail value rsp 2017 2018 2019 2020 2021 2022 Retail Channels 100.0 100.0 100.0 100.0 100.0 100.0 - Retail Offline 94.3 93.7 93.3 91.8 89.0 87.5 -- Grocery Retailers 53.1 50.7 49.6 49.4 49.2 46.9 --- Convenience Retail 1.7 1.7 1.7 1.7 1.6 1.7 ---- Convenience Stores 1.7 1.7 1.7 1.7 1.6 1.7 ---- Forecourt Retailers - - - - - - --- Supermarkets 20.3 19.8 19.6 20.0 18.6 19.0 --- Hypermarkets 12.9 12.6 12.2 11.8 11.3 10.9 --- Discounters - - - - - - --- Warehouse Clubs - - - - - - --- Food/drink/tobacco - - - - - - specialists --- Small Local Grocers 18.3 16.7 16.1 15.9 17.7 15.3 -- Non-Grocery Retailers 37.6 39.2 39.8 38.7 36.3 37.2 --- General Merchandise 13.8 14.4 13.9 13.7 12.3 12.4 Stores ---- Department Stores 13.8 14.4 13.9 13.7 12.3 12.4 ---- Variety Stores - - - - - - --- Apparel and - - - - - - Footwear Specialists --- Appliances and - - - - - - Electronics Specialists
  15. B E A U T Y A N D P

    E R S O N A L C A R E I N V I E T N A M P a s s p o r t 8 © E u r o m o n i t o r I n t e r n a t i o n a l --- Home Products - - - - - - Specialists --- Health and Beauty 23.2 24.2 25.3 24.4 23.3 24.2 Specialists ---- Beauty Specialists 19.5 20.4 21.4 20.7 19.6 20.4 ---- Pharmacies 2.1 2.2 2.2 2.2 2.2 2.3 ---- Optical Goods Stores - - - - - - ---- Health and 1.5 1.6 1.6 1.6 1.5 1.6 Personal Care Stores --- Leisure and - - - - - - Personal Goods Specialists --- Other Non-Grocery 0.7 0.7 0.7 0.6 0.6 0.6 Retailers -- Vending - - - - - - -- Direct Selling 3.6 3.8 3.9 3.6 3.6 3.4 - Retail E-Commerce 5.6 6.2 6.7 8.2 10.9 12.5 Non-retail channels 0.0 0.0 0.0 0.0 0.0 0.0 - Hair Salons 0.0 0.0 0.0 0.0 0.0 0.0 Total 100.0 100.0 100.0 100.0 100.0 100.0 Source: Euromonitor International from official statistics, trade associations, trade press, company research, store checks, trade interviews, trade sources Table 7 Distribution of Beauty and Personal Care by Format and Category: % Value 2022 % retail value rsp Baby and Bath and Colour Deodorants Depilatori Fragrances Child- Shower Cosmetics es specific Products Retail Channels 100.0 100.0 100.0 100.0 100.0 100.0 - Retail Offline 95.1 84.8 86.7 79.9 93.2 84.6 -- Grocery Retailers 52.0 61.0 21.0 52.4 89.5 4.2 --- Convenience Retail 2.3 2.3 0.1 0.5 2.7 0.0 ---- Convenience Stores 2.3 2.3 0.1 0.5 2.7 0.0 ---- Forecourt Retailers 0.0 0.0 0.0 0.0 0.0 0.0 --- Supermarkets 12.3 25.3 11.8 29.8 19.4 2.2 --- Hypermarkets 12.2 12.0 3.5 10.3 13.2 0.2 --- Discounters 0.0 0.0 0.0 0.0 0.0 0.0 --- Warehouse Clubs 0.0 0.0 0.0 0.0 0.0 0.0 --- Food/drink/tobacco 0.0 0.0 0.0 0.0 0.0 0.0 specialists --- Small Local Grocers 25.2 21.3 5.6 11.8 54.2 1.9 -- Non-Grocery Retailers 42.9 22.6 61.3 19.9 3.6 75.9 --- General Merchandise 4.0 1.0 5.6 0.0 1.2 28.3 Stores ---- Department Stores 4.0 1.0 5.6 0.0 1.2 28.3 ---- Variety Stores 0.0 0.0 0.0 0.0 0.0 0.0 --- Apparel and 0.0 0.0 0.0 0.0 0.0 0.0 Footwear Specialists --- Appliances and 0.0 0.0 0.0 0.0 0.0 0.0 Electronics Specialists --- Home Products 0.0 0.0 0.0 0.0 0.0 0.0 Specialists --- Health and Beauty 14.2 21.6 55.7 19.9 2.4 47.5 Specialists ---- Beauty Specialists 0.0 21.0 53.4 18.6 2.4 47.5
  16. B E A U T Y A N D P

    E R S O N A L C A R E I N V I E T N A M P a s s p o r t 9 © E u r o m o n i t o r I n t e r n a t i o n a l ---- Pharmacies 5.4 0.0 0.0 0.2 0.0 0.0 ---- Optical Goods Stores 0.0 0.0 0.0 0.0 0.0 0.0 ---- Health and 8.8 0.6 2.3 1.1 0.0 0.0 Personal Care Stores --- Leisure and 0.0 0.0 0.0 0.0 0.0 0.0 Personal Goods Specialists --- Other Non-Grocery 24.7 0.0 0.0 0.0 0.0 0.0 Retailers -- Vending 0.0 0.0 0.0 0.0 0.0 0.0 -- Direct Selling 0.2 1.2 4.5 7.5 0.0 4.6 - Retail E-Commerce 4.9 15.2 13.3 20.1 6.8 15.4 Non-retail channels 0.0 0.0 0.0 0.0 0.0 0.0 - Hair Salons 0.0 0.0 0.0 0.0 0.0 0.0 Total 100.0 100.0 100.0 100.0 100.0 100.0 Hair Care Men's Oral Care Skin Care Sun Care Grooming Retail Channels 99.9 100.0 100.0 100.0 100.0 - Retail Offline 90.0 87.8 97.2 83.0 91.9 -- Grocery Retailers 72.5 53.6 76.4 20.0 56.6 --- Convenience Retail 2.3 1.8 4.5 0.5 2.7 ---- Convenience Stores 2.3 1.8 4.5 0.5 2.7 ---- Forecourt Retailers 0.0 0.0 0.0 0.0 0.0 --- Supermarkets 31.2 22.3 21.2 9.8 17.8 --- Hypermarkets 18.8 12.2 17.3 4.4 12.0 --- Discounters 0.0 0.0 0.0 0.0 0.0 --- Warehouse Clubs 0.0 0.0 0.0 0.0 0.0 --- Food/drink/tobacco 0.0 0.0 0.0 0.0 0.0 specialists --- Small Local Grocers 20.2 17.3 33.4 5.4 24.1 -- Non-Grocery Retailers 17.0 31.3 13.8 58.7 27.7 --- General Merchandise 0.4 6.8 0.0 30.5 4.6 Stores ---- Department Stores 0.4 6.8 0.0 30.5 4.6 ---- Variety Stores 0.0 0.0 0.0 0.0 0.0 --- Apparel and 0.0 0.0 0.0 0.0 0.0 Footwear Specialists --- Appliances and 0.0 0.0 0.0 0.0 0.0 Electronics Specialists --- Home Products 0.0 0.0 0.0 0.0 0.0 Specialists --- Health and Beauty 16.5 24.4 13.8 28.2 21.0 Specialists ---- Beauty Specialists 12.9 21.7 0.0 27.1 13.1 ---- Pharmacies 3.0 1.3 8.2 0.8 2.2 ---- Optical Goods Stores 0.0 0.0 0.0 0.0 0.0 ---- Health and 0.7 1.4 5.7 0.4 5.7 Personal Care Stores --- Leisure and 0.0 0.0 0.0 0.0 0.0 Personal Goods Specialists --- Other Non-Grocery 0.0 0.0 0.0 0.0 2.1 Retailers -- Vending 0.0 0.0 0.0 0.0 0.0 -- Direct Selling 0.5 2.9 7.0 4.3 7.5 - Retail E-Commerce 9.9 12.1 2.8 17.0 8.1 Non-retail channels 0.1 0.0 0.0 0.0 0.0 - Hair Salons 0.1 0.0 0.0 0.0 0.0 Total 100.0 100.0 100.0 100.0 100.0
  17. B E A U T Y A N D P

    E R S O N A L C A R E I N V I E T N A M P a s s p o r t 10 © E u r o m o n i t o r I n t e r n a t i o n a l Source: Euromonitor International from official statistics, trade associations, trade press, company research, store checks, trade interviews, trade sources Key: BC = baby and child-specific products; BS = bath and shower; CC = colour cosmetics; DO = deodorants; DP = depilatories; FR = fragrances; HC = hair care; MG = men’s grooming; OC = oral care; SK = skin care; SU = sun care Table 8 Forecast Sales of Beauty and Personal Care by Category: Value 2022-2027 VND billion 2022 2023 2024 2025 2026 2027 Dermocosmetics Beauty 2,068.1 - - - - - and Personal Care Mass Beauty and 40,030.0 41,709.5 43,703.5 45,988.0 48,502.1 51,240.5 Personal Care Prestige Beauty and 10,970.8 - - - - - Personal Care Premium Beauty and 12,352.3 12,866.9 13,482.0 14,154.4 14,892.7 15,730.4 Personal Care Sun Care 145.1 152.1 160.7 170.7 182.0 194.9 Skin Care 21,363.8 22,442.4 23,712.9 25,173.5 26,796.5 28,604.5 Oral Care Excl Power 7,980.1 8,132.1 8,294.1 8,457.1 8,613.2 8,769.6 Toothbrushes Oral Care 7,980.1 8,132.1 8,294.1 8,457.1 8,613.2 8,769.6 Men's Grooming 5,343.9 5,591.3 5,883.1 6,216.7 6,599.5 7,026.8 Hair Care 16,253.5 16,642.9 17,168.1 17,781.2 18,456.2 19,188.0 Fragrances 2,513.7 2,659.3 2,803.3 2,948.9 3,093.7 3,240.9 Depilatories 18.0 18.7 19.4 20.2 21.0 21.8 Deodorants 2,437.0 2,523.6 2,630.8 2,763.1 2,914.4 3,092.5 Colour Cosmetics 3,066.2 3,237.9 3,433.4 3,651.5 3,904.0 4,194.4 Bath and Shower 5,168.8 5,426.1 5,703.2 5,986.1 6,275.0 6,565.0 Baby and Child-specific 1,446.7 1,505.6 1,588.0 1,683.5 1,790.2 1,908.9 Products Beauty and Personal Care 61,153.8 63,533.4 66,341.6 69,501.8 72,956.4 76,738.3 Source: Euromonitor International from trade associations, trade press, company research, trade interviews, trade sources Note 1: Prestige/premium/mass beauty and personal care sales are additionally included within baby and child- specific products, bath and shower, colour cosmetics, deodorants, fragrances, hair care, skin care and sun care Note 2: Sum of categories is greater than market size because of double counting in men’s bath and shower, men’s deodorants, men’s hair care, men’s skin care, men’s fragrances and baby and child-specific sun care categories Table 9 Forecast Sales of Beauty and Personal Care by Category: % Value Growth 2022-2027 % constant value growth 2022/2023 2022-27 CAGR 2022/27 Total Dermocosmetics Beauty and Personal Care - - - Mass Beauty and Personal Care 4.2 5.1 28.0 Prestige Beauty and Personal Care - - - Premium Beauty and Personal Care 4.2 5.0 27.3 Sun Care 4.8 6.1 34.3 Skin Care 5.0 6.0 33.9 Oral Care Excl Power Toothbrushes 1.9 1.9 9.9 Oral Care 1.9 1.9 9.9 Men's Grooming 4.6 5.6 31.5 Hair Care 2.4 3.4 18.1
  18. B E A U T Y A N D P

    E R S O N A L C A R E I N V I E T N A M P a s s p o r t 11 © E u r o m o n i t o r I n t e r n a t i o n a l Fragrances 5.8 5.2 28.9 Depilatories 3.9 3.9 20.9 Deodorants 3.6 4.9 26.9 Colour Cosmetics 5.6 6.5 36.8 Bath and Shower 5.0 4.9 27.0 Baby and Child-specific Products 4.1 5.7 32.0 Beauty and Personal Care 3.9 4.6 25.5 Source: Euromonitor International from trade associations, trade press, company research, trade interviews, trade sources Note 1: Prestige/premium/mass beauty and personal care sales are additionally included within baby and child- specific products, bath and shower, colour cosmetics, deodorants, fragrances, hair care, skin care and sun care Note 2: Sum of categories is greater than market size because of double counting in men’s bath and shower, men’s deodorants, men’s hair care, men’s skin care, men’s fragrances and baby and child-specific sun care categories DISCLAIMER Forecast and scenario closing date: 10 April 2023 Report closing date: 4 May 2023 Analysis and data in this report give full consideration to consumer behaviour and market performance in 2022 and beyond as of the dates above. For the very latest insight on this industry and consumer behaviour, at both global and national level, readers can access strategic analysis and updates on www.euromonitor.com and via the Passport system, where new content is being added on a systematic basis. SOURCES Sources used during the research included the following: Summary 1 Research Sources Official Sources Australia Embassy General Statistic Office Hanoi Revenue Office Hochiminh Revenue Office Minh Trang Salon Ministry of Health Ministry of Information Ministry of Trade Viet Trade Vietnam Chamber of Commerce & Industry Vietnam Custom Office Vietnam Trade Fair Trade Associations American Chamber of Commerce Cosmetics, Toiletries & Fragrances Association (CTFA)
  19. B E A U T Y A N D P

    E R S O N A L C A R E I N V I E T N A M P a s s p o r t 12 © E u r o m o n i t o r I n t e r n a t i o n a l metric.vn Vietnam National Essential Oils, Aromatic & Cosmetics Trade Press Beauty Business News Camnangmuasam.com Cosmade.com Cosmetique News Dep Magazine Online Diendannuochoa.com European Cosmetic Markets Financial Times Forbes Happi Magazine International Cosmetique News Nuoc Hoa Sai Gon Phu Nu Online Newspaper Sai GonTiep Thi Saigon Times Weekly Sify.com Soap Perfumery & Cosmetics South Information Net Thegioidep.vn thitruongnews.com Tuoi Tre Vietnam Agency Vietnam Economy News Online Vietnam News vietnamnet.vn Vietstock Source: Euromonitor International
  20. B E A U T Y A N D P

    E R S O N A L C A R E I N V I E T N A M P a s s p o r t 13 © E u r o m o n i t o r I n t e r n a t i o n a l BABY AND CHILD-SPECIFIC PRODUCTS IN VIETNAM - CATEGORY ANALYSIS KEY DATA FINDINGS ▪ Retail value sales increase by 4% in current terms in 2022 to VND1.4 trillion ▪ Nappy (diaper) rash treatments is the best performing category in 2022, with retail value sales increasing by 23% in current terms to VND28.9 billion ▪ Johnson & Johnson Vietnam Co Ltd is the leading player in 2022, with a retail value share of 11% ▪ Retail sales are set to increase at a current value CAGR of 10% (2022 constant value CAGR of 6%) over the forecast period to VND2.3 trillion 2022 DEVELOPMENTS Growth despite fewer children, due to higher spending per child According to the government, in 2022 Vietnam had an average birth rate of 2.01 per woman, which was on a slowing trend. Meanwhile, GDP hit its highest level over the past 25 years. This meant that people had higher incomes and living standards, but had fewer children, therefore parents had the disposable income to spend more on baby and child-specific products. The category recorded positive current value growth in 2022, although this was a rebound after two years of decline, and sales were still unable to return to the pre-pandemic level, seen in 2019. The rebound was also driven by parents investing time and effort in looking for the right baby an child-specific products for different needs, such as hair care and skin care, although nappy (diaper) rash treatments saw the strongest growth. Previously, parents were likely to choose combination products for their babies to save time and effort. But since clear efficacy was not visible from using these products, they have gradually started to switch to using separate specific items for their children. Growth was also supported by marketing activities from multiple brands as they expanded to rural areas, raising consumer awareness. Product preferences vary between rural and urban parents Differences have been observed between the purchasing decisions of parents in urban and rural areas. Parents in rural areas tend to be massively impacted by word-of-mouth recommendations from family and friends, and opinions and feedback from consultants in stores, and they prefer baby and child-specific products with a long-lasting scent. Meanwhile, parents in urban areas have various brand options available in big stores, and higher incomes, which leads them to consider a lot of features before buying – they are mostly keen to find the best skin moisturiser, for instance – and prefer organic ingredients and natural scents. Global brands dominate baby and child-specific products in Vietnam Global brands continued to lead baby and child-specific products in value terms in 2022, with various features usually added to their products. Multinational Johnson & Johnson was the
  21. B E A U T Y A N D P

    E R S O N A L C A R E I N V I E T N A M P a s s p o r t 14 © E u r o m o n i t o r I n t e r n a t i o n a l category leader in 2022, and the only player to hold a double-digit value share, thanks to nationwide distribution of its well-known Johnson’s Baby brand. Not only does it focus on improving its products to meet the needs of parents and their children, such as offering products containing long-lasting scents, and no chemicals, such as parabens, sulphates or phthalates, but also helps parents to gain knowledge and use the right products for each life stage of their child through content marketing. Besides, Johnson & Johnson is very dynamic in terms of marketing activities, such as mini games on social media, in-store gifts, and combos with deep discounts online, amongst others. It is also active in the use of livestreaming on social networks such as Facebook and TikTok, which helps the company to raise brand and product awareness and interact with consumers. However, the category remains fragmented, and imported bath and shower products for babies and children have been emerging recently and attracting consumers, especially from Thailand, such as D-nee, which offers multiple cute bottle design to excite children. PROSPECTS AND OPPORTUNITIES Rising incomes set to drive solid growth for baby and child-specific products Strong and rising current value growth rates are expected for baby and child-specific products in the forecast period, with current value growth expected across all categories, and recovery to the pre-pandemic level of sales in 2023. This is in large part likely to be due to government policies to support the birth rate. The birth rate was relatively low recently in some southern provinces of the country. The government has thus launched supporting programmes to boost the birth rate over the years. Taking Ho Chi Minh City as an example, the city has set the goal of encouraging every couple to have two children to raise the city’s birth rate, with a focus on support with hospital fees (co-payments, insurance) for couples having a second child, in addition to support buying social housing. Meanwhile, value growth is also expected to be supported by rising income levels, and parents’ willingness to pay more to get the best products for their babies. Despite government efforts, there are likely to be population-related volume challenges for baby and child-specific products, and some players are expected to concentrate on establishing growth in value terms by focusing on the premium segment. This is expected to drive product innovation over the forecast period, as brand owners try to cater to health and wellness trends, especially amongst middle- and high-income consumers, who are more willing and able to pay more for higher-quality products for babies and children, whether organic, with natural ingredients, or gentler on the skin. Continued dominance of global brands expected Global brands are forecast to continue to lead baby and child-specific products in Vietnam in the forecast period. Johnson’s Baby from Johnson & Johnson has maintained its lead for years, as it is a trusted, top-of-mind brand name, and offers various product options. Besides, more local brands are expected to join the category with niche products, especially organic or natural brands that offer baby shampoo or shower gel. CO MEM is one recent example, with its Pipi No Tears Shampoo attracting attention from consumers. It claims to be free from sulphates, parabens, silicone, and artificial colours and fragrances, and to contain essential oils to prevent coughs and colds, as well as glycerine for soft skin. Such launches by small players are expected to maintain the high level of fragmentation in the category, with the smallest players, included under “others”, expected to continue to account for more than half of sales.
  22. B E A U T Y A N D P

    E R S O N A L C A R E I N V I E T N A M P a s s p o r t 15 © E u r o m o n i t o r I n t e r n a t i o n a l Specialist retailers expected to remain important With the expansion of mother and baby specialist retailers outside urban areas, in the forecast period this channel is expected to remain important, since consumers buy baby and child- specific products from such outlets, especially well-known retailers, to ensure the quality and origin of the products they purchase. Even though the average unit price is sometimes slightly higher than in traditional stores or via online channels, the customer service is relatively good, and professional consultations and advice are valued by first-time parents. Taking Concung as an example, the retailer has reached over 200 stores across all provinces, and has more than 2,000 products available, giving consumers a trusted place to shop for their children. Nevertheless, it has also built a website, and provides online shopping for baby products ranging from baby food and vitamins and dietary supplements for children, to baby and child- specific hair care products and toiletries. Despite the popularity of mother and baby specialist retailers, e-commerce continued to see a rising share of sales in 2022, even as the impact of the pandemic disappeared, and this is expected to continue in the forecast period, especially for repeat purchases. CATEGORY DATA Table 10 Sales of Baby and Child-specific Products by Category: Value 2017-2022 VND billion 2017 2018 2019 2020 2021 2022 Nappy (Diaper) Rash 19.3 21.2 23.5 25.6 23.5 28.9 Treatments Medicated Baby and - - - - - - Child-specific Products Baby Wipes 84.0 93.1 105.0 121.6 133.3 144.7 Baby and Child-specific 794.6 850.2 901.2 874.2 821.7 841.6 Toiletries Baby and Child-specific 13.6 14.5 15.2 13.7 11.4 12.5 Sun Care Baby and Child-specific 136.7 118.8 124.7 117.2 107.8 111.6 Skin Care Baby and Child-specific 289.0 309.2 330.3 323.6 297.8 307.3 Hair Care Baby and Child-specific 1,337.2 1,406.9 1,499.9 1,475.9 1,395.5 1,446.7 Products Source: Euromonitor International from official statistics, trade associations, trade press, company research, store checks, trade interviews, trade sources Table 11 Sales of Baby and Child-specific Products by Category: % Value Growth 2017- 2022 % current value growth 2021/22 2017-22 CAGR 2017/22 Total Nappy (Diaper) Rash Treatments 23.0 8.4 49.6 Medicated Baby and Child-specific Products - - - Baby Wipes 8.6 11.5 72.3 Baby and Child-specific Toiletries 2.4 1.2 5.9 Baby and Child-specific Sun Care 9.2 -1.7 -8.1
  23. B E A U T Y A N D P

    E R S O N A L C A R E I N V I E T N A M P a s s p o r t 16 © E u r o m o n i t o r I n t e r n a t i o n a l Baby and Child-specific Skin Care 3.5 -4.0 -18.4 Baby and Child-specific Hair Care 3.2 1.2 6.4 Baby and Child-specific Products 3.7 1.6 8.2 Source: Euromonitor International from official statistics, trade associations, trade press, company research, store checks, trade interviews, trade sources Table 12 Sales of Baby and Child-specific Products by Premium vs Mass: % Value 2017- 2022 % retail value rsp 2017 2018 2019 2020 2021 2022 Premium - - - - - - Mass 100.0 100.0 100.0 100.0 100.0 100.0 Total 100.0 100.0 100.0 100.0 100.0 100.0 Source: Euromonitor International from official statistics, trade associations, trade press, company research, store checks, trade interviews, trade sources Table 13 NBO Company Shares of Baby and Child-specific Products: % Value 2018- 2022 % retail value rsp Company 2018 2019 2020 2021 2022 Johnson & Johnson Vietnam 12.2 11.6 11.3 11.2 11.2 Co Ltd Minh Viet International JSC 6.4 6.6 6.4 6.3 6.2 Viet My Hoa Phong Co Ltd 5.9 5.9 5.8 5.8 5.8 Bübchen-Werk Ewald Hermes 6.5 6.0 5.8 5.7 5.8 Pharmazeutische Fabrik GmbH Sanofi-Aventis Vietnam Co 3.1 3.2 3.1 3.1 3.1 Ltd Diana JSC 1.4 1.6 2.0 2.3 2.4 Dong Hiep Trade & 1.5 1.6 1.8 2.1 2.1 Investment Co Ltd Neo Corporate Co Ltd 2.2 2.2 2.1 2.1 2.1 Kimberly-Clark Vietnam Co 0.6 0.7 0.8 1.0 1.1 Ltd Actavis International Ltd 0.8 0.8 0.9 0.9 1.0 Tai Sun Enterprise Co Ltd 0.6 0.6 0.8 0.9 1.0 Ky Vy Corp 0.6 0.6 0.7 0.8 0.9 Bayer Vietnam Ltd 0.5 0.5 0.6 0.6 0.7 Yahon Enterprise Co Ltd 0.5 0.5 0.5 0.6 0.6 Ontex BVBA 0.3 0.4 0.4 0.5 0.5 Rohto-Mentholatum Vietnam 0.2 0.4 0.3 0.3 0.3 Co Ltd Beiersdorf Vietnam Ltd Co 0.2 0.2 0.2 0.1 0.2 Bio Consumer Co Ltd - - - - - Pigeon Corp - - - - - Oriflame Vietnam Ltd - - - - - Ascendia Brands Inc - - - - - Others 56.5 56.7 56.4 55.7 55.0 Total 100.0 100.0 100.0 100.0 100.0 Source: Euromonitor International from official statistics, trade associations, trade press, company research, store checks, trade interviews, trade sources
  24. B E A U T Y A N D P

    E R S O N A L C A R E I N V I E T N A M P a s s p o r t 17 © E u r o m o n i t o r I n t e r n a t i o n a l Table 14 LBN Brand Shares of Baby and Child-specific Products: % Value 2019-2022 % retail value rsp Brand (GBO) Company (NBO) 2019 2020 2021 2022 Johnson's Baby Johnson & Johnson Vietnam 10.2 9.9 9.8 9.8 (Johnson & Johnson Inc) Co Ltd Pigeon (Pigeon Corp) Minh Viet International JSC 6.6 6.4 6.3 6.2 Pureen (Pure Labs Inc) Viet My Hoa Phong Co Ltd 5.9 5.8 5.8 5.8 Bübchen (Katjes Group) Bübchen-Werk Ewald Hermes - 5.8 5.7 5.8 Pharmazeutische Fabrik GmbH Lactacyd Milky (Sanofi) Sanofi-Aventis Vietnam Co 3.2 3.1 3.1 3.1 Ltd Bobby (Unicharm Corp) Diana JSC 1.6 2.0 2.3 2.4 Mamamy Dong Hiep Trade & 1.6 1.8 2.1 2.1 Investment Co Ltd D-nee Neo Corporate Co Ltd 2.2 2.1 2.1 2.1 Huggies (Kimberly- Kimberly-Clark Vietnam Co 0.7 0.8 1.0 1.1 Clark Corp) Ltd Sudocrem (Teva Actavis International Ltd 0.8 0.9 0.9 1.0 Pharmaceutical Industries Ltd) Unifresh Tai Sun Enterprise Co Ltd 0.6 0.8 0.9 1.0 Bepanthen (Bayer AG) Bayer Vietnam Ltd 0.5 0.6 0.6 0.7 Bino Ky Vy Corp 0.4 0.5 0.6 0.6 Nuna Yahon Enterprise Co Ltd 0.5 0.5 0.6 0.6 Helen Harper Ontex BVBA 0.4 0.4 0.5 0.5 Sunplay (Rohto Rohto-Mentholatum Vietnam 0.4 0.3 0.3 0.3 Pharmaceutical Co Ltd) Co Ltd Babilon Ky Vy Corp 0.2 0.2 0.2 0.3 Nivea Sun (Beiersdorf Beiersdorf Vietnam Ltd Co 0.2 0.2 0.1 0.2 AG) Bübchen (Galderma SA) Bübchen-Werk Ewald Hermes 6.0 - - - Pharmazeutische Fabrik GmbH Sudocrem (Actavis Plc) Actavis International Ltd - - - - Sudocrem (Allergan Plc) Actavis International Ltd - - - - Sudocrem (Forest Actavis International Ltd - - - - Laboratories Inc) Lander Ascendia Brands Inc - - - - D-nee Bio Consumer Co Ltd - - - - Bübchen (Nestlé SA) Bübchen-Werk Ewald Hermes - - - - Pharmazeutische Fabrik GmbH Oriflame Baby Care Oriflame Vietnam Ltd - - - - (Oriflame Cosmetics SA) Baby Pigeon Corp - - - - Others Others 58.2 57.8 57.1 56.4 Total Total 100.0 100.0 100.0 100.0 Source: Euromonitor International from official statistics, trade associations, trade press, company research, store checks, trade interviews, trade sources Table 15 LBN Brand Shares of Baby and Child-specific Skin Care: % Value 2019-2022 % retail value rsp Brand (GBO) Company (NBO) 2019 2020 2021 2022 Bübchen Baby Cream Bübchen-Werk Ewald Hermes - 36.4 37.6 37.1 (Katjes Group) Pharmazeutische Fabrik GmbH
  25. B E A U T Y A N D P

    E R S O N A L C A R E I N V I E T N A M P a s s p o r t 18 © E u r o m o n i t o r I n t e r n a t i o n a l Johnson's Baby Oil Johnson & Johnson Vietnam 3.5 3.6 3.7 3.8 (Johnson & Johnson Inc) Co Ltd Pigeon Baby Lotion Minh Viet International JSC 3.4 3.5 3.5 3.6 (Pigeon Corp) Johnson's Baby Cream Johnson & Johnson Vietnam 2.6 2.6 2.7 2.8 (Johnson & Johnson Inc) Co Ltd Johnson's Baby Lotion Johnson & Johnson Vietnam 2.5 2.6 2.6 2.7 (Johnson & Johnson Inc) Co Ltd Johnson's Baby Clear Johnson & Johnson Vietnam 1.0 1.0 1.0 1.0 Anti-Mosquito Co Ltd (Johnson & Johnson Inc) Bübchen Baby Cream Bübchen-Werk Ewald Hermes 35.3 - - - (Galderma SA) Pharmazeutische Fabrik GmbH Lander Baby Lotion Ascendia Brands Inc - - - - Bübchen Baby Cream Bübchen-Werk Ewald Hermes - - - - (Nestlé SA) Pharmazeutische Fabrik GmbH Pigeon Baby Oil Minh Viet International JSC - - - - (Pigeon Corp) OK for Kids (Oriflame Oriflame Vietnam Ltd - - - - Cosmetics SA) Pureen Baby Lotion Viet My Hoa Phong Co Ltd - - - - (Pure Labs Inc) Others Others 51.7 50.4 49.0 49.0 Total Total 100.0 100.0 100.0 100.0 Source: Euromonitor International from official statistics, trade associations, trade press, company research, store checks, trade interviews, trade sources Table 16 LBN Brand Shares of Baby and Child-specific Sun Care: % Value 2019-2022 % retail value rsp Brand (GBO) Company (NBO) 2019 2020 2021 2022 Sunplay (Rohto Rohto-Mentholatum Vietnam 35.5 35.5 36.2 36.7 Pharmaceutical Co Ltd) Co Ltd Bübchen Baby Suncare Bübchen-Werk Ewald Hermes - 26.4 25.9 25.7 (Katjes Group) Pharmazeutische Fabrik GmbH Nivea Sun for Kids Beiersdorf Vietnam Ltd Co 19.0 19.0 18.2 20.5 (Beiersdorf AG) Bübchen Baby Suncare Bübchen-Werk Ewald Hermes 26.9 - - - (Galderma SA) Pharmazeutische Fabrik GmbH Bübchen Baby Suncare Bübchen-Werk Ewald Hermes - - - - (Nestlé SA) Pharmazeutische Fabrik GmbH Others Others 18.6 19.2 19.7 17.1 Total Total 100.0 100.0 100.0 100.0 Source: Euromonitor International from official statistics, trade associations, trade press, company research, store checks, trade interviews, trade sources Table 17 Forecast Sales of Baby and Child-specific Products by Category: Value 2022- 2027 VND billion 2022 2023 2024 2025 2026 2027 Nappy (Diaper) Rash 28.9 30.2 31.5 33.0 34.6 36.3 Treatments Medicated Baby and - - - - - - Child-specific Products
  26. B E A U T Y A N D P

    E R S O N A L C A R E I N V I E T N A M P a s s p o r t 19 © E u r o m o n i t o r I n t e r n a t i o n a l Baby Wipes 144.7 151.1 156.5 161.9 167.4 172.2 Baby and Child-specific 841.6 873.1 922.9 980.5 1,044.2 1,114.8 Toiletries Baby and Child-specific 12.5 13.6 14.7 15.9 17.1 18.3 Sun Care Baby and Child-specific 111.6 115.9 121.5 129.1 138.9 151.3 Skin Care Baby and Child-specific 307.3 321.9 340.7 363.1 388.0 416.1 Hair Care Baby and Child-specific 1,446.7 1,505.6 1,588.0 1,683.5 1,790.2 1,908.9 Products Source: Euromonitor International from trade associations, trade press, company research, trade interviews, trade sources Table 18 Forecast Sales of Baby and Child-specific Products by Category: % Value Growth 2022-2027 % constant value growth 2022/2023 2022-27 CAGR 2022/27 Total Nappy (Diaper) Rash Treatments 4.3 4.6 25.5 Medicated Baby and Child-specific Products - - - Baby Wipes 4.4 3.5 19.0 Baby and Child-specific Toiletries 3.7 5.8 32.5 Baby and Child-specific Sun Care 9.0 7.9 46.5 Baby and Child-specific Skin Care 3.8 6.3 35.5 Baby and Child-specific Hair Care 4.7 6.2 35.4 Baby and Child-specific Products 4.1 5.7 32.0 Source: Euromonitor International from trade associations, trade press, company research, trade interviews, trade sources Table 19 Forecast Sales of Baby and Child-specific Products by Premium vs Mass: % Value 2022-2027 % retail value rsp 2022 2023 2024 2025 2026 2027 Premium - - - - - - Mass 100.0 100.0 100.0 100.0 100.0 100.0 Total 100.0 100.0 100.0 100.0 100.0 100.0 Source: Euromonitor International from trade associations, trade press, company research, trade interviews, trade sources
  27. B E A U T Y A N D P

    E R S O N A L C A R E I N V I E T N A M P a s s p o r t 20 © E u r o m o n i t o r I n t e r n a t i o n a l BATH AND SHOWER IN VIETNAM - CATEGORY ANALYSIS KEY DATA FINDINGS ▪ Retail value sales increase by 6% in current terms in 2022 to VND5.2 trillion ▪ Body powder is the best performing category in 2022, with retail value sales increasing by 9% in current terms to VND29.2 billion ▪ Unilever Vietnam International Co Ltd is the leading player in 2022, with a retail value share of 36% ▪ Retail sales are set to grow at a current value CAGR of 9% (2022 constant value CAGR of 5%) over the forecast period to VND8.0 trillion 2022 DEVELOPMENTS Bath and shower records growth as hygiene habits are maintained Bath and shower saw solid current value growth during 2022, as consumers had higher living standards, and all activities returned to normal as COVID-19 eased, and routines outside the home resumed. Although after the decline seen in 2021 sales were unable to return to the 2020 level in 2022, this is unsurprising, given the exceptional surge in sales in the first year of the pandemic, when consumers stockpiled hygiene products, with this high level of sales difficult to maintain. Nevertheless, sales remained far higher than the pre-pandemic level, and continued higher demand for hygiene – a habit formed since the pandemic – boosted consumer demand for bath and shower products. Higher awareness of hygiene also helped hand sanitisers to return to growth, with sales remaining way above the pre-pandemic level. These products are still well-displayed across almost all distribution channels. Also, some of the growth in bath and shower came from rural areas, where previously people used shampoo instead of body wash to save money, and for convenience. Bar soap was the only category within bath and shower to record a decline, although this was slight, as such products are mainly used for cleaning hands, and there is limited brand choice. Scent and moisturising are important features in bath and shower products Scent remains the key factor to attract consumers to bath and shower products, especially in rural areas, where people usually prioritise choosing a long-lasting scent rather than other added-value features. Taking Enchanteur as a good example, the brand highlights its long- lasting scent across its product information and marketing messages, and has gradually become a top-of-mind brand for scent amongst local consumers. During 2022, Wipro also launched a new series: Enchanteur Naturelle Natural Body Wash with Lavender or Iris fragrance. These products not only contain natural ingredients, no parabens and no silicone, but also have an elegant bottle design which is totally different from the previous Enchanteur style. Imported bath and shower products from Korea and Singapore that claim to offer a “perfume shower” because of their strong scent have also recently been widely seen in modern distribution channels. The scent is often claimed to last for between three and eight hours – a feature which is attractive to consumers. For example, Gennie from Singapore offers variants
  28. B E A U T Y A N D P

    E R S O N A L C A R E I N V I E T N A M P a s s p o r t 21 © E u r o m o n i t o r I n t e r n a t i o n a l that reflect the personality of the wearer, such as Little Gold Dress For Her and Little Red Dress For Her, and these products claim to have a strong and long-lasting scent. Dry skin is also a common problem that many consumers face. For moisturising, Dove has become a top-of-mind brand, owing to its marketing technique of using reviews and recommendations from famous people across social media, with its key message being “Instant Moisturiser”. It also has different long-lasting scents, and by offering both moisturising and fragrance it finds it easy to convince consumers to purchase. Global player Unilever continues to lead bath and shower Unilever Vietnam International Co Ltd remained the biggest player in bath and shower in value terms in 2022, although it saw erosion of some of the share it gained in the first year of the pandemic. It has various brands in the category, including Dove, Hazeline and Lux, but its biggest brand is Lifebuoy, which also continued to lead overall bath and shower in Vietnam in 2022. Thanks to multiple product variants and meaningful activities, the brand has built a solid position in consumers’ minds – when thinking about antibacterial products, Lifebuoy tends to be the preferred choice. During 2022 and into 2023, Lifebuoy also supported consumers as they resumed activities outside of the home. For instance, the brand cooperated with the Ministry of Education and Training to carry out the campaign, “Cleaning at school – Lifebuoy brings 10,000 children back to school safely”. Lifebuoy also impresses consumers by always offering new variants, such as bath or hand wash foam format, or added ingredients, such as bitter melon, green tea, aloe vera, etc. Since the end of 2021, the company’s Dove body exfoliants series has also been a highlight, receiving a lot of good feedback on social media, especially TikTok – with these products quickly gaining a strong presence across offline and online channels. The brand is also highly active on the company’s e-commerce site, frequently giving deep discounts or being gifted with other Unilever products. Nevertheless, since Vietnam signed various free trade agreements with the EU and others, such as South Korea, Japan and Australia, during the review period, bath and shower is becoming more competitive, with the appearance of new international players. PROSPECTS AND OPPORTUNITIES Dynamic growth forecast for bath and shower in Vietnam as penetration rises Over the forecast period bath and shower is set to register dynamic current value increases annually, as continued high standards of personal hygiene and a return to pre-pandemic lifestyles will drive growth, with the return of tourists also expected to contribute to the rise in sales. Although hand sanitisers is expected to see one of the slowest growth rates in the forecast period, this is still an impressive performance, as it is forecast to expand on the gains seen in 2020, despite the impact of the pandemic having eased, demonstrating the maintenance of higher hygiene standards. Penetration of bath and shower products is also expected to expand further into rural areas, as brands’ marketing activities help to raise consumer awareness. Growth is also expected to be supported by consumers opting to purchase several task-specific products, instead of using a single product for multiple purposes. Within bath and shower, Vietnamese consumers tend not to be brand-loyal, because they think they should change brands at least once every six months for the best results; therefore, they are likely to be open to trying new products if the price is good and the product is well-marketed. In the coming years, the category is also expected to
  29. B E A U T Y A N D P

    E R S O N A L C A R E I N V I E T N A M P a s s p o r t 22 © E u r o m o n i t o r I n t e r n a t i o n a l see more brand variants, such as different scents, ingredients and features, to attract consumers. Green and male-specific products expected to gain popularity In line with other green product trends, higher-income consumers increasingly prefer to choose bath and shower products containing natural or organic ingredients, and are focusing more on the feature of moisturisation. For this reason, they prefer imported products, as there are fewer options available from domestic brands. The trend towards natural products from imported brands is expected to be maintained in the forecast period. Meanwhile, since male-specific options are quite limited, younger consumers have preferred to use unisex scented shower gel, which smells slightly sweet. However, in the forecast period the market is expected to see a wider choice of new male-specific brands, or new variants from existing brands. The packaging for these products will need to be focused on the male consumer group, be eye-catching, and stand out from other brands. Offline channels set to remain important as chains expand E-commerce has been growing steadily as a distribution channel for bath and shower products for many years, and this is set to continue in the forecast period. Nevertheless, offline channels, particularly modern trade channels, still retained their importance for bath and shower in 2022, and are likely to continue to account for the vast majority of sales in the forecast period. Bath and shower products can easily be found in offline retailers when a product is needed quickly, thanks to the expansion of supermarkets and mini supermarkets to rural areas. A wide choice of products is displayed in such outlets, making it easier for consumers to find a suitable product. Especially for organic products, as the unit prices are normally higher, consumers will tend to prioritise purchasing from a trusted retailer. CATEGORY DATA Table 20 Sales of Bath and Shower by Category: Value 2017-2022 VND billion 2017 2018 2019 2020 2021 2022 Liquid Soap 95.2 106.8 120.9 564.0 435.2 462.3 - Intimate Wipes - - - - - - - Intimate Washes 348.2 390.0 430.9 456.8 429.4 469.1 Intimate Hygiene 348.2 390.0 430.9 456.8 429.4 469.1 Hand Sanitisers 12.4 14.4 16.5 303.7 244.8 250.3 Body Wash/Shower Gel 2,286.7 2,469.7 2,643.5 2,775.7 2,859.0 3,069.0 Body Powder 30.9 30.8 30.6 29.1 26.8 29.2 Bath Additives - - - - - - Bar Soap 816.8 831.8 859.0 1,072.9 902.4 888.9 Bath and Shower 3,590.3 3,843.5 4,101.4 5,202.2 4,897.4 5,168.8 Source: Euromonitor International from official statistics, trade associations, trade press, company research, store checks, trade interviews, trade sources Table 21 Sales of Bath and Shower by Category: % Value Growth 2017-2022 % current value growth 2021/22 2017-22 CAGR 2017/22 Total
  30. B E A U T Y A N D P

    E R S O N A L C A R E I N V I E T N A M P a s s p o r t 23 © E u r o m o n i t o r I n t e r n a t i o n a l Liquid Soap 6.2 37.2 385.4 - Intimate Wipes - - - - Intimate Washes 9.2 6.1 34.7 Intimate Hygiene 9.2 6.1 34.7 Hand Sanitisers 2.2 82.4 1,921.6 Body Wash/Shower Gel 7.3 6.1 34.2 Body Powder 9.2 -1.1 -5.5 Bath Additives - - - Bar Soap -1.5 1.7 8.8 Bath and Shower 5.5 7.6 44.0 Source: Euromonitor International from official statistics, trade associations, trade press, company research, store checks, trade interviews, trade sources Table 22 Sales of Bath and Shower by Premium vs Mass: % Value 2017-2022 % retail value rsp 2017 2018 2019 2020 2021 2022 Premium 0.2 0.3 0.3 0.2 0.3 0.3 Mass 99.8 99.7 99.7 99.8 99.7 99.7 Total 100.0 100.0 100.0 100.0 100.0 100.0 Source: Euromonitor International from official statistics, trade associations, trade press, company research, store checks, trade interviews, trade sources Table 23 NBO Company Shares of Bath and Shower: % Value 2018-2022 % retail value rsp Company 2018 2019 2020 2021 2022 Unilever Vietnam 34.7 35.0 38.8 37.1 36.0 International Co Ltd Unza Vietnam Co Ltd 12.5 13.1 11.6 12.5 12.5 Hoa Linh Pharma Co Ltd 6.5 6.8 5.7 5.7 5.9 International Consumer 4.5 4.4 3.6 3.8 3.5 Products Co Ltd Sanofi-Aventis Vietnam Co 3.1 3.1 2.6 2.6 2.7 Ltd Henkel Vietnam Co Ltd 1.3 1.3 2.2 1.8 1.8 Procter & Gamble Vietnam 1.8 1.8 1.6 1.6 1.5 Ltd 3Ri Chemical Co Ltd 0.4 0.4 1.8 1.4 1.4 Dai Viet Huong Trading 1.5 1.5 1.2 1.2 1.2 Manufacturing Co Ltd LG Vina Cosmetics Co Ltd 1.7 1.4 1.1 1.2 1.2 Viet My Group 1.5 1.4 1.0 1.1 1.1 Gia Dinh Comestic Co Ltd 1.4 1.3 1.0 1.0 0.9 Lix Detergent JSC - - 1.2 1.0 0.9 Body Shop (Vietnam) Co 0.9 1.0 0.8 0.8 0.8 Ltd, The Johnson & Johnson Vietnam 1.1 1.0 0.8 0.7 0.7 Co Ltd Khobates Industries Sdn Bhd 0.2 0.2 0.7 0.6 0.6 Green Cross Vietnam Co Ltd 0.2 0.2 0.7 0.5 0.5 DKSH Vietnam Co Ltd 0.5 0.5 0.4 0.4 0.4 Amway Vietnam Co Ltd 0.4 0.4 0.3 0.4 0.3 Kao Vietnam Ltd 0.4 0.4 0.3 0.3 0.3 Fine Today Shiseido Co Ltd - - - 0.3 0.3
  31. B E A U T Y A N D P

    E R S O N A L C A R E I N V I E T N A M P a s s p o r t 24 © E u r o m o n i t o r I n t e r n a t i o n a l Oriflame Vietnam Ltd - - 0.4 0.2 0.2 Lana Cosmetics 0.1 0.1 0.2 0.2 0.2 Nu Skin Vietnam Co Ltd 0.1 0.1 0.1 0.1 0.1 Oral-B (Vietnam) Ltd 0.2 0.2 0.1 0.1 0.1 Beiersdorf Vietnam Ltd Co 0.1 0.1 0.1 0.1 0.1 Hals Group 0.1 0.1 0.1 0.1 0.1 Colgate-Palmolive 0.1 0.0 0.0 0.0 0.0 (Vietnam) Co Ltd Thuong Xuan Cosmetic Co Ltd 0.9 0.8 - - - Daso Group - - - - - Others 24.0 23.5 21.3 23.1 24.6 Total 100.0 100.0 100.0 100.0 100.0 Source: Euromonitor International from official statistics, trade associations, trade press, company research, store checks, trade interviews, trade sources Table 24 LBN Brand Shares of Bath and Shower: % Value 2019-2022 % retail value rsp Brand (GBO) Company (NBO) 2019 2020 2021 2022 Lifebuoy (Unilever Unilever Vietnam 27.6 32.9 30.8 29.8 Group) International Co Ltd Enchanteur (Wipro Ltd) Unza Vietnam Co Ltd 7.5 6.7 7.3 7.3 Da Huong Hoa Linh Pharma Co Ltd 6.8 5.7 5.7 5.9 Romano (Wipro Ltd) Unza Vietnam Co Ltd 3.7 3.4 3.6 3.6 X-Men (Marico Ltd) International Consumer 4.4 3.6 3.8 3.5 Products Co Ltd Lactacyd (Sanofi) Sanofi-Aventis Vietnam Co 3.1 2.6 2.6 2.7 Ltd Hazeline (Unilever Unilever Vietnam 3.4 2.8 2.9 2.7 Group) International Co Ltd Dove (Unilever Group) Unilever Vietnam 3.1 2.4 2.7 2.7 International Co Ltd Safeguard (Procter & Procter & Gamble Vietnam 1.8 1.6 1.6 1.5 Gamble Co, The) Ltd Gervenne (Wipro Ltd) Unza Vietnam Co Ltd 1.8 1.6 1.6 1.5 Dr Clean 3Ri Chemical Co Ltd 0.4 1.8 1.4 1.4 E100 Dai Viet Huong Trading 1.5 1.2 1.2 1.2 Manufacturing Co Ltd Double Rich (LG LG Vina Cosmetics Co Ltd 1.4 1.1 1.2 1.2 Household & Health Care Ltd) Thebol Viet My Group 1.4 1.0 1.1 1.1 Dial (Henkel AG & Co Henkel Vietnam Co Ltd 0.3 1.4 1.0 1.0 KGaA) Familiar Gia Dinh Comestic Co Ltd 1.3 1.0 1.0 0.9 On1 Lix Detergent JSC - 1.2 1.0 0.9 The Body Shop Body Shop (Vietnam) Co 1.0 0.8 0.8 0.8 (Natura&Co) Ltd, The Lux (Unilever Group) Unilever Vietnam 0.9 0.7 0.8 0.7 International Co Ltd Fruiser Khobates Industries Sdn Bhd 0.2 0.7 0.6 0.6 Coast (High Ridge Henkel Vietnam Co Ltd 0.7 0.6 0.6 0.6 Brands Co) Green Cross (Green Green Cross Vietnam Co Ltd 0.2 0.7 0.5 0.5 Cross Inc) Johnson's Baby Johnson & Johnson Vietnam 0.6 0.4 0.4 0.4 (Johnson & Johnson Inc) Co Ltd Camay (Unilever Group) DKSH Vietnam Co Ltd 0.5 0.4 0.4 0.4
  32. B E A U T Y A N D P

    E R S O N A L C A R E I N V I E T N A M P a s s p o r t 25 © E u r o m o n i t o r I n t e r n a t i o n a l G&H (Amway Corp) Amway Vietnam Co Ltd 0.4 0.3 0.4 0.3 Bioré (Kao Corp) Kao Vietnam Ltd 0.4 0.3 0.3 0.3 Senka Fine Today Shiseido Co Ltd - - 0.3 0.3 Fa (Henkel AG & Co Henkel Vietnam Co Ltd 0.3 0.2 0.2 0.2 KGaA) Oriflame (Oriflame Oriflame Vietnam Ltd - 0.4 0.2 0.2 Cosmetics SA) Johnson's pH 5.5 Johnson & Johnson Vietnam 0.3 0.2 0.2 0.2 (Johnson & Johnson Inc) Co Ltd Oriflame (Oriflame Thuong Xuan Cosmetic Co Ltd 0.8 - - - Cosmetics SA) Others Others 24.3 22.1 23.8 25.3 Total Total 100.0 100.0 100.0 100.0 Source: Euromonitor International from official statistics, trade associations, trade press, company research, store checks, trade interviews, trade sources Table 25 LBN Brand Shares of Premium Bath and Shower: % Value 2019-2022 % retail value rsp Brand (GBO) Company (NBO) 2019 2020 2021 2022 Nu Skin (Nu Skin Nu Skin Vietnam Co Ltd 46.7 52.0 54.4 54.9 Enterprises Inc) L'Occitane Hals Group 33.3 28.0 25.2 23.2 (L'Occitane International SA) Fresh Saigon Cosmetics Corp - - - - Others Others 20.0 20.0 20.4 21.9 Total Total 100.0 100.0 100.0 100.0 Source: Euromonitor International from official statistics, trade associations, trade press, company research, store checks, trade interviews, trade sources Table 26 Forecast Sales of Bath and Shower by Category: Value 2022-2027 VND billion 2022 2023 2024 2025 2026 2027 Liquid Soap 462.3 484.8 505.7 525.8 544.6 563.1 - Intimate Wipes - - - - - - - Intimate Washes 469.1 510.9 555.9 601.2 648.7 698.3 Intimate Hygiene 469.1 510.9 555.9 601.2 648.7 698.3 Hand Sanitisers 250.3 256.8 265.8 276.6 289.6 304.9 Body Wash/Shower Gel 3,069.0 3,262.0 3,454.5 3,642.4 3,827.7 4,005.6 Body Powder 29.2 31.2 32.8 34.1 35.3 36.5 Bath Additives - - - - - - Bar Soap 888.9 880.4 888.6 905.9 929.0 956.5 Bath and Shower 5,168.8 5,426.1 5,703.2 5,986.1 6,275.0 6,565.0 Source: Euromonitor International from trade associations, trade press, company research, trade interviews, trade sources Table 27 Forecast Sales of Bath and Shower by Category: % Value Growth 2022-2027 % constant value growth 2022/2023 2022-27 CAGR 2022/27 Total
  33. B E A U T Y A N D P

    E R S O N A L C A R E I N V I E T N A M P a s s p o r t 26 © E u r o m o n i t o r I n t e r n a t i o n a l Liquid Soap 4.9 4.0 21.8 - Intimate Wipes - - - - Intimate Washes 8.9 8.3 48.9 Intimate Hygiene 8.9 8.3 48.9 Hand Sanitisers 2.6 4.0 21.8 Body Wash/Shower Gel 6.3 5.5 30.5 Body Powder 6.6 4.5 24.8 Bath Additives - - - Bar Soap -1.0 1.5 7.6 Bath and Shower 5.0 4.9 27.0 Source: Euromonitor International from trade associations, trade press, company research, trade interviews, trade sources Table 28 Forecast Sales of Bath and Shower by Premium vs Mass: % Value 2022-2027 % retail value rsp 2022 2023 2024 2025 2026 2027 Premium 0.3 0.3 0.3 0.3 0.3 0.4 Mass 99.7 99.7 99.7 99.7 99.7 99.6 Total 100.0 100.0 100.0 100.0 100.0 100.0 Source: Euromonitor International from trade associations, trade press, company research, trade interviews, trade sources
  34. B E A U T Y A N D P

    E R S O N A L C A R E I N V I E T N A M P a s s p o r t 27 © E u r o m o n i t o r I n t e r n a t i o n a l COLOUR COSMETICS IN VIETNAM - CATEGORY ANALYSIS KEY DATA FINDINGS ▪ Retail value sales increase by 7% in current terms in 2022 to VND3.1 trillion ▪ Nail products is the best performing category in 2022, with retail value sales growing by 9% in current terms to VND113 billion ▪ L’Oréal Vietnam Co Ltd is the leading player in 2022, with a retail value share of 18% ▪ Retail sales are set to grow at a current value CAGR of 11% (2022 constant value CAGR of 7%) over the forecast period to VND5.1 trillion 2022 DEVELOPMENTS Colour cosmetics returns to growth as mobility returns After two years of double-digit current value decline due to the pandemic limiting the occasions to wear make-up, colour cosmetics recorded a rebound to growth in 2022, with increases seen across all categories. Sales increased as a large number of younger consumers invested in beauty products. Overall, rising income levels, evolving beauty standards, the higher penetration of social media, and Korean and Western make-up trends all contributed to growth in demand. The presence of beauty TikToks also increased over recent years, creating a variety of make-up trends, which also contributed to the growth of colour cosmetics – such as videos teaching consumers how to do the basics of daily make-up. As many consumers remained price-conscious, mass colour cosmetics saw stronger growth than premium, and also continued to account for the highest share of sales. However, despite the return to growth, overall sales of colour cosmetics remained way below the pre-pandemic level, with full recovery not expected until the middle of the forecast period. Diverse colour cosmetics trends Given the nature of make-up in terms of the high frequency of changes in style, this creates various trends in colour cosmetics in Vietnam. The most important trends in 2022 were natural/safe ingredients, no animal testing, and nourishing features such as moisturising. For lipsticks, long-lasting (all day wear) and moisturising were must-have features to attract consumers. Meanwhile, the combination product of lipstick and blusher is highly popular amongst office workers due to its convenience. In 2022, affected by Western style, brown lipstick colours sold very quickly in the holiday season, boosted by TikTok make-up tutorial videos. Besides, “wet-look” make-up, and a natural look of “make-up without make-up” were trends favoured by the younger generation, who were also looking for nurturing features amongst colour cosmetics products. Global brands still dominate colour cosmetics in Vietnam L’Oréal Vietnam Co Ltd continued to lead colour cosmetics in Vietnam in value terms in 2022, offering various brands and products across the category. The company offers brands including L'Oréal Paris, and the premium brands Lancôme and Shu Uemura, but its leading brand
  35. B E A U T Y A N D P

    E R S O N A L C A R E I N V I E T N A M P a s s p o r t 28 © E u r o m o n i t o r I n t e r n a t i o n a l Maybelline New York was also the leading brand in overall colour cosmetics in 2022. The company has been active in terms of social media marketing campaigns, with a strong focus on boosting e-commerce as a distribution channel by offering discounts and gifts every day. Its Maybelline Mascara is very popular, always receiving good feedback and gradually taking the spotlight – considered by many as the best value for money mascara in Vietnam. In 2022, it cooperated with Modiface and introduced a virtual try-on feature, through which consumers can experiment with over 400 make-up shades. While global brands dominate colour cosmetics in Vietnam, local brands are also emerging and becoming more popular amongst niche consumer groups. CO MEM Natural Cosmetics Jsc is a good example. It was founded in 2015 by a team of pharmacists, and the brand applies modern science to produce products containing traditional herbal ingredients, which are 100% non-toxic, safe, and environmentally-friendly, therefore tapping into the “green” consumer group. PROSPECTS AND OPPORTUNITIES Strong growth expected for colour cosmetics, leading to full recovery Colour cosmetics is set to see double-digit current value growth in all years of the forecast period, returning to the pre-pandemic level of sales in 2025. Growth is expected across all categories, although facial make-up is set to see the strongest increase, and will return to the 2019 level of sales the earliest – in 2024. Consumers are likely to be attracted by increasingly sophisticated ranges in this category. For example, consumers can now find facial make-up with added SPF50+. Higher incomes will also give consumers the disposable income to spend on such products, and global trends will also attract consumers’ attention. Vietnamese consumers are likely to be willing to spend on products which can be easily applied on a daily basis. As the internet increases its penetration of rural areas, younger consumers are likely to be influenced by media content and make-up at an earlier age. Such consumers are expected to prioritise the purchase of trusted brands with good customer feedback offering value for money products. Global brands expected to continue to lead, and premium products will perform well Colour cosmetics is expected to see stronger competition in the coming years. In the main, global brands are expected to be the source of new trends. While local companies may be slower to adapt, global brands are able to quickly offer various choices at multiple prices in Vietnam. However, people are also becoming more health-conscious, and tend to pay more attention to the origin of ingredients. Local brands will therefore have opportunities for growth in this niche by offering organic or natural products at reasonable prices. For instance, CO MEM Natural Cosmetics Jsc offers facial make-up and lip products which are promoted as being made from natural ingredients, and safe for people who are allergic to chemicals. Local brands will also appeal through endorsement by celebrities, make-up artists, YouTubers, or singers who enjoy a reputation for fashion and style, and bring a large number of followers. Meanwhile, Vietnamese consumers’ mindset is gradually changing – they are becoming increasingly willing to spend on high-quality colour cosmetics, knowing that these products are likely to last them a few months. Premium colour cosmetics therefore has the opportunity to see strong growth in the coming years, especially for gifting, to show care for the recipient. Brands likely to focus more on e-commerce The expansion of various retail chains, such as Watsons and Guardian, and new players, such as Pharmacity and Matsumoto, will increase the reach of imported colour cosmetics
  36. B E A U T Y A N D P

    E R S O N A L C A R E I N V I E T N A M P a s s p o r t 29 © E u r o m o n i t o r I n t e r n a t i o n a l brands to middle-class consumers, as well as to wider regions in Vietnam. This will help offline retailers to maintain their leading role in the distribution of colour cosmetics. Nevertheless, e- commerce saw strong growth in colour cosmetics in recent years, particularly during the pandemic, and this is set to continue. Indeed, colour cosmetics are cited as one of the top five products sold via e-commerce platforms, with Shopee and Lazada the two most popular e- commerce marketplaces for these products. In the forecast period, global brands are expected to deepen their focus on e-commerce sites such as Shopee, Lazada, and Tiki, since many consumers have already decided their favourite products, and are gradually becoming more open to buying them online from trusted retailers. Buying online also offers consumers various options, deep discounts on double-days, gifts, and most importantly the products follow the latest trends. In terms of social media platforms, Facebook and TikTok have become popular channels, with players using livestreams to attract attention and inform and engage consumers. For example, Shiseido runs livestreams with make-up artists and skin care experts to offer beauty and skin care advice and introduce its products to consumers. CATEGORY DATA Table 29 Sales of Colour Cosmetics by Category: Value 2017-2022 VND billion 2017 2018 2019 2020 2021 2022 - Mass Colour Cosmetics 31.8 40.8 50.2 43.3 37.8 40.5 Sets/Kits - Premium Colour 3.9 4.6 5.1 3.9 2.8 3.0 Cosmetics Sets/Kits Colour Cosmetics Sets/ 35.7 45.5 55.3 47.2 40.5 43.5 Kits -- Mass Other Nail - - - - - - Products -- Premium Other Nail - - - - - - Products - Other Nail Products - - - - - - -- Mass Polish Remover 11.5 13.4 15.6 13.8 10.6 11.7 -- Premium Polish Remover - - - - - - - Polish Remover 11.5 13.4 15.6 13.8 10.6 11.7 -- Mass Nail Treatments/ - - - - - - Strengthener -- Premium Nail - - - - - - Treatments/Strengthener - Nail Treatments/ - - - - - - Strengthener -- Mass Nail Polish 94.4 110.6 131.8 119.4 92.5 100.8 -- Premium Nail Polish - - - - - - - Nail Polish 94.4 110.6 131.8 119.4 92.5 100.8 Nail Products 105.9 124.0 147.3 133.2 103.1 112.5 -- Mass Other Lip 5.6 6.5 9.1 7.3 6.2 6.7 Products -- Premium Other Lip 4.6 4.8 5.9 4.6 3.5 3.7 Products - Other Lip Products 10.2 11.2 14.9 11.8 9.7 10.5 -- Mass Lipstick 326.9 379.6 464.9 375.3 342.9 367.1 -- Premium Lipstick 526.4 604.7 668.6 547.4 481.3 512.7 - Lipstick 853.3 984.4 1,133.5 922.7 824.2 879.8 -- Mass Lip Liner/Pencil 50.8 56.6 67.1 54.5 48.6 52.5 -- Premium Lip Liner/ 39.4 40.9 43.0 34.0 29.3 31.7
  37. B E A U T Y A N D P

    E R S O N A L C A R E I N V I E T N A M P a s s p o r t 30 © E u r o m o n i t o r I n t e r n a t i o n a l Pencil - Lip Liner/Pencil 90.1 97.5 110.1 88.6 77.9 84.1 -- Mass Lip Gloss 28.2 30.9 35.2 29.2 25.5 27.2 -- Premium Lip Gloss 39.3 40.1 41.5 32.8 28.8 30.6 - Lip Gloss 67.5 70.9 76.7 62.0 54.2 57.8 Lip Products 1,021.2 1,164.0 1,335.2 1,085.0 966.1 1,032.2 -- Mass Other Facial - - - - - - Make-Up -- Premium Other Facial - - - - - - Make-Up - Other Facial Make-Up - - - - - - -- Mass Powder 196.3 231.0 271.5 244.3 217.4 234.8 -- Premium Powder 166.8 190.9 213.6 179.3 161.2 171.5 - Powder 363.1 421.9 485.0 423.5 378.5 406.3 -- Mass Foundation/ 239.5 274.4 316.7 273.3 243.1 262.4 Concealer -- Premium Foundation/ 203.6 224.0 240.7 197.8 169.0 181.9 Concealer - Foundation/Concealer 443.1 498.4 557.4 471.1 412.1 444.2 -- Mass Blusher/Bronzer/ 64.6 74.3 85.7 72.5 64.5 69.9 Highlighter -- Premium Blusher/ 54.9 60.9 66.1 53.1 45.9 49.6 Bronzer/Highlighter - Blusher/Bronzer/ 119.5 135.3 151.8 125.7 110.4 119.5 Highlighter -- Mass BB/CC Creams 181.2 227.4 284.2 250.2 226.8 243.0 -- Premium BB/CC Creams 174.0 186.3 216.0 177.5 164.3 176.3 - BB/CC Creams 355.1 413.7 500.2 427.7 391.1 419.3 Facial Make-Up 1,280.8 1,469.2 1,694.4 1,447.9 1,292.2 1,389.3 -- Mass Other Lash and - - - - - - Brow Make-Up -- Premium Other Lash - - - - - - and Brow Make-Up - Other Lash and Brow - - - - - - Make-Up -- Mass Mascara 59.8 68.0 77.6 66.2 59.6 63.9 -- Premium Mascara 41.4 43.2 45.3 35.1 30.7 32.2 - Mascara 101.2 111.2 122.8 101.3 90.3 96.1 -- Mass Eye Shadow 62.9 71.4 81.3 68.9 61.3 65.6 -- Premium Eye Shadow 42.3 43.8 46.2 35.4 30.6 32.2 - Eye Shadow 105.2 115.2 127.4 104.3 91.9 97.8 -- Mass Eye Liner/Pencil 180.0 208.6 242.4 206.7 186.8 198.5 -- Premium Eye Liner/ 121.2 127.1 134.4 104.9 91.3 96.4 Pencil - Eye Liner/Pencil 301.2 335.7 376.8 311.6 278.2 294.9 Eye Make-Up 507.6 562.1 627.0 517.1 460.4 488.7 Colour Cosmetics 2,951.1 3,364.7 3,859.3 3,230.4 2,862.2 3,066.2 Source: Euromonitor International from official statistics, trade associations, trade press, company research, store checks, trade interviews, trade sources Table 30 Sales of Colour Cosmetics by Category: % Value Growth 2017-2022 % current value growth 2021/22 2017-22 CAGR 2017/22 Total - Mass Colour Cosmetics Sets/Kits 7.2 4.9 27.3 - Premium Colour Cosmetics Sets/Kits 9.8 -4.8 -22.0 Colour Cosmetics Sets/Kits 7.4 4.0 22.0 -- Mass Other Nail Products - - -
  38. B E A U T Y A N D P

    E R S O N A L C A R E I N V I E T N A M P a s s p o r t 31 © E u r o m o n i t o r I n t e r n a t i o n a l -- Premium Other Nail Products - - - - Other Nail Products - - - -- Mass Polish Remover 10.0 0.3 1.4 -- Premium Polish Remover - - - - Polish Remover 10.0 0.3 1.4 -- Mass Nail Treatments/Strengthener - - - -- Premium Nail Treatments/Strengthener - - - - Nail Treatments/Strengthener - - - -- Mass Nail Polish 9.0 1.3 6.8 -- Premium Nail Polish - - - - Nail Polish 9.0 1.3 6.8 Nail Products 9.1 1.2 6.2 -- Mass Other Lip Products 8.3 3.7 20.1 -- Premium Other Lip Products 5.9 -4.2 -19.1 - Other Lip Products 7.4 0.5 2.4 -- Mass Lipstick 7.1 2.3 12.3 -- Premium Lipstick 6.5 -0.5 -2.6 - Lipstick 6.7 0.6 3.1 -- Mass Lip Liner/Pencil 7.9 0.7 3.3 -- Premium Lip Liner/Pencil 8.0 -4.3 -19.6 - Lip Liner/Pencil 7.9 -1.4 -6.7 -- Mass Lip Gloss 6.9 -0.7 -3.7 -- Premium Lip Gloss 6.5 -4.8 -22.0 - Lip Gloss 6.7 -3.0 -14.3 Lip Products 6.8 0.2 1.1 -- Mass Other Facial Make-Up - - - -- Premium Other Facial Make-Up - - - - Other Facial Make-Up - - - -- Mass Powder 8.0 3.7 19.6 -- Premium Powder 6.4 0.6 2.8 - Powder 7.3 2.3 11.9 -- Mass Foundation/Concealer 7.9 1.8 9.5 -- Premium Foundation/Concealer 7.6 -2.2 -10.7 - Foundation/Concealer 7.8 0.1 0.3 -- Mass Blusher/Bronzer/Highlighter 8.4 1.6 8.2 -- Premium Blusher/Bronzer/Highlighter 8.0 -2.0 -9.6 - Blusher/Bronzer/Highlighter 8.2 0.0 0.0 -- Mass BB/CC Creams 7.1 6.0 34.1 -- Premium BB/CC Creams 7.3 0.3 1.3 - BB/CC Creams 7.2 3.4 18.1 Facial Make-Up 7.5 1.6 8.5 -- Mass Other Lash and Brow Make-Up - - - -- Premium Other Lash and Brow Make-Up - - - - Other Lash and Brow Make-Up - - - -- Mass Mascara 7.2 1.3 6.9 -- Premium Mascara 4.9 -4.9 -22.3 - Mascara 6.4 -1.0 -5.1 -- Mass Eye Shadow 7.0 0.8 4.3 -- Premium Eye Shadow 5.3 -5.3 -23.9 - Eye Shadow 6.4 -1.4 -7.0 -- Mass Eye Liner/Pencil 6.2 2.0 10.3 -- Premium Eye Liner/Pencil 5.5 -4.5 -20.5 - Eye Liner/Pencil 6.0 -0.4 -2.1 Eye Make-Up 6.2 -0.8 -3.7 Colour Cosmetics 7.1 0.8 3.9 Source: Euromonitor International from official statistics, trade associations, trade press, company research, store checks, trade interviews, trade sources Table 31 NBO Company Shares of Colour Cosmetics: % Value 2018-2022
  39. B E A U T Y A N D P

    E R S O N A L C A R E I N V I E T N A M P a s s p o r t 32 © E u r o m o n i t o r I n t e r n a t i o n a l % retail value rsp Company 2018 2019 2020 2021 2022 L'Oréal Vietnam Co Ltd 15.0 15.0 15.3 15.6 18.0 LG Vina Cosmetics Co Ltd 13.1 12.4 13.7 14.2 14.7 Estée Lauder Vietnam Co Ltd 14.3 13.9 13.6 13.6 13.4 Shiseido Cosmetics 13.1 11.8 11.3 11.1 11.3 Vietnam Co Ltd AmorePacific Vietnam JSC 5.0 5.5 6.8 6.7 7.5 Chanel SA 5.1 5.2 5.1 5.2 5.1 Revlon Inc 4.6 4.3 4.4 4.3 4.4 MOI Cosmetics Co Ltd 0.9 1.9 2.8 2.6 3.2 Christian Dior SA, Parfums 1.7 1.7 1.6 1.7 1.6 Oriflame Vietnam Ltd - - 2.4 1.5 1.5 Nippon Menard Cosmetic Co 1.4 1.3 1.3 1.2 1.2 Ltd Make Up For Ever Co Ltd 1.3 1.1 1.0 1.0 1.0 Bourjois SA 0.9 0.8 0.9 0.9 0.9 Unilever Vietnam 0.7 0.6 0.6 0.6 0.6 International Co Ltd Clarins SA 0.7 0.6 0.6 0.6 0.6 Kanebo Cosmetics Inc 0.5 0.5 0.5 0.5 0.5 Yves Rocher SA 0.4 0.4 0.4 0.4 0.4 Body Shop (Vietnam) Co 0.3 0.3 0.4 0.4 0.4 Ltd, The International Minh Viet 0.3 0.3 0.3 0.2 0.3 Co Ltd Saigon Cosmetics Corp 0.3 0.2 0.2 0.2 0.2 Etude Corp 0.2 0.2 0.2 0.2 0.2 Naris Cosmetics Co Ltd 0.2 0.2 0.2 0.2 0.2 Missha Vietnam Co Ltd 0.1 0.1 0.1 0.1 0.1 Thuong Xuan Cosmetic Co Ltd 3.8 3.8 - - - Avon Cosmetics Vietnam Ltd - - - - - Others 16.1 17.8 16.3 17.0 12.6 Total 100.0 100.0 100.0 100.0 100.0 Source: Euromonitor International from official statistics, trade associations, trade press, company research, store checks, trade interviews, trade sources Table 32 LBN Brand Shares of Colour Cosmetics: % Value 2019-2022 % retail value rsp Brand (GBO) Company (NBO) 2019 2020 2021 2022 Maybelline New York L'Oréal Vietnam Co Ltd 9.3 9.6 9.8 11.7 (L'Oréal Groupe) The Face Shop (LG LG Vina Cosmetics Co Ltd 9.0 10.4 10.8 11.3 Household & Health Care Ltd) Shiseido (Shiseido Co Shiseido Cosmetics 9.2 8.6 8.4 8.4 Ltd) Vietnam Co Ltd Mac (Estée Lauder Cos Estée Lauder Vietnam Co Ltd 8.5 8.4 8.3 8.2 Inc) Innisfree AmorePacific Vietnam JSC 3.5 4.4 4.4 5.1 (AmorePacific Corp) Chanel Chanel SA 5.2 5.1 5.2 5.1 Revlon Revlon Inc 4.3 4.4 4.3 4.4 M.O.I MOI Cosmetics Co Ltd 1.9 2.8 2.6 3.2 Shu Uemura (L'Oréal L'Oréal Vietnam Co Ltd 2.3 2.3 2.4 2.5
  40. B E A U T Y A N D P

    E R S O N A L C A R E I N V I E T N A M P a s s p o r t 33 © E u r o m o n i t o r I n t e r n a t i o n a l Groupe) Za (Shiseido Co Ltd) Shiseido Cosmetics 2.0 2.0 2.0 2.1 Vietnam Co Ltd L'Oréal Paris L'Oréal Vietnam Co Ltd 1.7 1.7 1.8 2.0 (L'Oréal Groupe) Clinique (Estée Estée Lauder Vietnam Co Ltd 2.1 2.0 2.0 2.0 Lauder Cos Inc) Bobbi Brown (Estée Estée Lauder Vietnam Co Ltd 2.0 1.9 1.9 1.9 Lauder Cos Inc) Lacvert Essance (LG LG Vina Cosmetics Co Ltd 1.8 1.8 1.8 1.9 Household & Health Care Ltd) Lancôme (L'Oréal L'Oréal Vietnam Co Ltd 1.7 1.7 1.7 1.9 Groupe) Dior (LVMH Moët Christian Dior SA, Parfums 1.7 1.6 1.7 1.6 Hennessy Louis Vuitton SA) Laneíge (AmorePacific AmorePacific Vietnam JSC 1.4 1.6 1.6 1.6 Corp) Oriflame (Oriflame Oriflame Vietnam Ltd - 2.4 1.5 1.5 Cosmetics SA) O HUI (LG Household & LG Vina Cosmetics Co Ltd 1.4 1.3 1.3 1.3 Health Care Ltd) Estée Lauder (Estée Estée Lauder Vietnam Co Ltd 1.4 1.3 1.3 1.3 Lauder Cos Inc) Menard Nippon Menard Cosmetic Co 1.3 1.3 1.2 1.2 Ltd Make Up For Ever Make Up For Ever Co Ltd 1.1 1.0 1.0 1.0 (LVMH Moët Hennessy Louis Vuitton SA) Bourjois (Coty Inc) Bourjois SA 0.8 0.9 0.9 0.9 Nars (Shiseido Co Ltd) Shiseido Cosmetics 0.7 0.8 0.8 0.8 Vietnam Co Ltd Pond's (Unilever Group) Unilever Vietnam 0.6 0.6 0.6 0.6 International Co Ltd Clarins Clarins SA 0.6 0.6 0.6 0.6 Sulwhasoo AmorePacific Vietnam JSC 0.6 0.6 0.5 0.6 (AmorePacific Corp) Kanebo (Kao Corp) Kanebo Cosmetics Inc 0.5 0.5 0.5 0.5 Yves Rocher Yves Rocher SA 0.4 0.4 0.4 0.4 The Body Shop Body Shop (Vietnam) Co 0.3 0.4 0.4 0.4 (Natura&Co) Ltd, The Oriflame (Oriflame Thuong Xuan Cosmetic Co Ltd 3.8 - - - Cosmetics SA) Others Others 19.0 17.7 18.3 14.0 Total Total 100.0 100.0 100.0 100.0 Source: Euromonitor International from official statistics, trade associations, trade press, company research, store checks, trade interviews, trade sources Table 33 LBN Brand Shares of Eye Make-up: % Value 2019-2022 % retail value rsp Brand (GBO) Company (NBO) 2019 2020 2021 2022 Maybelline New York L'Oréal Vietnam Co Ltd 10.9 11.7 11.8 13.2 (L'Oréal Groupe) Shiseido (Shiseido Co Shiseido Cosmetics 9.7 8.8 8.4 8.1 Ltd) Vietnam Co Ltd Revlon Revlon Inc 5.2 5.4 5.3 5.4
  41. B E A U T Y A N D P

    E R S O N A L C A R E I N V I E T N A M P a s s p o r t 34 © E u r o m o n i t o r I n t e r n a t i o n a l The Face Shop (LG LG Vina Cosmetics Co Ltd 4.3 5.0 5.2 5.0 Household & Health Care Ltd) Chanel Chanel SA 4.8 4.6 4.6 4.8 Dior (LVMH Moët Christian Dior SA, Parfums 3.8 3.6 3.6 3.7 Hennessy Louis Vuitton SA) Mac (Estée Lauder Cos Estée Lauder Vietnam Co Ltd 3.2 3.1 3.1 3.1 Inc) Za (Shiseido Co Ltd) Shiseido Cosmetics 2.1 2.4 2.2 2.4 Vietnam Co Ltd Innisfree AmorePacific Vietnam JSC 1.7 2.1 2.1 2.2 (AmorePacific Corp) Oriflame (Oriflame Oriflame Vietnam Ltd - 3.0 1.9 2.0 Cosmetics SA) Menard Nippon Menard Cosmetic Co 2.1 1.9 1.8 1.8 Ltd VOV Eye (LG Household LG Vina Cosmetics Co Ltd 1.2 1.2 1.2 1.4 & Health Care Ltd) Make Up For Ever Make Up For Ever Co Ltd 1.6 1.4 1.3 1.3 (LVMH Moët Hennessy Louis Vuitton SA) Estée Lauder (Estée Estée Lauder Vietnam Co Ltd 1.2 1.1 1.1 1.0 Lauder Cos Inc) M.O.I MOI Cosmetics Co Ltd 0.7 1.0 0.9 1.0 Nars (Shiseido Co Ltd) Shiseido Cosmetics 1.0 0.9 0.9 1.0 Vietnam Co Ltd Naris Naris Cosmetics Co Ltd 1.1 1.0 1.0 1.0 Bobbi Brown (Estée Estée Lauder Vietnam Co Ltd 0.9 0.9 0.8 0.9 Lauder Cos Inc) Lancôme (L'Oréal L'Oréal Vietnam Co Ltd 0.8 0.8 0.8 0.9 Groupe) Clarins Clarins SA 0.9 0.8 0.8 0.9 Shu Uemura (L'Oréal L'Oréal Vietnam Co Ltd 0.7 0.7 0.7 0.9 Groupe) L'Oréal Paris L'Oréal Vietnam Co Ltd 0.8 0.9 0.9 0.9 (L'Oréal Groupe) Clinique (Estée Estée Lauder Vietnam Co Ltd 0.9 0.8 0.8 0.8 Lauder Cos Inc) Lacvert Essance (LG LG Vina Cosmetics Co Ltd 0.6 0.7 0.7 0.8 Household & Health Care Ltd) Etude (AmorePacific Etude Corp 0.4 0.5 0.5 0.6 Corp) The Body Shop Body Shop (Vietnam) Co 0.3 0.4 0.4 0.4 (Natura&Co) Ltd, The Oriflame (Oriflame Thuong Xuan Cosmetic Co Ltd 4.8 - - - Cosmetics SA) Avon Colour (Avon Avon Cosmetics Vietnam Ltd - - - - Products Inc) The Body Shop Body Shop (Vietnam) Co - - - - (L'Oréal Groupe) Ltd, The Others Others 34.4 35.3 37.3 34.7 Total Total 100.0 100.0 100.0 100.0 Source: Euromonitor International from official statistics, trade associations, trade press, company research, store checks, trade interviews, trade sources Table 34 LBN Brand Shares of Facial Make-up: % Value 2019-2022
  42. B E A U T Y A N D P

    E R S O N A L C A R E I N V I E T N A M P a s s p o r t 35 © E u r o m o n i t o r I n t e r n a t i o n a l % retail value rsp Brand (GBO) Company (NBO) 2019 2020 2021 2022 The Face Shop (LG LG Vina Cosmetics Co Ltd 13.6 15.6 16.5 17.3 Household & Health Care Ltd) Maybelline New York L'Oréal Vietnam Co Ltd 6.9 6.8 7.0 10.0 (L'Oréal Groupe) Shiseido (Shiseido Co Shiseido Cosmetics 9.9 9.5 9.4 9.5 Ltd) Vietnam Co Ltd Innisfree AmorePacific Vietnam JSC 5.3 6.8 7.0 8.2 (AmorePacific Corp) Mac (Estée Lauder Cos Estée Lauder Vietnam Co Ltd 5.5 5.2 5.3 5.1 Inc) Chanel Chanel SA 4.2 4.0 4.0 3.8 Revlon Revlon Inc 3.5 3.5 3.5 3.6 Clinique (Estée Estée Lauder Vietnam Co Ltd 3.3 3.0 3.1 3.0 Lauder Cos Inc) Lacvert Essance (LG LG Vina Cosmetics Co Ltd 2.7 2.7 2.8 2.8 Household & Health Care Ltd) O HUI (LG Household & LG Vina Cosmetics Co Ltd 2.6 2.4 2.4 2.4 Health Care Ltd) Oriflame (Oriflame Oriflame Vietnam Ltd - 3.3 2.1 2.1 Cosmetics SA) Za (Shiseido Co Ltd) Shiseido Cosmetics 2.0 2.0 2.0 2.1 Vietnam Co Ltd L'Oréal Paris L'Oréal Vietnam Co Ltd 1.7 1.7 1.7 1.9 (L'Oréal Groupe) Laneíge (AmorePacific AmorePacific Vietnam JSC 1.8 1.9 1.9 1.9 Corp) Lancôme (L'Oréal L'Oréal Vietnam Co Ltd 1.8 1.8 1.9 1.9 Groupe) Bobbi Brown (Estée Estée Lauder Vietnam Co Ltd 1.7 1.6 1.6 1.7 Lauder Cos Inc) Shu Uemura (L'Oréal L'Oréal Vietnam Co Ltd 1.3 1.3 1.4 1.5 Groupe) Menard Nippon Menard Cosmetic Co 1.4 1.4 1.3 1.4 Ltd Pond's BB+Cream Unilever Vietnam 1.4 1.4 1.4 1.4 (Unilever Group) International Co Ltd M.O.I MOI Cosmetics Co Ltd 1.0 1.4 1.2 1.2 Make Up For Ever Make Up For Ever Co Ltd 1.2 1.2 1.1 1.2 (LVMH Moët Hennessy Louis Vuitton SA) Estée Lauder (Estée Estée Lauder Vietnam Co Ltd 1.1 1.1 1.1 1.1 Lauder Cos Inc) Dior (LVMH Moët Christian Dior SA, Parfums 1.0 1.0 1.0 1.0 Hennessy Louis Vuitton SA) Nars (Shiseido Co Ltd) Shiseido Cosmetics 0.8 0.8 0.8 0.9 Vietnam Co Ltd Sulwhasoo BB/CC cream AmorePacific Vietnam JSC 0.7 0.8 0.7 0.7 (AmorePacific Corp) Kaila International Minh Viet 0.7 0.7 0.5 0.6 Co Ltd Kanebo (Kao Corp) Kanebo Cosmetics Inc 0.5 0.5 0.5 0.5 Sulwhasoo Foundation AmorePacific Vietnam JSC 0.6 0.6 0.5 0.5 (AmorePacific Corp) The Body Shop Body Shop (Vietnam) Co 0.3 0.4 0.4 0.4 (Natura&Co) Ltd, The
  43. B E A U T Y A N D P

    E R S O N A L C A R E I N V I E T N A M P a s s p o r t 36 © E u r o m o n i t o r I n t e r n a t i o n a l Mamonde (AmorePacific AmorePacific Vietnam JSC - 0.2 0.2 0.2 Corp) Oriflame (Oriflame Thuong Xuan Cosmetic Co Ltd 5.4 - - - Cosmetics SA) Others Others 16.2 15.3 15.4 10.0 Total Total 100.0 100.0 100.0 100.0 Source: Euromonitor International from official statistics, trade associations, trade press, company research, store checks, trade interviews, trade sources Table 35 LBN Brand Shares of Lip Products: % Value 2019-2022 % retail value rsp Brand (GBO) Company (NBO) 2019 2020 2021 2022 Mac (Estée Lauder Cos Estée Lauder Vietnam Co Ltd 16.0 16.6 16.2 16.0 Inc) Maybelline New York L'Oréal Vietnam Co Ltd 12.1 12.8 12.9 13.8 (L'Oréal Groupe) Shiseido (Shiseido Co Shiseido Cosmetics 9.3 8.6 8.2 8.3 Ltd) Vietnam Co Ltd Chanel Chanel SA 7.6 7.6 7.9 7.8 M.O.I MOI Cosmetics Co Ltd 4.0 6.0 5.7 7.4 Shu Uemura (L'Oréal L'Oréal Vietnam Co Ltd 4.6 4.8 4.8 4.9 Groupe) Revlon Revlon Inc 4.3 4.5 4.4 4.3 The Face Shop (LG LG Vina Cosmetics Co Ltd 2.9 3.4 3.4 3.4 Household & Health Care Ltd) Bobbi Brown (Estée Estée Lauder Vietnam Co Ltd 3.1 3.2 3.1 3.0 Lauder Cos Inc) L'Oréal Paris L'Oréal Vietnam Co Ltd 2.3 2.4 2.5 2.9 (L'Oréal Groupe) Lancôme (L'Oréal L'Oréal Vietnam Co Ltd 2.3 2.2 2.2 2.6 Groupe) Bourjois (Coty Inc) Bourjois SA 2.1 2.3 2.4 2.3 Laneíge (AmorePacific AmorePacific Vietnam JSC 1.9 2.0 2.0 2.2 Corp) Za (Shiseido Co Ltd) Shiseido Cosmetics 2.1 2.2 2.2 2.2 Vietnam Co Ltd Estée Lauder (Estée Estée Lauder Vietnam Co Ltd 2.1 2.0 1.9 1.9 Lauder Cos Inc) Dior (LVMH Moët Christian Dior SA, Parfums 1.8 1.8 1.8 1.8 Hennessy Louis Vuitton SA) Innisfree AmorePacific Vietnam JSC 1.1 1.4 1.4 1.5 (AmorePacific Corp) Lacvert Essance (LG LG Vina Cosmetics Co Ltd 1.4 1.3 1.4 1.4 Household & Health Care Ltd) Clarins Clarins SA 1.4 1.5 1.4 1.4 Clinique (Estée Estée Lauder Vietnam Co Ltd 1.5 1.4 1.4 1.4 Lauder Cos Inc) Couleurs Nature Yves Rocher SA 1.2 1.3 1.3 1.3 Menard Nippon Menard Cosmetic Co 1.0 1.0 1.0 1.0 Ltd Make Up For Ever Make Up For Ever Co Ltd 0.8 0.8 0.7 0.8 (LVMH Moët Hennessy Louis Vuitton SA) Nars (Shiseido Co Ltd) Shiseido Cosmetics 0.7 0.7 0.7 0.7
  44. B E A U T Y A N D P

    E R S O N A L C A R E I N V I E T N A M P a s s p o r t 37 © E u r o m o n i t o r I n t e r n a t i o n a l Vietnam Co Ltd Kanebo (Kao Corp) Kanebo Cosmetics Inc 0.8 0.7 0.7 0.7 O HUI (LG Household & LG Vina Cosmetics Co Ltd 0.7 0.7 0.7 0.7 Health Care Ltd) Oriflame (Oriflame Oriflame Vietnam Ltd - 1.0 0.6 0.6 Cosmetics SA) The Body Shop Body Shop (Vietnam) Co 0.4 0.5 0.5 0.5 (Natura&Co) Ltd, The Mamonde (AmorePacific AmorePacific Vietnam JSC - 0.3 0.2 0.3 Corp) Etude (AmorePacific Etude Corp 0.2 0.2 0.2 0.2 Corp) Oriflame (Oriflame Thuong Xuan Cosmetic Co Ltd 1.5 - - - Cosmetics SA) Others Others 8.9 5.0 6.1 2.6 Total Total 100.0 100.0 100.0 100.0 Source: Euromonitor International from official statistics, trade associations, trade press, company research, store checks, trade interviews, trade sources Table 36 LBN Brand Shares of Nail Products: % Value 2019-2022 % retail value rsp Brand (GBO) Company (NBO) 2019 2020 2021 2022 The Face Shop (LG LG Vina Cosmetics Co Ltd 34.2 35.4 38.8 40.5 Household & Health Care Ltd) Innisfree AmorePacific Vietnam JSC 13.1 12.4 11.2 16.0 (AmorePacific Corp) Revlon Revlon Inc 10.9 11.0 10.0 11.2 Maybelline New York L'Oréal Vietnam Co Ltd 9.3 9.5 9.2 10.4 (L'Oréal Groupe) Saigon Saigon Cosmetics Corp 4.8 4.9 4.5 4.9 Bourjois (Coty Inc) Bourjois SA 3.2 3.2 2.9 2.8 Oriflame (Oriflame Oriflame Vietnam Ltd - 1.4 1.0 2.0 Cosmetics SA) Oriflame (Oriflame Thuong Xuan Cosmetic Co Ltd 2.4 - - - Cosmetics SA) Bourjois (Chanel SA) Bourjois SA - - - - L'Oréal Paris L'Oréal Vietnam Co Ltd - - - - (L'Oréal Groupe) Others Others 22.1 22.3 22.5 12.3 Total Total 100.0 100.0 100.0 100.0 Source: Euromonitor International from official statistics, trade associations, trade press, company research, store checks, trade interviews, trade sources Table 37 LBN Brand Shares of Premium Colour Cosmetics: % Value 2019-2022 % retail value rsp Brand (GBO) Company (NBO) 2019 2020 2021 2022 Shiseido (Shiseido Co Shiseido Cosmetics 20.5 19.7 19.3 19.5 Ltd) Vietnam Co Ltd Mac (Estée Lauder Cos Estée Lauder Vietnam Co Ltd 19.0 19.2 19.2 19.0 Inc) Chanel Chanel SA 11.7 11.7 12.0 11.9 Shu Uemura (L'Oréal L'Oréal Vietnam Co Ltd 5.1 5.3 5.5 5.8
  45. B E A U T Y A N D P

    E R S O N A L C A R E I N V I E T N A M P a s s p o r t 38 © E u r o m o n i t o r I n t e r n a t i o n a l Groupe) Clinique (Estée Estée Lauder Vietnam Co Ltd 4.6 4.6 4.7 4.5 Lauder Cos Inc) Bobbi Brown (Estée Estée Lauder Vietnam Co Ltd 4.4 4.4 4.5 4.5 Lauder Cos Inc) Lancôme (L'Oréal L'Oréal Vietnam Co Ltd 3.8 3.9 4.0 4.3 Groupe) Dior (LVMH Moët Christian Dior SA, Parfums 3.7 3.8 3.8 3.8 Hennessy Louis Vuitton SA) Laneíge (AmorePacific AmorePacific Vietnam JSC 3.2 3.6 3.6 3.8 Corp) O HUI (LG Household & LG Vina Cosmetics Co Ltd 3.1 3.1 3.0 3.0 Health Care Ltd) Estée Lauder (Estée Estée Lauder Vietnam Co Ltd 3.1 3.1 3.0 3.0 Lauder Cos Inc) Make Up For Ever Make Up For Ever Co Ltd 2.4 2.3 2.2 2.4 (LVMH Moët Hennessy Louis Vuitton SA) Menard Nippon Menard Cosmetic Co 2.2 2.1 2.1 2.1 Ltd Nars (Shiseido Co Ltd) Shiseido Cosmetics 1.7 1.7 1.8 1.9 Vietnam Co Ltd Clarins Clarins SA 1.4 1.4 1.4 1.4 Kanebo (Kao Corp) Kanebo Cosmetics Inc 1.1 1.1 1.1 1.1 Sulwhasoo BB/CC cream AmorePacific Vietnam JSC 0.7 0.8 0.7 0.8 (AmorePacific Corp) Sulwhasoo Foundation AmorePacific Vietnam JSC 0.6 0.6 0.6 0.5 (AmorePacific Corp) Naris Naris Cosmetics Co Ltd 0.4 0.4 0.4 0.4 Others Others 7.4 7.3 7.2 6.3 Total Total 100.0 100.0 100.0 100.0 Source: Euromonitor International from official statistics, trade associations, trade press, company research, store checks, trade interviews, trade sources Table 38 Forecast Sales of Colour Cosmetics by Category: Value 2022-2027 VND billion 2022 2023 2024 2025 2026 2027 - Mass Colour Cosmetics 40.5 42.3 44.5 46.9 49.5 52.3 Sets/Kits - Premium Colour 3.0 3.2 3.5 3.8 4.1 4.5 Cosmetics Sets/Kits Colour Cosmetics Sets/ 43.5 45.6 48.0 50.7 53.7 56.8 Kits -- Mass Other Nail - - - - - - Products -- Premium Other Nail - - - - - - Products - Other Nail Products - - - - - - -- Mass Polish Remover 11.7 12.5 13.3 14.3 15.3 16.4 -- Premium Polish Remover - - - - - - - Polish Remover 11.7 12.5 13.3 14.3 15.3 16.4 -- Mass Nail Treatments/ - - - - - - Strengthener -- Premium Nail - - - - - - Treatments/Strengthener - Nail Treatments/ - - - - - -
  46. B E A U T Y A N D P

    E R S O N A L C A R E I N V I E T N A M P a s s p o r t 39 © E u r o m o n i t o r I n t e r n a t i o n a l Strengthener -- Mass Nail Polish 100.8 105.8 110.9 115.3 119.6 123.5 -- Premium Nail Polish - - - - - - - Nail Polish 100.8 105.8 110.9 115.3 119.6 123.5 Nail Products 112.5 118.3 124.2 129.5 134.8 139.9 -- Mass Other Lip 6.7 7.1 7.5 8.1 8.7 9.4 Products -- Premium Other Lip 3.7 3.9 4.0 4.3 4.5 4.9 Products - Other Lip Products 10.5 10.9 11.5 12.3 13.2 14.2 -- Mass Lipstick 367.1 386.6 409.0 434.8 465.9 504.4 -- Premium Lipstick 512.7 538.5 564.2 589.7 615.8 642.3 - Lipstick 879.8 925.1 973.3 1,024.4 1,081.7 1,146.7 -- Mass Lip Liner/Pencil 52.5 54.8 57.7 61.2 65.7 71.1 -- Premium Lip Liner/ 31.7 33.4 35.6 38.0 40.6 43.3 Pencil - Lip Liner/Pencil 84.1 88.2 93.3 99.3 106.2 114.4 -- Mass Lip Gloss 27.2 28.2 29.3 30.6 32.2 34.3 -- Premium Lip Gloss 30.6 32.3 34.4 36.7 39.5 42.8 - Lip Gloss 57.8 60.5 63.7 67.3 71.7 77.1 Lip Products 1,032.2 1,084.6 1,141.9 1,203.4 1,272.9 1,352.5 -- Mass Other Facial - - - - - - Make-Up -- Premium Other Facial - - - - - - Make-Up - Other Facial Make-Up - - - - - - -- Mass Powder 234.8 251.2 268.5 286.2 304.5 323.3 -- Premium Powder 171.5 177.8 187.9 199.7 213.8 229.6 - Powder 406.3 429.1 456.5 485.9 518.3 552.8 -- Mass Foundation/ 262.4 277.0 295.3 317.7 343.8 375.3 Concealer -- Premium Foundation/ 181.9 189.6 197.9 207.5 219.1 235.6 Concealer - Foundation/Concealer 444.2 466.6 493.2 525.2 562.9 610.8 -- Mass Blusher/Bronzer/ 69.9 76.1 83.1 91.0 99.9 109.9 Highlighter -- Premium Blusher/ 49.6 52.3 55.6 59.6 64.6 70.3 Bronzer/Highlighter - Blusher/Bronzer/ 119.5 128.4 138.7 150.6 164.5 180.2 Highlighter -- Mass BB/CC Creams 243.0 262.5 284.4 309.4 340.2 376.1 -- Premium BB/CC Creams 176.3 189.4 204.3 220.7 241.2 264.8 - BB/CC Creams 419.3 451.9 488.7 530.2 581.4 640.9 Facial Make-Up 1,389.3 1,476.0 1,577.0 1,691.9 1,827.2 1,984.7 -- Mass Other Lash and - - - - - - Brow Make-Up -- Premium Other Lash - - - - - - and Brow Make-Up - Other Lash and Brow - - - - - - Make-Up -- Mass Mascara 63.9 69.6 76.5 84.6 93.8 103.9 -- Premium Mascara 32.2 34.2 36.4 38.9 41.9 45.4 - Mascara 96.1 103.8 112.9 123.6 135.8 149.3 -- Mass Eye Shadow 65.6 70.0 74.9 80.5 87.3 95.3 -- Premium Eye Shadow 32.2 33.6 35.6 38.0 40.8 44.0 - Eye Shadow 97.8 103.6 110.5 118.5 128.2 139.4 -- Mass Eye Liner/Pencil 198.5 203.9 210.2 217.0 225.6 234.9 -- Premium Eye Liner/ 96.4 101.9 108.8 116.9 125.9 137.0 Pencil - Eye Liner/Pencil 294.9 305.9 319.0 334.0 351.5 371.9 Eye Make-Up 488.7 513.3 542.4 576.1 615.4 660.6
  47. B E A U T Y A N D P

    E R S O N A L C A R E I N V I E T N A M P a s s p o r t 40 © E u r o m o n i t o r I n t e r n a t i o n a l Colour Cosmetics 3,066.2 3,237.9 3,433.4 3,651.5 3,904.0 4,194.4 Source: Euromonitor International from trade associations, trade press, company research, trade interviews, trade sources Table 39 Forecast Sales of Colour Cosmetics by Category: % Value Growth 2022-2027 % constant value growth 2022/2023 2022-27 CAGR 2022/27 Total - Mass Colour Cosmetics Sets/Kits 4.6 5.2 29.1 - Premium Colour Cosmetics Sets/Kits 7.4 8.3 49.1 Colour Cosmetics Sets/Kits 4.7 5.5 30.5 -- Mass Other Nail Products - - - -- Premium Other Nail Products - - - - Other Nail Products - - - -- Mass Polish Remover 6.6 6.9 39.9 -- Premium Polish Remover - - - - Polish Remover 6.6 6.9 39.9 -- Mass Nail Treatments/Strengthener - - - -- Premium Nail Treatments/Strengthener - - - - Nail Treatments/Strengthener - - - -- Mass Nail Polish 5.0 4.1 22.5 -- Premium Nail Polish - - - - Nail Polish 5.0 4.1 22.5 Nail Products 5.2 4.4 24.3 -- Mass Other Lip Products 5.0 6.9 39.8 -- Premium Other Lip Products 3.8 5.4 29.9 - Other Lip Products 4.6 6.4 36.2 -- Mass Lipstick 5.3 6.6 37.4 -- Premium Lipstick 5.0 4.6 25.3 - Lipstick 5.1 5.4 30.3 -- Mass Lip Liner/Pencil 4.5 6.3 35.6 -- Premium Lip Liner/Pencil 5.3 6.5 36.7 - Lip Liner/Pencil 4.8 6.3 36.0 -- Mass Lip Gloss 3.6 4.8 26.2 -- Premium Lip Gloss 5.4 6.9 39.6 - Lip Gloss 4.5 5.9 33.3 Lip Products 5.1 5.6 31.0 -- Mass Other Facial Make-Up - - - -- Premium Other Facial Make-Up - - - - Other Facial Make-Up - - - -- Mass Powder 7.0 6.6 37.7 -- Premium Powder 3.7 6.0 33.8 - Powder 5.6 6.4 36.1 -- Mass Foundation/Concealer 5.6 7.4 43.0 -- Premium Foundation/Concealer 4.3 5.3 29.5 - Foundation/Concealer 5.0 6.6 37.5 -- Mass Blusher/Bronzer/Highlighter 8.9 9.5 57.2 -- Premium Blusher/Bronzer/Highlighter 5.5 7.2 41.8 - Blusher/Bronzer/Highlighter 7.5 8.6 50.8 -- Mass BB/CC Creams 8.0 9.1 54.8 -- Premium BB/CC Creams 7.5 8.5 50.2 - BB/CC Creams 7.8 8.9 52.9 Facial Make-Up 6.2 7.4 42.9 -- Mass Other Lash and Brow Make-Up - - - -- Premium Other Lash and Brow Make-Up - - - - Other Lash and Brow Make-Up - - - -- Mass Mascara 8.9 10.2 62.7 -- Premium Mascara 6.3 7.1 41.1
  48. B E A U T Y A N D P

    E R S O N A L C A R E I N V I E T N A M P a s s p o r t 41 © E u r o m o n i t o r I n t e r n a t i o n a l - Mascara 8.0 9.2 55.4 -- Mass Eye Shadow 6.7 7.8 45.3 -- Premium Eye Shadow 4.5 6.5 36.8 - Eye Shadow 5.9 7.3 42.5 -- Mass Eye Liner/Pencil 2.7 3.4 18.3 -- Premium Eye Liner/Pencil 5.8 7.3 42.2 - Eye Liner/Pencil 3.7 4.8 26.1 Eye Make-Up 5.0 6.2 35.2 Colour Cosmetics 5.6 6.5 36.8 Source: Euromonitor International from trade associations, trade press, company research, trade interviews, trade sources
  49. B E A U T Y A N D P

    E R S O N A L C A R E I N V I E T N A M P a s s p o r t 42 © E u r o m o n i t o r I n t e r n a t i o n a l DEODORANTS IN VIETNAM - CATEGORY ANALYSIS KEY DATA FINDINGS ▪ Retail value sales rise by 4% in current terms in 2022 to VND2.4 trillion ▪ Deodorant sticks is the best performing category in 2022, with retail value sales growing by 5% in current terms to VND25.5 billion ▪ Beiersdorf Vietnam Ltd Co is the leading player in 2022, with a retail value share of 42% ▪ Retail sales are set to grow at a current value CAGR of 9% (2022 constant value CAGR of 5%) over the forecast period to VND3.8 trillion 2022 DEVELOPMENTS Stable growth for deodorants recoups most of the previous year’s losses After a year of slow decline in 2021, deodorants in Vietnam returned to current value growth in 2022, as activities outside the home gradually resumed after the pandemic. However, sales were unable to see full recovery, not quite reaching the level seen in 2020. The spray format has become popular amongst some consumers, since it is convenient to use, a variety of long- lasting fragrances is available, and comes at a lower price point. However, the tall bottle design puts off some consumers, as it is difficult to carry whilst on-the-go or travelling. Therefore, deodorant roll-ons is the most popular format, as it is convenient to carry, easily available across retail channels, and comes in a variety of brands and scents, and some products have added features such as skin whitening. Roll-ons are also considered less harmful to health and the environment. Meanwhile, following Nivea’s serum deodorants, in 2023 Dove introduced its dry serum deodorant, which not only claims to help consumers prevent body odour and dry more quickly than traditional roll-ons, but also contains collagen and vitamin B3, and helps to whiten the underarm skin. This is expected to be an exciting new segment, and was splashed across all social media platforms. Consumers look for added features, and increasingly for unscented products As evident from Dove’s new launch, added features are key selling points in deodorants, and are always being introduced by brands. Features such as cooling technology when sprayed directly on the skin, a formula that does not stick to clothing, long-lasting scent, sweat prevention, and quick dry are features available from some brands, and are communicated through marketing activities and packaging labels. Such new product developments reflect the premiumisation trend visible in deodorants. Meanwhile, although fragranced products account for the majority of those available, there is a small but growing group of younger consumers that prefers unscented deodorant, especially in the big cities, since the mass products available usually have popular scents which are easy to recognise and relatively common. Younger men especially consider that mass deodorants have used similar scents for a while now, and such scents can also be found in other male-specific products, such as shower gel and shampoo, and
  50. B E A U T Y A N D P

    E R S O N A L C A R E I N V I E T N A M P a s s p o r t 43 © E u r o m o n i t o r I n t e r n a t i o n a l they are moving away from such scents to unscented products to avoid using a similar scent to others. Shopping behaviour affected by social media and marketing activities Beiersdorf Vietnam Ltd Co remained the clear leader in deodorants in value terms in 2022, and continued to have the two leading brands in the category, Nivea and Nivea Men Deodorant. Beiersdorf was one of the first manufacturers to launch deodorants in the country, which afforded its brands first-mover advantage. It continues to leverage its extensive retail distribution network and makes strong investments in marketing to maintain its lead in deodorants. Consumers also often prefer to choose products with high brand awareness and activity on social media platforms, and Nivea is a top-of-mind brand due to its extensive online and in-store activities. However, Beiersdorf saw a decline in its value share in 2022. An increasing number of consumers prefer pharmaceutical deodorants, influenced by famous TikTok influencers or YouTubers. For example, beauty blogger Vo Ha Linh reviewed Etiaxil (Sagen Group) and Scion (Nu Skin), and soon after the video, young people sought out these products on e-commerce sites and gave good feedback. PROSPECTS AND OPPORTUNITIES Healthy growth expected for deodorants in the forecast period Overall deodorants is expected to see solid current value growth over the forecast period, returning to the 2020 level of sales in 2023. Demand is expected to be supported by the lack of pandemic restrictions, and the resultant increase in activities outside the home, with deodorants boosting consumer confidence in both work and social settings. The recovery of travel will also provide another strong push to the sale and use of deodorants in Vietnam. Deodorant roll-ons and sprays are expected to register the fastest current value growth in the forecast period. New product launches with added features, and new formats, such as serums, are also expected to help drive growth in the category. The call for added-value and extra benefits is predicted to be most visible in terms of skin whitening properties for female consumers and antiperspirants for male consumers. Although remaining small in terms of actual value sales, premium deodorants is expected to continue to see higher current value growth than mass deodorants. Packaging changes and different sizes to appeal to consumers Packaging plays a very important role in attracting consumers to deodorants, and this is expected to continue in the forecast period, with players therefore likely to create appealing packaging through the use of trendy colours to help their brands stand out amongst the crowd. Meanwhile, the smaller size of Vietnamese households, as they have fewer children, mean that young families will prioritise their children’s physical health and hygiene, which will increase demand for children’s deodorants. In addition, as activities outside the home resume, and as consumers have increasing income levels, specific products are expected for activities outside the home, including small packaging such as 100ml bottles for air travel. Such developments are expected to support demand for deodorants over the coming years. Modern trade channels expected to remain important Continuing the trend seen for several years, e-commerce saw its share of distribution rise in 2022, and this is expected to continue in the forecast period. It is mostly big brands that will benefit from this growth, as they also offer other products via their official stores – it is rare for
  51. B E A U T Y A N D P

    E R S O N A L C A R E I N V I E T N A M P a s s p o r t 44 © E u r o m o n i t o r I n t e r n a t i o n a l consumers to purchase only deodorants unless they have special deals. However, websites are set to increasingly move beyond being regarded simply as a sales channel, to become a key marketing channel for brands. Growth in e-commerce is also expected to be boosted by product review videos on social media platforms such as TikTok or YouTube. Nevertheless, modern offline channels such as supermarkets and beauty specialists are expected to remain important and account for a significant share of value sales, as consumers can physically review and test products in-store, which is especially important if they are looking to try a new scent. CATEGORY DATA Table 40 Sales of Deodorants by Category: Value 2017-2022 VND billion 2017 2018 2019 2020 2021 2022 Deodorant Wipes - - - - - - Deodorant Sticks 20.2 22.0 24.1 25.3 24.2 25.5 Deodorant Sprays 540.8 625.4 719.0 766.7 723.7 746.4 Deodorant Roll-Ons 1,130.7 1,323.3 1,515.7 1,647.1 1,597.2 1,665.1 Deodorant Pumps - - - - - - Deodorant Creams - - - - - - Deodorants 1,691.7 1,970.7 2,258.8 2,439.1 2,345.1 2,437.0 Source: Euromonitor International from official statistics, trade associations, trade press, company research, store checks, trade interviews, trade sources Table 41 Sales of Deodorants by Category: % Value Growth 2017-2022 % current value growth 2021/22 2017-22 CAGR 2017/22 Total Deodorant Wipes - - - Deodorant Sticks 5.2 4.8 26.4 Deodorant Sprays 3.1 6.7 38.0 Deodorant Roll-Ons 4.3 8.0 47.3 Deodorant Pumps - - - Deodorant Creams - - - Deodorants 3.9 7.6 44.1 Source: Euromonitor International from official statistics, trade associations, trade press, company research, store checks, trade interviews, trade sources Table 42 Sales of Deodorants by Premium vs Mass: % Value 2017-2022 % retail value rsp 2017 2018 2019 2020 2021 2022 Premium 5.7 8.4 10.5 10.8 10.8 10.9 Mass 94.3 91.6 89.5 89.2 89.2 89.2 Total 100.0 100.0 100.0 100.0 100.0 100.0 Source: Euromonitor International from official statistics, trade associations, trade press, company research, store checks, trade interviews, trade sources Table 43 NBO Company Shares of Deodorants: % Value 2018-2022
  52. B E A U T Y A N D P

    E R S O N A L C A R E I N V I E T N A M P a s s p o r t 45 © E u r o m o n i t o r I n t e r n a t i o n a l % retail value rsp Company 2018 2019 2020 2021 2022 Beiersdorf Vietnam Ltd Co 41.6 41.9 42.1 42.5 42.0 Unilever Vietnam 17.3 16.9 16.5 16.7 17.0 International Co Ltd Unza Vietnam Co Ltd 11.4 11.4 11.9 11.9 11.9 International Consumer 9.1 8.7 9.0 8.5 8.5 Products Co Ltd Sagen Trade & Service JSC 1.0 1.1 1.4 1.7 1.8 Nu Skin Vietnam Co Ltd 1.1 1.4 1.4 1.7 1.7 Oriflame Vietnam Ltd - - 1.0 0.6 0.6 Coty Inc 0.6 0.6 0.6 0.6 0.6 Oral-B (Vietnam) Ltd 0.3 0.3 0.3 0.3 0.4 Amway Vietnam Co Ltd 0.2 0.2 0.2 0.2 0.2 Lana Cosmetics 0.0 0.0 0.0 0.0 0.0 Thuong Xuan Cosmetic Co Ltd 2.0 1.8 - - - Henkel Vietnam Co Ltd 0.4 - - - - Church & Dwight Co Inc 0.0 - - - - Revlon Inc - - - - - Procter & Gamble Vietnam - - - - - Ltd Avon Cosmetics Vietnam Ltd - - - - - Osotspa Co Ltd - - - - - Others 14.8 15.7 15.6 15.4 15.2 Total 100.0 100.0 100.0 100.0 100.0 Source: Euromonitor International from official statistics, trade associations, trade press, company research, store checks, trade interviews, trade sources Table 44 LBN Brand Shares of Deodorants: % Value 2019-2022 % retail value rsp Brand (GBO) Company (NBO) 2019 2020 2021 2022 Nivea (Beiersdorf AG) Beiersdorf Vietnam Ltd Co 22.8 23.2 23.6 23.1 Nivea Men Deodorant Beiersdorf Vietnam Ltd Co 19.1 18.8 18.7 18.8 (Beiersdorf AG) Enchanteur (Wipro Ltd) Unza Vietnam Co Ltd 10.3 10.8 10.8 10.8 X-Men (Marico Ltd) International Consumer 8.7 9.0 8.5 8.5 Products Co Ltd Axe (Unilever Group) Unilever Vietnam 5.8 5.7 5.8 5.7 International Co Ltd Rexona Women Unilever Vietnam 5.5 5.4 5.5 5.6 (Unilever Group) International Co Ltd Dove (Unilever Group) Unilever Vietnam 3.6 3.5 3.6 3.7 International Co Ltd Rexona Deodorant For Unilever Vietnam 2.0 1.9 1.9 2.0 Men (Unilever Group) International Co Ltd Etiaxil (Sagen Groupe) Sagen Trade & Service JSC 1.1 1.4 1.7 1.8 Nu Skin (Nu Skin Nu Skin Vietnam Co Ltd 1.4 1.4 1.7 1.7 Enterprises Inc) Romano (Wipro Ltd) Unza Vietnam Co Ltd 1.1 1.1 1.1 1.1 adidas Coty Inc 0.6 0.6 0.6 0.6 Oriflame (Oriflame Oriflame Vietnam Ltd - 0.7 0.4 0.5 Cosmetics SA) Gillette (Procter & Oral-B (Vietnam) Ltd 0.3 0.3 0.3 0.4 Gamble Co, The) G&H (Amway Corp) Amway Vietnam Co Ltd 0.2 0.2 0.2 0.2
  53. B E A U T Y A N D P

    E R S O N A L C A R E I N V I E T N A M P a s s p o r t 46 © E u r o m o n i t o r I n t e r n a t i o n a l Oriflame Men Oriflame Vietnam Ltd - 0.3 0.2 0.2 (Oriflame Cosmetics SA) Nivea Deodorant Beiersdorf Vietnam Ltd Co 0.1 0.1 0.1 0.1 (Beiersdorf AG) Lana (Lana Cosmetics Lana Cosmetics 0.0 0.0 0.0 0.0 SAE) Oriflame (Oriflame Thuong Xuan Cosmetic Co Ltd 1.3 - - - Cosmetics SA) Oriflame Men Thuong Xuan Cosmetic Co Ltd 0.5 - - - (Oriflame Cosmetics SA) Body Series (Amway Amway Vietnam Co Ltd - - - - Corp) Avon (Avon Products Avon Cosmetics Vietnam Ltd - - - - Inc) Lady's Choice Church & Dwight Co Inc - - - - Fa For Women (Henkel Henkel Vietnam Co Ltd - - - - AG & Co KGaA) Fa Men (Henkel AG & Henkel Vietnam Co Ltd - - - - Co KGaA) 12 Plus Osotspa Co Ltd - - - - Old Spice (Procter & Procter & Gamble Vietnam - - - - Gamble Co, The) Ltd Others Others 15.7 15.6 15.4 15.2 Total Total 100.0 100.0 100.0 100.0 Source: Euromonitor International from official statistics, trade associations, trade press, company research, store checks, trade interviews, trade sources Table 45 LBN Brand Shares of Premium Deodorants: % Value 2019-2022 % retail value rsp Brand (GBO) Company (NBO) 2019 2020 2021 2022 Nu Skin (Nu Skin Nu Skin Vietnam Co Ltd 13.0 13.0 15.4 16.1 Enterprises Inc) Others Others 87.0 87.0 84.6 83.9 Total Total 100.0 100.0 100.0 100.0 Source: Euromonitor International from official statistics, trade associations, trade press, company research, store checks, trade interviews, trade sources Table 46 Forecast Sales of Deodorants by Category: Value 2022-2027 VND billion 2022 2023 2024 2025 2026 2027 Deodorant Wipes - - - - - - Deodorant Sticks 25.5 26.5 27.4 28.3 29.2 30.0 Deodorant Sprays 746.4 763.9 788.5 826.6 869.0 923.6 Deodorant Roll-Ons 1,665.1 1,733.2 1,814.8 1,908.1 2,016.2 2,139.0 Deodorant Pumps - - - - - - Deodorant Creams - - - - - - Deodorants 2,437.0 2,523.6 2,630.8 2,763.1 2,914.4 3,092.5 Source: Euromonitor International from trade associations, trade press, company research, trade interviews, trade sources Table 47 Forecast Sales of Deodorants by Category: % Value Growth 2022-2027
  54. B E A U T Y A N D P

    E R S O N A L C A R E I N V I E T N A M P a s s p o r t 47 © E u r o m o n i t o r I n t e r n a t i o n a l % constant value growth 2022/2023 2022-27 CAGR 2022/27 Total Deodorant Wipes - - - Deodorant Sticks 3.8 3.3 17.4 Deodorant Sprays 2.4 4.4 23.7 Deodorant Roll-Ons 4.1 5.1 28.5 Deodorant Pumps - - - Deodorant Creams - - - Deodorants 3.6 4.9 26.9 Source: Euromonitor International from trade associations, trade press, company research, trade interviews, trade sources Table 48 Forecast Sales of Deodorants by Premium Vs Mass: % Value 2022-2027 % retail value rsp 2022 2023 2024 2025 2026 2027 Premium 10.9 10.9 10.9 10.9 10.9 11.0 Mass 89.2 89.1 89.1 89.1 89.1 89.0 Total 100.0 100.0 100.0 100.0 100.0 100.0 Source: Euromonitor International from trade associations, trade press, company research, trade interviews, trade sources
  55. B E A U T Y A N D P

    E R S O N A L C A R E I N V I E T N A M P a s s p o r t 48 © E u r o m o n i t o r I n t e r n a t i o n a l DEPILATORIES IN VIETNAM - CATEGORY ANALYSIS KEY DATA FINDINGS ▪ Retail value sales rise by 9% in current terms in 2022 to VND18.0 billion ▪ Hair removers/bleaches is the best performing category in 2022, with retail value sales growing by 9% in current terms to VND16.8 billion ▪ Reckitt Benckiser Group Plc (RB) is the leading player in 2022, with a retail value share of 38% ▪ Retail sales are set to rise at a current value CAGR of 8% (2022 constant value CAGR of 4%) over the forecast period to VND26.5 billion 2022 DEVELOPMENTS Depilatories returns to growth in Vietnam, driven by hair removers/bleaches After a year of decline in 2021 during the worst impact of the pandemic, in 2022 depilatories saw a return to current value growth, as activities outside the home resumed in the country as the pandemic eased – people went out more often to meet friends, and paid more attention to grooming, including hair removal. Even though there are a number of spas offering laser hair removal services, even for those who use such services efficacy is not 100%, and some hair growth still remains, therefore also maintaining demand for hair removal. The weather also contributed to growth in 2022 – with an extremely hot summer with temperatures up to 35°C and even 40°C, people tended to go to the beach at the weekend as a way to relax, and they wanted the best bikini shots, which also contributed to growth in 2022. Hair removers/bleaches remained the dominant category within depilatories in 2022, and it increased its share of sales, as it also saw the strongest current value growth in this year. Points of differentiation are increasingly seen amongst hair removers/bleaches Gel/lotion format remains popular in hair removers/bleaches, as it easy to apply to any area of the body. Since the smell of these products is the main pain point for consumers who use them frequently, brands have made efforts to include pleasant fragrances to reduce the strong smell. Other different features have also been added to multiple depilatories brands in order to attract consumers. For instance, some have added natural ingredients such as avocado, herbs, and aloe vera to appeal to consumers, while others offer benefits such as moisturising and whitening. Organic products are also increasingly available, in line with the general shift towards healthier and more sustainable goods. However, quick action is one of the most appealing features, as it can save consumers time, with products available that claim to remove hair within only two or three minutes of application. Besides, since differences in skin type can also affect usage, more brands are offering more variants with specific features indicated for each skin type.
  56. B E A U T Y A N D P

    E R S O N A L C A R E I N V I E T N A M P a s s p o r t 49 © E u r o m o n i t o r I n t e r n a t i o n a l Global player leads due to strong distribution and A good reputation Reckitt Benckiser Group Plc continued to lead depilatories in value terms with its brand Veet in 2022, owing to its trusted brand name and long-standing presence in Vietnam. Despite being more expensive than many other brands, consumers are willing to pay a higher price for Veet, as it is perceived to offer quality, prestige, and safety. It also has a strong distribution network, with its products displayed across all supermarkets, retail pharmacies, and beauty specialists. The brand often receives good feedback and recommendations from the social community for its various product types and products for specific areas of the skin. Second-placed Cleo from CLEO Vietnam JSC has also been growing well, supported by expansion of distribution and a wider retail presence. In addition, the brand offers multiple product variants with eye-catching packaging to attract younger consumers, such as light green and light blue colours, and usually offers combo discounts on e-commerce sites. Cleo also has products that are promoted as natural and help to improve skin health after shaving; for example, Cleo Avocado hair remover cream with aloe vera, matcha, and rose essence. PROSPECTS AND OPPORTUNITIES Depilatories set to see stable growth in the coming years Depilatories is expected to see solid current value growth throughout the forecast period. As consumers return to their normal lives after the pandemic, including events outside the home and travelling, they are expected to resume their full grooming routine. Higher hygiene and beauty standards are also expected to support growth. Most potential is expected amongst consumers in suburban and rural areas. However, even though many women in the big cities have already had hair removal with laser technologies, they still need to use hair removers/bleaches, since some hair growth still persists. While hair removers/bleaches is predicted to remain the dominant category, with sales of women’s pre-shave products still negligible, women’s razors and blades is projected to see the fastest current value growth over the forecast period. Overall, the category’s performance is expected to be supported by rising awareness of depilatories in Vietnam, in line with the higher attention being paid to appearance along with the growing encroachment of Western media, not least social networks. Consumers expected to demand innovations to improve the hair removal experience Removing hair is not a pleasant experience – therefore, consumers expect to have products available that offer features which strongly reduce hair growth, as well as new formats, such as solid stick and oil. After hair removal the skin is often dry, so offering extra moisturising features could convince consumers to purchase. In terms of packaging, major products in the market offer small tubes. However, there has been an increasing preference observed for pump bottles. Bigger pack sizes of hair removers which can be applied to multiple areas can also offer convenience. Reckitt Benckiser is well-placed to retain its leading position in depilatories in the forecast period, due to its strong foundation in hair removers/bleaches, its prestigious Veet brand name, and wide distribution. However, it could lose value share to competitors due to the anticipated rise of women’s razors and blades, in which it had no presence at the end of the review period. In addition, local competitors are expected to gain a stronger foothold in depilatories in the short to medium term. Domestic players are set to continue to focus on smaller and more niche natural and organic offerings to cater to the rise in demand for natural, safer and more sustainable products from consumers.
  57. B E A U T Y A N D P

    E R S O N A L C A R E I N V I E T N A M P a s s p o r t 50 © E u r o m o n i t o r I n t e r n a t i o n a l E-commerce likely to contribute to growth due to price promotions Offline channels such as small local grocers, beauty specialists, and supermarkets are expected to remain important in sales of depilatories, as consumers can easily choose suitable products in local outlets. However, e-commerce saw steady growth in the review period, and this is expected to continue in the forecast period, as websites such as Lazada and Shopee are an increasing focus of both brands and consumers. Often, discounts of up to 50% can be offered, as well as buy-one-get-one-free, and free gifts. However, since the shipping fee is relatively high compared with the unit price of depilatories, consumers tend to buy these products along with other beauty and personal care items; hence, they tend to prefer beauty specialist retailers’ official stores on Shopee and Lazada, such as Watsons. CATEGORY DATA Table 49 Sales of Depilatories by Category: Value 2017-2022 VND billion 2017 2018 2019 2020 2021 2022 Women's Razors and Blades 0.9 1.0 1.1 1.2 1.1 1.2 Women's Pre-Shave - - - - - - Hair Removers/Bleaches 13.4 14.7 16.1 16.7 15.4 16.8 Depilatories 14.3 15.7 17.2 17.9 16.5 18.0 Source: Euromonitor International from official statistics, trade associations, trade press, company research, store checks, trade interviews, trade sources Table 50 Sales of Depilatories by Category: % Value Growth 2017-2022 % current value growth 2021/22 2017-22 CAGR 2017/22 Total Women's Razors and Blades 7.7 5.3 29.2 Women's Pre-Shave - - - Hair Removers/Bleaches 9.2 4.7 25.8 Depilatories 9.1 4.7 26.0 Source: Euromonitor International from official statistics, trade associations, trade press, company research, store checks, trade interviews, trade sources Table 51 Sales of Women's Razors and Blades by Type: % Value Breakdown 2018-2022 % retail value rsp 2018 2019 2020 2021 2022 Disposables 47.2 47.5 47.5 47.5 47.7 Systems 52.0 51.9 52.0 52.0 52.0 Systems - Razors 20.6 20.6 20.8 20.8 21.0 Systems - Refill Blades 31.4 31.3 31.2 31.2 31.0 Other Razors and Blades 0.8 0.6 0.6 0.5 0.3 Total 100.0 100.0 100.0 100.0 100.0 Source: Euromonitor International from official statistics, trade associations, trade press, company research, store checks, trade interviews, trade sources
  58. B E A U T Y A N D P

    E R S O N A L C A R E I N V I E T N A M P a s s p o r t 51 © E u r o m o n i t o r I n t e r n a t i o n a l Table 52 NBO Company Shares of Depilatories: % Value 2018-2022 % retail value rsp Company 2018 2019 2020 2021 2022 Reckitt Benckiser Group 27.2 32.3 34.7 35.4 37.9 Plc (RB) CLEO Vietnam JSC 23.0 23.3 24.4 24.7 27.0 Dai Linh Cosmetics Import 7.9 7.6 8.7 8.4 9.3 Export JSC Oral-B (Vietnam) Ltd 3.7 4.2 4.3 4.4 4.6 Dorco Co Ltd 1.3 1.4 1.4 1.4 1.4 Edgewell Personal Care 0.6 0.6 0.6 0.7 0.6 Brands LLC Procter & Gamble Vietnam 3.0 2.0 - - - Ltd Civic Co Ltd - - - - - Inverness Corp - - - - - Energizer Holdings Inc - - - - - Henkel Vietnam Co Ltd - - - - - Thuong Xuan Cosmetic Co Ltd - - - - - Others 33.2 28.6 25.8 24.9 19.1 Total 100.0 100.0 100.0 100.0 100.0 Source: Euromonitor International from official statistics, trade associations, trade press, company research, store checks, trade interviews, trade sources Table 53 LBN Brand Shares of Depilatories: % Value 2019-2022 % retail value rsp Brand (GBO) Company (NBO) 2019 2020 2021 2022 Veet Reckitt Benckiser Group 32.3 34.7 35.4 37.9 Plc (RB) Cleo CLEO Vietnam JSC 23.3 24.4 24.7 27.0 Eveline (Eveline Dai Linh Cosmetics Import 7.6 8.7 8.4 9.3 Cosmetics SA Sp k) Export JSC Gillette (Procter & Oral-B (Vietnam) Ltd 4.2 4.3 4.4 4.6 Gamble Co, The) Tinkle Dorco Co Ltd 1.4 1.4 1.4 1.4 Schick Edgewell Personal Care 0.6 0.6 0.7 0.6 Brands LLC Velvinette (Procter & Procter & Gamble Vietnam 2.0 - - - Gamble Co, The) Ltd Soral (Chuo Bussan Civic Co Ltd - - - - International Co Ltd) Schick Energizer Holdings Inc - - - - Opilca (Henkel AG & Henkel Vietnam Co Ltd - - - - Co KGaA) One Touch (American Inverness Corp - - - - International Industries) Oriflame (Oriflame Thuong Xuan Cosmetic Co Ltd - - - - Cosmetics SA) Others Others 28.6 25.8 24.9 19.1 Total Total 100.0 100.0 100.0 100.0 Source: Euromonitor International from official statistics, trade associations, trade press, company research, store checks, trade interviews, trade sources
  59. B E A U T Y A N D P

    E R S O N A L C A R E I N V I E T N A M P a s s p o r t 52 © E u r o m o n i t o r I n t e r n a t i o n a l Table 54 Forecast Sales of Depilatories by Category: Value 2022-2027 VND billion 2022 2023 2024 2025 2026 2027 Women's Razors and Blades 1.2 1.3 1.3 1.4 1.4 1.5 Women's Pre-Shave - - - - - - Hair Removers/Bleaches 16.8 17.5 18.1 18.8 19.6 20.3 Depilatories 18.0 18.7 19.4 20.2 21.0 21.8 Source: Euromonitor International from trade associations, trade press, company research, trade interviews, trade sources Table 55 Forecast Sales of Depilatories by Category: % Value Growth 2022-2027 % constant value growth 2022/2023 2022-27 CAGR 2022/27 Total Women's Razors and Blades 4.1 4.3 23.7 Women's Pre-Shave - - - Hair Removers/Bleaches 3.9 3.8 20.7 Depilatories 3.9 3.9 20.9 Source: Euromonitor International from trade associations, trade press, company research, trade interviews, trade sources
  60. B E A U T Y A N D P

    E R S O N A L C A R E I N V I E T N A M P a s s p o r t 53 © E u r o m o n i t o r I n t e r n a t i o n a l FRAGRANCES IN VIETNAM - CATEGORY ANALYSIS KEY DATA FINDINGS ▪ Retail value sales grow by 7% in current terms in 2022 to VND2.5 trillion ▪ Premium fragrances is the best performing category in 2022, with retail value sales increasing by 7% in current terms to VND1.9 trillion ▪ Coty Beauty Vietnam Co Ltd is the leading player in 2022, with a retail value share of 18% ▪ Retail sales are set to rise at a current value CAGR of 9% (2022 constant value CAGR of 5%) over the forecast period to VND3.9 trillion 2022 DEVELOPMENTS Fragrances records A sales rebound in Vietnam as social and work events resume Fragrances saw two consecutive years of current value decline in 2020 and 2021 due to the COVID-19 pandemic. People worked from home where possible, while few social occasions took place during lockdown periods, and consumers tended to stay at home even outside of lockdowns for health and economic reasons, which limited the need to use or purchase new fragrances. Moreover, the slump in tourism, which is an especially important source of sales for fragrances in Vietnam, hurt demand. However, in 2022 activities outside the home gradually resumed after the pandemic, including working in the office, and travel, and consumers therefore had more occasions to use fragrances. Fragrances therefore returned to current value growth in 2022, with increases seen for both mass and premium fragrances. Growth was also driven by higher incomes and living standards, and the fact that younger consumers paid more attention to their appearance and general grooming. Besides, growth was partly due to efforts by brands in terms of launching multiple discount programmes and more product variants in various price ranges. However, despite the rebound to growth, it should be noted that after two such difficult years, sales still remained far lower than the pre-pandemic level, seen in 2019. Sustainable offerings in fragrances are exciting younger consumers Sustainable offerings have been attracting younger consumers in fragrances, even though the prices of such products are quite a lot higher than non-sustainable products. Guerlain introduced the Aqua Allegoria line. All products in the line use alcohol extracted from beetroot grown according to organic farming methods. The formula has also been redesigned to use up to 95% natural ingredients. These products also come in a 15% recycled glass bottle which can be refilled; Guerlain claims that refilling the fragrance bottle can reduce the production of new glass by 24% and the use of plastic by 44%. Meanwhile, Air Eau de Parfum is a unisex fragrance offered by Air Company. It uses a proprietary technique to convert CO2 into an ultra- refined alcohol, claiming to be the world’s first fragrance made from air. Customers can opt for a silver, white or black cap, although they can also opt for a capless design to reduce their environmental impact.
  61. B E A U T Y A N D P

    E R S O N A L C A R E I N V I E T N A M P a s s p o r t 54 © E u r o m o n i t o r I n t e r n a t i o n a l Strong competitive landscape in fragrances in Vietnam Coty Beauty Vietnam Co Ltd remained the leading player in fragrances in value terms in 2022. Coty’s portfolio features brands such as adidas classic, Burberry, Lacoste, Gucci, and Calvin Klein. Its best-selling brand in 2022 was Davidoff, although this only ranked third in overall fragrances in this year, after DKNY (Inter Parfums Inc) and Issey Miyake (Shiseido Cosmetics Vietnam). Coty’s strength comes from its global reputation and extensive portfolio, with consumers having a strong level of recognition and trust in its brands. Moreover, the company has the most extensive distribution network and comprehensive local experience, which help it to match brands and products to target audiences. However, fragrances remained extremely competitive during 2022. Consumers are keen to have a long-lasting scent when choosing fragrances – therefore brands’ marketing activities mostly focused on this feature, along with a meaningful story, which requires both a functional and emotional connection. In 2022, big brands also focused more strongly on online sales. Well- known brands such as Lancôme and Narciso Rodriguez ran discount programmes offering up to 50% off during double-day sales on e-commerce sites. Meanwhile, using popular Korean idol Jennie from Blackpink as its brand ambassador, Tamburins introduced its fragrance collection Solace. Tamburins is a Korean brand, and mainly offers similar scents to famous global brands, and reaches strongly into rural areas to attract a wide consumer base, since it offers much cheaper prices than the leading brands. PROSPECTS AND OPPORTUNITIES Rising consumer confidence expected to lead to full recovery for fragrances In the forecast period fragrances is expected to continue its recovery in current value terms, with sales returning to the pre-pandemic level in 2024. This will be supported by the normalisation of consumers’ lives, with a return to working and socialising outside of the home, as well as rising living standards. An improving economic situation is set to encourage more international companies to invest in Vietnam, thereby widening the range of options available and creating more jobs and higher income potential for more local consumers. These factors are predicted to increase consumer confidence and spending and contribute to the projected strong growth rates for fragrances over the forecast period. Premium fragrances set to drive growth Especially for young professionals, fragrance is not only a daily-use product, but also something to define their personality, sophistication and class. They normally prefer luxury scents from global brands rather than local fragrances, which explains the higher current value growth forecast for premium fragrances than for mass fragrances. Higher-income consumers tend to choose niche fragrances to avoid using a similar scent to others. These products, such as Le Labo and Killian, normally come at high prices and are available in a limited number of retailers. Nevertheless, long-lasting fragrances from China with cheaper prices are expected to attract teenagers with limited budgets. Players in mass fragrances tend to be dynamic in terms of offering new scents and trendy marketing activities – they often offer scents similar to those in the premium segment as an alternative for consumers who cannot afford the premium version. Mass fragrances also offer various new herbal and floral scents, and target daily wear. These factors are also expected to maintain growth in mass fragrances over the forecast period.
  62. B E A U T Y A N D P

    E R S O N A L C A R E I N V I E T N A M P a s s p o r t 55 © E u r o m o n i t o r I n t e r n a t i o n a l Despite growth for e-commerce, offline channels will remain important E-commerce saw consistent distribution share growth throughout the review period, and growth is set to continue in the forecast period. However, the surge in sales via e-commerce due to the pandemic exacerbated problems around the control of sellers and products. A significant number of illegal and fake goods, including fragrances, were available throughout the review period, despite the efforts of the government to stop this. As e-commerce has boomed in Vietnam, it is increasingly difficult for the government to control the trade in illegal and counterfeit goods. Also, given the nature of fragrances, especially premium fragrances, offline sales are expected to remain important, especially via beauty specialists and department stores. These channels allow consumers to test several products and scents before purchasing a particular fragrance, and offer a guarantee of authenticity. Brands, specially small local ones, focus strongly on their in-store display, alongside other products, such as scented candles and solid perfume, to attract consumers’ attention and offer a good customer experience. CATEGORY DATA Table 56 Sales of Fragrances by Category: Value 2017-2022 VND billion 2017 2018 2019 2020 2021 2022 - Mass Fragrance Sets/ 3.0 4.0 5.1 4.4 4.1 4.3 Kits - Mass Unisex Fragrances - - - - - - - Mass Women's Fragrances 359.9 395.9 415.8 366.0 332.2 353.5 - Mass Men's Fragrances 238.9 260.4 280.9 247.2 228.2 241.1 Mass Fragrances 601.7 660.3 701.8 617.6 564.5 598.9 - Premium Fragrance 30.6 41.4 53.0 44.7 41.1 44.1 Sets/Kits - Premium Unisex 2.1 2.1 2.2 1.9 1.8 1.9 Fragrances - Premium Women's 1,150.7 1,323.2 1,528.4 1,299.1 1,240.3 1,337.1 Fragrances - Premium Men's 509.5 560.4 617.6 531.5 500.0 531.6 Fragrances Premium Fragrances 1,692.8 1,927.2 2,201.1 1,877.2 1,783.2 1,914.8 Fragrances 2,294.5 2,587.4 2,902.9 2,494.8 2,347.7 2,513.7 Source: Euromonitor International from official statistics, trade associations, trade press, company research, store checks, trade interviews, trade sources Table 57 Sales of Fragrances by Category: % Value Growth 2017-2022 % current value growth 2021/22 2017-22 CAGR 2017/22 Total - Mass Fragrance Sets/Kits 6.4 7.8 45.4 - Mass Unisex Fragrances - - - - Mass Women's Fragrances 6.4 -0.4 -1.8 - Mass Men's Fragrances 5.6 0.2 0.9 Mass Fragrances 6.1 -0.1 -0.5 - Premium Fragrance Sets/Kits 7.4 7.6 44.2 - Premium Unisex Fragrances 7.4 -1.2 -5.8 - Premium Women's Fragrances 7.8 3.0 16.2
  63. B E A U T Y A N D P

    E R S O N A L C A R E I N V I E T N A M P a s s p o r t 56 © E u r o m o n i t o r I n t e r n a t i o n a l - Premium Men's Fragrances 6.3 0.9 4.3 Premium Fragrances 7.4 2.5 13.1 Fragrances 7.1 1.8 9.6 Source: Euromonitor International from official statistics, trade associations, trade press, company research, store checks, trade interviews, trade sources Table 58 NBO Company Shares of Fragrances: % Value 2018-2022 % retail value rsp Company 2018 2019 2020 2021 2022 Coty Beauty Vietnam Co Ltd 18.1 18.2 19.0 18.4 18.3 Shiseido Cosmetics 9.8 9.7 10.2 10.6 10.3 Vietnam Co Ltd Inter Parfums Asia 5.1 5.2 5.4 8.8 8.9 Pacific Pte Ltd Saigon Cosmetics Corp 9.9 9.8 9.5 8.9 8.6 Inter Parfums Inc - - - - 6.3 L'Oréal Vietnam Co Ltd 4.4 5.2 5.4 5.7 6.2 Chanel SA 3.3 3.5 3.7 3.9 4.0 Euroitalia Srl 2.5 2.4 2.4 2.3 2.2 Oriflame Vietnam Ltd - - 3.3 1.9 1.9 Christian Dior SA, Parfums 1.7 1.8 1.9 2.0 1.9 Givenchy SA, Parfums 1.6 1.6 1.8 1.9 1.9 Lana Cosmetics 1.3 1.2 1.2 1.1 1.2 International Consumer 1.0 1.0 1.2 1.2 1.2 Products Co Ltd Kenzo Parfums SA 0.8 0.8 0.8 0.8 0.8 LG Vina Cosmetics Co Ltd 0.7 0.6 0.7 0.6 0.6 Elizabeth Arden Inc 0.6 0.5 0.6 0.6 0.6 Puig SL 1.4 0.6 0.5 0.6 0.5 Unza Vietnam Co Ltd 0.3 0.3 0.4 0.4 0.4 Give Back Beauty LLC - - - - 0.4 Body Shop (Vietnam) Co 0.2 0.2 0.2 0.2 0.1 Ltd, The Estée Lauder Vietnam Co Ltd 6.4 6.5 6.5 6.6 0.1 Perrigo Co Plc 0.1 0.1 0.1 0.1 0.1 Salvatore Ferragamo SpA 3.4 3.5 3.3 - - Thuong Xuan Cosmetic Co Ltd 4.9 5.1 - - - Procter & Gamble Vietnam - - - - - Ltd Avon Cosmetics Vietnam Ltd - - - - - Others 22.6 22.2 22.1 23.6 23.4 Total 100.0 100.0 100.0 100.0 100.0 Source: Euromonitor International from official statistics, trade associations, trade press, company research, store checks, trade interviews, trade sources Table 59 LBN Brand Shares of Fragrances: % Value 2019-2022 % retail value rsp Brand (GBO) Company (NBO) 2019 2020 2021 2022 DKNY Inter Parfums Inc - - - 6.3 Issey Miyake Shiseido Cosmetics 4.8 5.1 5.3 5.1 (Shiseido Co Ltd) Vietnam Co Ltd Davidoff (Coty Inc) Coty Beauty Vietnam Co Ltd 4.6 4.9 4.8 4.7 Chanel Chanel SA 3.5 3.7 3.9 4.0
  64. B E A U T Y A N D P

    E R S O N A L C A R E I N V I E T N A M P a s s p o r t 57 © E u r o m o n i t o r I n t e r n a t i o n a l Jean Paul Gaultier Shiseido Cosmetics 3.2 3.4 3.6 3.6 (Puig SL) Vietnam Co Ltd Salvatore Ferragamo Inter Parfums Asia - - 3.2 3.3 (Inter Parfums Inc) Pacific Pte Ltd Lancôme (L'Oréal L'Oréal Vietnam Co Ltd 2.5 2.7 2.8 3.1 Groupe) Coach (Inter Parfums Inter Parfums Asia 2.7 2.8 2.9 2.9 Inc) Pacific Pte Ltd Giorgio Armani L'Oréal Vietnam Co Ltd 2.2 2.3 2.4 2.6 (L'Oréal Groupe) Guess (Inter Parfums Inter Parfums Asia 2.4 2.5 2.6 2.5 Inc) Pacific Pte Ltd Burberry (Coty Inc) Coty Beauty Vietnam Co Ltd 2.2 2.3 2.4 2.3 Miss Saigon Saigon Cosmetics Corp 2.7 2.6 2.4 2.3 adidas classic (Coty Coty Beauty Vietnam Co Ltd 2.1 2.4 2.4 2.3 Inc) Moschino Euroitalia Srl 2.4 2.4 2.3 2.2 Oriflame (Oriflame Oriflame Vietnam Ltd - 3.3 1.9 1.9 Cosmetics SA) Dior (LVMH Moët Christian Dior SA, Parfums 1.8 1.9 2.0 1.9 Hennessy Louis Vuitton SA) Givenchy (LVMH Moët Givenchy SA, Parfums 1.6 1.8 1.9 1.9 Hennessy Louis Vuitton SA) Shiseido (Shiseido Co Shiseido Cosmetics 1.6 1.7 1.7 1.6 Ltd) Vietnam Co Ltd Cindy Saigon Cosmetics Corp 1.4 1.4 1.4 1.4 Gucci (Coty Inc) Coty Beauty Vietnam Co Ltd 1.3 1.3 1.3 1.3 Lacoste (Coty Inc) Coty Beauty Vietnam Co Ltd 1.4 1.3 1.3 1.3 Calvin Klein (Coty Inc) Coty Beauty Vietnam Co Ltd 1.8 1.8 1.2 1.3 X-Men (Marico Ltd) International Consumer 1.0 1.2 1.2 1.2 Products Co Ltd Marc Jacobs (Coty Inc) Coty Beauty Vietnam Co Ltd 1.1 1.1 1.1 1.1 David Beckham (Coty Coty Beauty Vietnam Co Ltd 0.9 0.9 0.9 0.9 Inc) Kate Moss (Coty Inc) Coty Beauty Vietnam Co Ltd 0.8 0.9 0.8 0.9 Hugo Boss (Coty Inc) Coty Beauty Vietnam Co Ltd 0.9 0.9 0.9 0.9 Kenzo (LVMH Moët Kenzo Parfums SA 0.8 0.8 0.8 0.8 Hennessy Louis Vuitton SA) Miss Sixty (Coty Inc) Coty Beauty Vietnam Co Ltd 0.7 0.7 0.7 0.8 The Face Shop (LG LG Vina Cosmetics Co Ltd 0.6 0.7 0.6 0.6 Household & Health Care Ltd) DKNY (Estée Lauder Estée Lauder Vietnam Co Ltd 6.0 6.0 6.2 - Cos Inc) Salvatore Ferragamo Salvatore Ferragamo SpA 3.5 3.3 - - Oriflame (Oriflame Thuong Xuan Cosmetic Co Ltd 5.1 - - - Cosmetics SA) Others Others 32.2 32.0 33.0 32.8 Total Total 100.0 100.0 100.0 100.0 Source: Euromonitor International from official statistics, trade associations, trade press, company research, store checks, trade interviews, trade sources Table 60 LBN Brand Shares of Premium Men's Fragrances: % Value 2019-2022 % retail value rsp Brand (GBO) Company (NBO) 2019 2020 2021 2022
  65. B E A U T Y A N D P

    E R S O N A L C A R E I N V I E T N A M P a s s p o r t 58 © E u r o m o n i t o r I n t e r n a t i o n a l Davidoff (Coty Inc) Coty Beauty Vietnam Co Ltd 7.9 8.3 8.5 8.1 DKNY Inter Parfums Inc - - - 7.5 Giorgio Armani L'Oréal Vietnam Co Ltd 6.1 6.3 6.5 6.7 (L'Oréal Groupe) Coach (Inter Parfums Inter Parfums Asia 5.7 5.9 6.1 6.5 Inc) Pacific Pte Ltd Calvin Klein (Coty Inc) Coty Beauty Vietnam Co Ltd 8.4 8.6 5.7 6.1 Chanel Chanel SA 5.1 5.3 5.3 6.0 Issey Miyake Shiseido Cosmetics 4.9 5.1 5.3 5.3 (Shiseido Co Ltd) Vietnam Co Ltd Lacoste (Coty Inc) Coty Beauty Vietnam Co Ltd 5.2 5.1 5.2 5.1 Burberry (Coty Inc) Coty Beauty Vietnam Co Ltd 4.7 4.9 5.1 5.0 Jean Paul Gaultier Shiseido Cosmetics 4.5 4.7 4.8 4.7 (Puig SL) Vietnam Co Ltd Guess (Inter Parfums Inter Parfums Asia 4.0 4.3 4.5 4.4 Inc) Pacific Pte Ltd Hugo Boss (Coty Inc) Coty Beauty Vietnam Co Ltd 4.3 4.1 4.1 4.1 Kenzo (LVMH Moët Kenzo Parfums SA 3.4 3.5 3.7 3.6 Hennessy Louis Vuitton SA) Lancôme (L'Oréal L'Oréal Vietnam Co Ltd 3.0 3.2 3.4 3.4 Groupe) Salvatore Ferragamo Inter Parfums Asia - - 3.4 3.3 (Inter Parfums Inc) Pacific Pte Ltd Moschino Euroitalia Srl 2.6 2.5 2.5 2.0 Escada (Coty Inc) Coty Beauty Vietnam Co Ltd 1.5 1.7 1.9 1.8 Givenchy (LVMH Moët Givenchy SA, Parfums 1.5 1.6 1.8 1.8 Hennessy Louis Vuitton SA) Tommy Hilfiger Give Back Beauty LLC - - - 1.8 Marc Jacobs (Coty Inc) Coty Beauty Vietnam Co Ltd 1.4 1.6 1.6 1.7 DKNY (Estée Lauder Estée Lauder Vietnam Co Ltd 7.5 6.9 7.1 - Cos Inc) Tommy Hilfiger (Estée Estée Lauder Vietnam Co Ltd 1.9 1.7 1.7 - Lauder Cos Inc) Salvatore Ferragamo Salvatore Ferragamo SpA 3.8 3.5 - - Others Others 12.5 11.1 12.0 11.2 Total Total 100.0 100.0 100.0 100.0 Source: Euromonitor International from official statistics, trade associations, trade press, company research, store checks, trade interviews, trade sources Table 61 LBN Brand Shares of Premium Women's Fragrances: % Value 2019-2022 % retail value rsp Brand (GBO) Company (NBO) 2019 2020 2021 2022 DKNY Inter Parfums Inc - - - 8.9 Issey Miyake Shiseido Cosmetics 7.2 7.6 7.9 7.5 (Shiseido Co Ltd) Vietnam Co Ltd Davidoff (Coty Inc) Coty Beauty Vietnam Co Ltd 5.5 6.0 5.6 5.6 Chanel Chanel SA 4.7 4.9 5.2 5.2 Jean Paul Gaultier Shiseido Cosmetics 4.3 4.7 4.8 4.9 (Puig SL) Vietnam Co Ltd Salvatore Ferragamo Inter Parfums Asia - - 4.6 4.9 (Inter Parfums Inc) Pacific Pte Ltd Lancôme (L'Oréal L'Oréal Vietnam Co Ltd 3.5 3.8 4.0 4.5 Groupe) Dior (LVMH Moët Christian Dior SA, Parfums 3.5 3.7 3.8 3.6
  66. B E A U T Y A N D P

    E R S O N A L C A R E I N V I E T N A M P a s s p o r t 59 © E u r o m o n i t o r I n t e r n a t i o n a l Hennessy Louis Vuitton SA) Moschino Euroitalia Srl 3.6 3.6 3.4 3.4 Shiseido (Shiseido Co Shiseido Cosmetics 3.1 3.2 3.2 3.0 Ltd) Vietnam Co Ltd Guess (Inter Parfums Inter Parfums Asia 3.0 3.0 3.2 3.0 Inc) Pacific Pte Ltd Coach (Inter Parfums Inter Parfums Asia 2.8 2.9 3.0 2.9 Inc) Pacific Pte Ltd Givenchy (LVMH Moët Givenchy SA, Parfums 2.5 2.7 2.9 2.8 Hennessy Louis Vuitton SA) Gucci (Coty Inc) Coty Beauty Vietnam Co Ltd 2.4 2.5 2.5 2.5 Burberry (Coty Inc) Coty Beauty Vietnam Co Ltd 2.3 2.4 2.4 2.4 Giorgio Armani L'Oréal Vietnam Co Ltd 1.8 1.8 1.9 2.2 (L'Oréal Groupe) Marc Jacobs (Coty Inc) Coty Beauty Vietnam Co Ltd 1.6 1.5 1.5 1.4 Elizabeth Arden Elizabeth Arden Inc 1.0 1.2 1.1 1.1 (Revlon Inc) Carolina Herrera Puig SL 1.1 1.0 1.1 1.0 Valentino (L'Oréal L'Oréal Vietnam Co Ltd 0.9 0.9 0.9 0.9 Groupe) DKNY (Estée Lauder Estée Lauder Vietnam Co Ltd 8.4 8.7 8.9 - Cos Inc) Salvatore Ferragamo Salvatore Ferragamo SpA 5.0 4.8 - - Others Others 31.9 29.0 28.3 28.3 Total Total 100.0 100.0 100.0 100.0 Source: Euromonitor International from official statistics, trade associations, trade press, company research, store checks, trade interviews, trade sources Table 62 Forecast Sales of Fragrances by Category: Value 2022-2027 VND billion 2022 2023 2024 2025 2026 2027 - Mass Fragrance Sets/ 4.3 4.5 4.7 4.8 5.0 5.3 Kits - Mass Unisex Fragrances - - - - - - - Mass Women's Fragrances 353.5 370.6 384.6 398.1 407.9 414.7 - Mass Men's Fragrances 241.1 250.9 260.1 267.8 274.6 280.5 Mass Fragrances 598.9 625.9 649.4 670.7 687.5 700.5 - Premium Fragrance 44.1 46.1 48.7 51.6 55.4 60.0 Sets/Kits - Premium Unisex 1.9 2.0 2.1 2.2 2.3 2.4 Fragrances - Premium Women's 1,337.1 1,418.9 1,498.8 1,576.9 1,652.3 1,727.0 Fragrances - Premium Men's 531.6 566.4 604.3 647.6 696.2 751.1 Fragrances Premium Fragrances 1,914.8 2,033.4 2,153.8 2,278.2 2,406.2 2,540.5 Fragrances 2,513.7 2,659.3 2,803.3 2,948.9 3,093.7 3,240.9 Source: Euromonitor International from trade associations, trade press, company research, trade interviews, trade sources Table 63 Forecast Sales of Fragrances by Category: % Value Growth 2022-2027 % constant value growth
  67. B E A U T Y A N D P

    E R S O N A L C A R E I N V I E T N A M P a s s p o r t 60 © E u r o m o n i t o r I n t e r n a t i o n a l 2022/2023 2022-27 CAGR 2022/27 Total - Mass Fragrance Sets/Kits 3.5 4.0 21.7 - Mass Unisex Fragrances - - - - Mass Women's Fragrances 4.8 3.2 17.3 - Mass Men's Fragrances 4.1 3.1 16.3 Mass Fragrances 4.5 3.2 17.0 - Premium Fragrance Sets/Kits 4.5 6.3 36.0 - Premium Unisex Fragrances 3.7 4.0 21.7 - Premium Women's Fragrances 6.1 5.3 29.2 - Premium Men's Fragrances 6.5 7.2 41.3 Premium Fragrances 6.2 5.8 32.7 Fragrances 5.8 5.2 28.9 Source: Euromonitor International from trade associations, trade press, company research, trade interviews, trade sources
  68. B E A U T Y A N D P

    E R S O N A L C A R E I N V I E T N A M P a s s p o r t 61 © E u r o m o n i t o r I n t e r n a t i o n a l HAIR CARE IN VIETNAM - CATEGORY ANALYSIS KEY DATA FINDINGS ▪ Retail value sales increase by 2% in current terms in 2022 to VND16.3 trillion ▪ Perms and relaxants is the best performing category in 2022, with retail value sales growing by 6% in current terms to VND10.8 billion ▪ Unilever Vietnam International Co Ltd is the leading player in 2022, with a retail value share of 34% ▪ Retail sales are set to rise at a current value CAGR of 8% (2022 constant value CAGR of 3%) over the forecast period to VND23.3 trillion 2022 DEVELOPMENTS Hair care maintains fairly stable value sales in 2022 Hair care saw a slight current value decline in 2021, as lockdowns and less contact with other people meant consumers felt there was less need to wash their hair as often. However, hair care in Vietnam returned to growth in 2022. This was supported by an increase in the frequency of consumers leaving the home as the pandemic eased, and as consumers resumed their full grooming routine. However, overall value sales remained lower than those seen in 2020, with full recovery only expected in 2023. The growth in hair care was also supported by the emergence of various new brands in the market, as well as by new variants being launched by existing brands. The category continues to be dominated by global giants, but small or local brands are focusing on developing different products in order to compete – such as herbal hair products. For instance, Toc May Herbal Shampoo contains concentrated extract of bodhi and seven herbs, is free from sulphates, parabens, fragrances and colours, and claims the product can reduce hair loss after only two weeks of use. With busier lifestyles in urban areas, products that show fast action or combinations of shampoo and conditioner are also attractive to consumers. Anti-dandruff is one of the key features when choosing shampoos Dandruff is a common problem, faced by many consumers in Vietnam. However, hair problems can be different amongst different genders and age groups – men especially can be faced with an itchy scalp and dry hair, whilst both women and men can face hair loss. Vietnamese people tend to use the same shampoo for all family members, preferring products from famous brands, but buy products specifically to treat dandruff or hair loss if necessary. While women have various choices when it comes to products to deal with dandruff, men have fewer options, mostly from Clear, X-Men, and Romano. The scents of these products are similar, which means that price and convenience tend to be deciding factors. Hair care is led by global brands Unilever Vietnam International Co Ltd continued to lead hair care in Vietnam in value terms in 2022, with its brands including those in the top three positions in hair care – Clear, Sunsilk, and
  69. B E A U T Y A N D P

    E R S O N A L C A R E I N V I E T N A M P a s s p o r t 62 © E u r o m o n i t o r I n t e r n a t i o n a l Dove. Unilever leverages its huge financial resources to invest in product innovation, including novelties with natural ingredients and various functions. For example, its Love Beauty and Planet hair care collection consists of products made with natural ingredients and promoted as sustainable lifestyle products. It also invests in running various marketing activities, both online and offline. In 2022, Clear co-operated with Creativehunts to support the, “Be the first you” campaign from Street Dance, which attracted gen Z consumers. Meanwhile, Sunsilk, which has 16 million followers on its Facebook page, has launched mini games in order to interact with consumers. Procter & Gamble remained the second player in hair care in 2022, and the only other player to hold a double-digit value share. It introduced its Antibacterial Head & Shoulders anti-dandruff brand, with claims that it kills 99.9% of bacteria. These global players and their brands are expected to continue to lead hair care in the forecast period. PROSPECTS AND OPPORTUNITIES Stable growth expected for hair care as new variants are launched With higher incomes and living standards, hair care is forecast to see strong, stable growth in the forecast period, with growth expected across all categories – even those that are more mature, such as standard shampoos, and conditioners and treatments. Growth in hair care is expected to be driven by more variants with added features and technologies, such as cooling fresh, oil control, or supporting hair growth. The demand for scents is also likely to be slightly different from previous years – although consumers will still prefer to choose natural, herbal and floral scents, these scents are expected to last longer. Inspired by social media, some young consumers are expected to change their hair style: cutting, curling, and dying their hair more frequently. This will create demand for appropriate hair care products, particularly hair treatment products, due to the damage that can be done to the hair during such processes. These products will include colour protection shampoos, repairing shampoos for dyed hair, and conditioners and treatments containing vitamins or collagen for hair repair. However, as the prices of these products remain high, this trend is likely to be visible mainly in big cities such as Hanoi and Ho Chi Minh City. Number of natural products expected to grow, with foaming formulae preferred The number of products featuring organic and natural ingredients, such as herbs, grapefruit, ginger, or bodhi, for instance, has been increasing due to higher consumer demand for more natural formulations. In Vietnam, local brand owners such as Thorakao Cosmetics Ltd, Hoa Linh Pharma Co Ltd, and Sao Thai Duong Cosmetics JSC have been amongst the more active players in developing and launching natural and organic/herbal hair care products, as part of a solid strategy to compete with brands from giant international players. More brands are likely to follow suit in the forecast period. However, consumers prefer products that produce a lot of foam when choosing shampoos, because they believe the foam will help make their scalp cleaner. Therefore, organic or natural products should consider this important factor when driving consumer awareness around the efficacy of their products. Meanwhile, the limited number of male hair care products available also offers potential for brands to target, especially in terms of scents. The market has seen the same scents for male- specific products for a decade, while men increasingly expect to have more options available to them.
  70. B E A U T Y A N D P

    E R S O N A L C A R E I N V I E T N A M P a s s p o r t 63 © E u r o m o n i t o r I n t e r n a t i o n a l Offline channel will remain key for basic products, but e-commerce also important For sales of general hair care products such as shampoos and conditioners, offline channels remain the most important, led by hypermarkets, supermarkets, and small local grocers, which offer a wide range of products in convenient locations. The dominance of offline sales of such products is expected to continue in the forecast period. Nevertheless, e-commerce saw rapid growth in the review period, and this is expected to be maintained moving forward, driven mostly by discount programmes such as buy-one-get-one-free, or up to 30% off. However, for some professional products, or those offering deeper treatment, there is not enough space to display them in offline stores, and not many people are even aware of these products, so most consumers purchase such products online rather than offline. Moreover, the digitalisation trend in hair care is expected to develop beyond e-commerce. In this vein, digital marketing is set to become an increasingly significant tool for companies looking to advertise and grow their brand image and representation. At the end of the review period, Facebook was the most popular social media platform for players looking to increase their interaction with customers, while TikTok and Zalo are expected to receive more attention from consumers in the forecast period. CATEGORY DATA Table 64 Sales of Hair Care by Category: Value 2017-2022 VND billion 2017 2018 2019 2020 2021 2022 Styling Agents 251.9 273.3 297.9 320.3 292.0 308.0 - Standard Shampoos 11,680.1 12,264.1 12,938.6 13,456.1 13,079.4 13,389.5 - Medicated Shampoos 70.0 76.0 81.7 86.6 78.0 98.2 Shampoos 11,750.1 12,340.1 13,020.3 13,542.7 13,157.3 13,487.8 Salon Professional Hair 456.1 498.0 547.8 575.2 529.2 555.9 Care Perms and Relaxants 9.2 10.1 11.0 11.6 10.2 10.8 Hair Loss Treatments - - - - - - Conditioners and 1,350.0 1,255.5 1,318.3 1,371.0 1,288.7 1,246.8 Treatments Colourants 532.0 577.2 635.0 666.7 613.4 644.3 2-in-1 Products - - - - - - Hair Care 14,349.3 14,954.3 15,830.3 16,487.5 15,890.9 16,253.5 Source: Euromonitor International from official statistics, trade associations, trade press, company research, store checks, trade interviews, trade sources Table 65 Sales of Hair Care by Category: % Value Growth 2017-2022 % current value growth 2021/22 2017-22 CAGR 2017/22 Total Styling Agents 5.5 4.1 22.3 - Standard Shampoos 2.4 2.8 14.6 - Medicated Shampoos 26.0 7.0 40.2 Shampoos 2.5 2.8 14.8 Salon Professional Hair Care 5.0 4.0 21.9 Perms and Relaxants 6.2 3.2 17.1 Hair Loss Treatments - - -
  71. B E A U T Y A N D P

    E R S O N A L C A R E I N V I E T N A M P a s s p o r t 64 © E u r o m o n i t o r I n t e r n a t i o n a l Conditioners and Treatments -3.3 -1.6 -7.6 Colourants 5.1 3.9 21.1 2-in-1 Products - - - Hair Care 2.3 2.5 13.3 Source: Euromonitor International from official statistics, trade associations, trade press, company research, store checks, trade interviews, trade sources Table 66 Sales of Hair Care by Premium vs Mass: % Value 2017-2022 % retail value rsp 2017 2018 2019 2020 2021 2022 Premium 4.3 4.6 4.8 4.9 4.9 5.1 Mass 95.7 95.4 95.2 95.1 95.1 94.9 Total 100.0 100.0 100.0 100.0 100.0 100.0 Source: Euromonitor International from official statistics, trade associations, trade press, company research, store checks, trade interviews, trade sources Table 67 NBO Company Shares of Hair Care: % Value 2018-2022 % retail value rsp Company 2018 2019 2020 2021 2022 Unilever Vietnam 36.0 35.2 34.7 34.2 34.2 International Co Ltd Procter & Gamble Vietnam 12.0 11.5 11.1 10.9 11.3 Ltd Unza Vietnam Co Ltd 5.0 5.2 5.5 5.6 5.6 International Consumer 4.5 4.3 4.5 4.3 4.3 Products Co Ltd L'Oréal Vietnam Co Ltd 2.1 2.3 2.4 2.3 2.4 Sao Thai Duong Cosmetics 2.2 2.4 2.4 2.3 2.3 JSC LG Vina Cosmetics Co Ltd 0.9 1.0 1.0 1.0 1.0 Hoyu Corp 0.9 1.0 1.0 0.9 1.0 Mascolo Ltd 0.4 0.4 0.4 0.4 0.4 Dai Viet Huong Trading 0.5 0.4 0.4 0.4 0.4 Manufacturing Co Ltd Henkel Vietnam Co Ltd 0.4 0.3 0.3 0.3 0.3 Creative Nature Group 0.4 0.4 0.3 0.3 0.3 John Paul Mitchell 0.3 0.3 0.3 0.3 0.3 Systems Inc Phu Thai Health & Beauty 0.3 0.3 0.3 0.3 0.3 Care JSC Amway Vietnam Co Ltd 0.3 0.3 0.3 0.3 0.3 Janssen-Cilag Ltd 0.1 0.1 0.1 0.1 0.2 Rohto-Mentholatum Vietnam 0.1 0.1 0.1 0.1 0.1 Co Ltd Mandom Vietnam Co Ltd 0.1 0.1 0.1 0.1 0.1 Colgate-Palmolive 0.1 0.1 0.1 0.1 0.1 (Vietnam) Co Ltd Revlon Inc 0.1 0.1 0.1 0.1 0.1 Oriflame Vietnam Ltd - - 0.2 0.1 0.1 Shiseido Cosmetics 0.1 0.1 0.1 0.1 0.1 Vietnam Co Ltd AmorePacific Vietnam JSC 0.1 0.1 0.1 0.1 0.1 Thuong Xuan Cosmetic Co Ltd 0.3 0.3 - - -
  72. B E A U T Y A N D P

    E R S O N A L C A R E I N V I E T N A M P a s s p o r t 65 © E u r o m o n i t o r I n t e r n a t i o n a l Others 32.7 33.5 34.0 35.3 34.6 Total 100.0 100.0 100.0 100.0 100.0 Source: Euromonitor International from official statistics, trade associations, trade press, company research, store checks, trade interviews, trade sources Table 68 NBO Company Shares of Salon Professional Hair Care: % Value 2018-2022 % retail value rsp Company 2018 2019 2020 2021 2022 L'Oréal Vietnam Co Ltd 54.9 58.4 60.1 61.4 61.3 Mascolo Ltd 12.9 12.7 12.6 12.7 12.5 Creative Nature Group 10.9 10.2 9.9 9.7 9.5 John Paul Mitchell 9.3 9.4 9.5 9.1 9.3 Systems Inc Shiseido Cosmetics 2.8 2.6 2.3 2.1 2.1 Vietnam Co Ltd AmorePacific Vietnam JSC 2.2 2.0 2.0 1.9 1.8 Others 7.0 4.6 3.7 3.1 3.5 Total 100.0 100.0 100.0 100.0 100.0 Source: Euromonitor International from official statistics, trade associations, trade press, company research, store checks, trade interviews, trade sources Table 69 LBN Brand Shares of Hair Care: % Value 2019-2022 % retail value rsp Brand (GBO) Company (NBO) 2019 2020 2021 2022 Clear (Unilever Group) Unilever Vietnam 11.4 11.4 11.3 11.2 International Co Ltd Sunsilk (Unilever Unilever Vietnam 9.5 9.3 9.1 9.3 Group) International Co Ltd Dove (Unilever Group) Unilever Vietnam 7.2 7.0 6.9 6.8 International Co Ltd X-Men (Marico Ltd) International Consumer 4.3 4.5 4.3 4.3 Products Co Ltd Head & Shoulders Procter & Gamble Vietnam 4.0 3.9 3.8 4.0 (Procter & Gamble Co, Ltd The) Romano (Wipro Ltd) Unza Vietnam Co Ltd 3.9 4.1 4.0 4.0 Pantene (Procter & Procter & Gamble Vietnam 4.1 4.0 3.9 3.9 Gamble Co, The) Ltd Clear Men (Unilever Unilever Vietnam 3.7 3.6 3.4 3.4 Group) International Co Ltd Rejoice (Procter & Procter & Gamble Vietnam 3.4 3.2 3.2 3.3 Gamble Co, The) Ltd Thai Duong Sao Thai Duong Cosmetics JSC 2.4 2.4 2.3 2.3 L'Oréal Professionnel L'Oréal Vietnam Co Ltd 2.0 2.1 2.0 2.1 (L'Oréal Groupe) Lifebuoy (Unilever Unilever Vietnam 1.8 1.8 1.8 1.7 Group) International Co Ltd TRESemmé (Unilever Unilever Vietnam 1.6 1.7 1.6 1.7 Group) International Co Ltd Enchanteur (Wipro Ltd) Unza Vietnam Co Ltd 1.3 1.4 1.6 1.6 Double Rich (LG LG Vina Cosmetics Co Ltd 1.0 1.0 1.0 1.0 Household & Health Care Ltd)
  73. B E A U T Y A N D P

    E R S O N A L C A R E I N V I E T N A M P a s s p o r t 66 © E u r o m o n i t o r I n t e r n a t i o n a l Bigen (Hoyu Co Ltd) Hoyu Corp 1.0 1.0 0.9 1.0 TIGI (Unilever Group) Mascolo Ltd 0.4 0.4 0.4 0.4 Ramus Dai Viet Huong Trading 0.4 0.4 0.4 0.4 Manufacturing Co Ltd Davines (Davines SpA) Creative Nature Group 0.4 0.3 0.3 0.3 Paul Mitchell John Paul Mitchell 0.3 0.3 0.3 0.3 Systems Inc Wella (Wella AG) Phu Thai Health & Beauty - 0.3 0.3 0.3 Care JSC Satinique (Amway Corp) Amway Vietnam Co Ltd 0.3 0.3 0.3 0.3 Syoss (Henkel AG & Co Henkel Vietnam Co Ltd 0.2 0.2 0.2 0.2 KGaA) Nizoral (Alliance Janssen-Cilag Ltd 0.1 0.1 0.1 0.2 Pharma Plc) Selsun (Rohto Rohto-Mentholatum Vietnam 0.1 0.1 0.1 0.1 Pharmaceutical Co Ltd) Co Ltd Gatsby (Mandom Corp) Mandom Vietnam Co Ltd 0.1 0.1 0.1 0.1 Palmolive (Colgate- Colgate-Palmolive 0.1 0.1 0.1 0.1 Palmolive Co) (Vietnam) Co Ltd Revlon Colorsilk Revlon Inc 0.1 0.1 0.1 0.1 Schwarzkopf Igora Henkel Vietnam Co Ltd 0.1 0.1 0.1 0.1 Vital (Henkel AG & Co KGaA) Elsève (L'Oréal Groupe) L'Oréal Vietnam Co Ltd 0.1 0.1 0.1 0.1 Wella (Coty Inc) Phu Thai Health & Beauty 0.3 - - - Care JSC Oriflame (Oriflame Thuong Xuan Cosmetic Co Ltd 0.3 - - - Cosmetics SA) Others Others 33.9 34.5 35.7 35.1 Total Total 100.0 100.0 100.0 100.0 Source: Euromonitor International from official statistics, trade associations, trade press, company research, store checks, trade interviews, trade sources Table 70 LBN Brand Shares of Colourants: % Value 2019-2022 % retail value rsp Brand (GBO) Company (NBO) 2019 2020 2021 2022 Bigen (Hoyu Co Ltd) Hoyu Corp 24.2 24.0 24.5 25.0 Double Rich (LG LG Vina Cosmetics Co Ltd 21.1 20.9 21.4 22.2 Household & Health Care Ltd) Syoss (Henkel AG & Co Henkel Vietnam Co Ltd 5.4 5.3 5.5 5.5 KGaA) Wella (Wella AG) Phu Thai Health & Beauty - 4.8 4.7 4.6 Care JSC Revlon Colorsilk Revlon Inc 2.8 2.8 2.8 2.9 Schwarzkopf Igora Henkel Vietnam Co Ltd 2.9 2.8 2.9 2.9 Vital (Henkel AG & Co KGaA) L'Oréal Paris L'Oréal Vietnam Co Ltd 2.0 2.1 2.2 2.3 (L'Oréal Groupe) Garnier (L'Oréal L'Oréal Vietnam Co Ltd 1.0 1.0 1.0 1.0 Groupe) Wella (Coty Inc) Phu Thai Health & Beauty 5.0 - - - Care JSC Oriflame (Oriflame Thuong Xuan Cosmetic Co Ltd 0.2 - - - Cosmetics SA) Wella (Procter & Phu Thai Health & Beauty - - - -
  74. B E A U T Y A N D P

    E R S O N A L C A R E I N V I E T N A M P a s s p o r t 67 © E u r o m o n i t o r I n t e r n a t i o n a l Gamble Co, The) Care JSC Others Others 35.2 36.2 35.0 33.7 Total Total 100.0 100.0 100.0 100.0 Source: Euromonitor International from official statistics, trade associations, trade press, company research, store checks, trade interviews, trade sources Table 71 LBN Brand Shares of Salon Professional Hair Care: % Value 2019-2022 % retail value rsp Brand (GBO) Company (NBO) 2019 2020 2021 2022 L'Oréal Professionnel L'Oréal Vietnam Co Ltd 58.4 60.1 61.4 61.3 (L'Oréal Groupe) TIGI (Unilever Group) Mascolo Ltd 12.7 12.6 12.7 12.5 Davines (Davines SpA) Creative Nature Group 10.2 9.9 9.7 9.5 Paul Mitchell John Paul Mitchell 9.4 9.5 9.1 9.3 Systems Inc Carita (L'Oréal Groupe) Shiseido Cosmetics 2.6 2.3 2.1 2.1 Vietnam Co Ltd Dantrol (AmorePacific AmorePacific Vietnam JSC 2.0 2.0 1.9 1.8 Corp) Carita (Shiseido Co Shiseido Cosmetics - - - - Ltd) Vietnam Co Ltd Others Others 4.6 3.7 3.1 3.5 Total Total 100.0 100.0 100.0 100.0 Source: Euromonitor International from official statistics, trade associations, trade press, company research, store checks, trade interviews, trade sources Table 72 LBN Brand Shares of Styling Agents: % Value 2019-2022 % retail value rsp Brand (GBO) Company (NBO) 2019 2020 2021 2022 X-Men (Marico Ltd) International Consumer 53.2 54.1 53.5 53.6 Products Co Ltd Romano (Wipro Ltd) Unza Vietnam Co Ltd 12.6 13.2 13.7 13.7 Gatsby (Mandom Corp) Mandom Vietnam Co Ltd 6.5 6.5 6.8 6.7 Wella (Wella AG) Phu Thai Health & Beauty - 5.7 5.8 5.6 Care JSC Jacqualine Jacqualine International 2.1 2.0 2.1 2.0 L'Oréal Studio Line L'Oréal Vietnam Co Ltd 2.0 1.9 2.0 2.0 (L'Oréal Groupe) Double Rich (LG LG Vina Cosmetics Co Ltd 1.1 1.0 1.0 1.0 Household & Health Care Ltd) Taft for Men (Henkel Henkel Vietnam Co Ltd 0.7 0.6 0.6 0.6 AG & Co KGaA) Wella (Coty Inc) Phu Thai Health & Beauty 6.0 - - - Care JSC Dr Men (Marico Ltd) International Consumer - - - - Products Co Ltd Wella (Procter & Phu Thai Health & Beauty - - - - Gamble Co, The) Care JSC Pantene (Procter & Procter & Gamble Vietnam - - - - Gamble Co, The) Ltd Oriflame (Oriflame Thuong Xuan Cosmetic Co Ltd - - - - Cosmetics SA)
  75. B E A U T Y A N D P

    E R S O N A L C A R E I N V I E T N A M P a s s p o r t 68 © E u r o m o n i t o r I n t e r n a t i o n a l Brylcreem (Unilever Unilever Vietnam - - - - Group) International Co Ltd Others Others 15.8 15.0 14.5 14.7 Total Total 100.0 100.0 100.0 100.0 Source: Euromonitor International from official statistics, trade associations, trade press, company research, store checks, trade interviews, trade sources Table 73 LBN Brand Shares of Premium Hair Care: % Value 2019-2022 % retail value rsp Brand (GBO) Company (NBO) 2019 2020 2021 2022 L'Oréal Professionnel L'Oréal Vietnam Co Ltd 42.0 42.5 41.9 41.4 (L'Oréal Groupe) TIGI (Unilever Group) Mascolo Ltd 9.1 8.9 8.7 8.4 Davines (Davines SpA) Creative Nature Group 7.4 7.0 6.6 6.4 Paul Mitchell John Paul Mitchell 6.8 6.7 6.2 6.3 Systems Inc Satinique (Amway Corp) Amway Vietnam Co Ltd 6.0 5.9 5.4 5.8 Carita (L'Oréal Groupe) Shiseido Cosmetics 1.9 1.6 1.4 1.4 Vietnam Co Ltd Dantrol (AmorePacific AmorePacific Vietnam JSC 1.5 1.4 1.3 1.2 Corp) Nu Skin (Nu Skin Nu Skin Vietnam Co Ltd 0.8 0.8 0.8 0.8 Enterprises Inc) L'Occitane Hals Group 0.4 0.3 0.3 0.3 (L'Occitane International SA) Carita (Shiseido Co Shiseido Cosmetics - - - - Ltd) Vietnam Co Ltd Others Others 24.2 24.9 27.3 28.0 Total Total 100.0 100.0 100.0 100.0 Source: Euromonitor International from official statistics, trade associations, trade press, company research, store checks, trade interviews, trade sources Table 74 Forecast Sales of Hair Care by Category: Value 2022-2027 VND billion 2022 2023 2024 2025 2026 2027 Styling Agents 308.0 320.1 336.4 356.5 379.4 408.1 - Standard Shampoos 13,389.5 13,721.2 14,162.9 14,676.3 15,234.4 15,833.4 - Medicated Shampoos 98.2 101.7 105.5 109.7 114.4 119.5 Shampoos 13,487.8 13,822.9 14,268.4 14,786.0 15,348.7 15,952.9 Salon Professional Hair 555.9 564.1 574.8 587.7 603.5 623.2 Care Perms and Relaxants 10.8 11.4 12.0 12.8 13.6 14.6 Hair Loss Treatments - - - - - - Conditioners and 1,246.8 1,258.0 1,287.6 1,328.3 1,379.9 1,444.7 Treatments Colourants 644.3 666.5 688.9 709.9 731.0 744.5 2-in-1 Products - - - - - - Hair Care 16,253.5 16,642.9 17,168.1 17,781.2 18,456.2 19,188.0 Source: Euromonitor International from trade associations, trade press, company research, trade interviews, trade sources
  76. B E A U T Y A N D P

    E R S O N A L C A R E I N V I E T N A M P a s s p o r t 69 © E u r o m o n i t o r I n t e r n a t i o n a l Table 75 Forecast Sales of Hair Care by Category: % Value Growth 2022-2027 % constant value growth 2022/2023 2022-27 CAGR 2022/27 Total Styling Agents 4.0 5.8 32.5 - Standard Shampoos 2.5 3.4 18.3 - Medicated Shampoos 3.5 4.0 21.7 Shampoos 2.5 3.4 18.3 Salon Professional Hair Care 1.5 2.3 12.1 Perms and Relaxants 5.0 6.2 35.1 Hair Loss Treatments - - - Conditioners and Treatments 0.9 3.0 15.9 Colourants 3.4 2.9 15.5 2-in-1 Products - - - Hair Care 2.4 3.4 18.1 Source: Euromonitor International from trade associations, trade press, company research, trade interviews, trade sources Table 76 Forecast Sales of Hair Care by Premium vs Mass: % Value 2022-2027 % retail value rsp 2022 2023 2024 2025 2026 2027 Premium 5.1 5.1 5.2 5.2 5.3 5.3 Mass 94.9 94.9 94.8 94.8 94.7 94.7 Total 100.0 100.0 100.0 100.0 100.0 100.0 Source: Euromonitor International from trade associations, trade press, company research, trade interviews, trade sources
  77. B E A U T Y A N D P

    E R S O N A L C A R E I N V I E T N A M P a s s p o r t 70 © E u r o m o n i t o r I n t e r n a t i o n a l MEN'S GROOMING IN VIETNAM - CATEGORY ANALYSIS KEY DATA FINDINGS ▪ Retail value sales grow by 5% in current terms in 2022 to VND5.3 trillion ▪ Men’s fragrances is the best performing category in 2022, with retail value sales growing by 6% in current terms to VND773 billion ▪ International Consumer Products Co Ltd is the leading player in 2022, with a retail value share of 21% ▪ Retail sales are set to grow at a current value CAGR of 10% (2022 constant value CAGR of 6%) over the forecast period to VND8.5 trillion 2022 DEVELOPMENTS Men’s grooming returns to growth in 2022 as restrictions are lifted Men’s grooming saw a current value decline in 2021, due to prolonged lockdowns in response to spikes in the number of COVID-19 cases in the country. Working from home and limitations on social events reduced the desire or need for men to maintain a high level of grooming. However, the category saw a rebound to growth in 2022. With the absence of pandemic restrictions, life returned to normal, and men resumed their former grooming habits. In addition, the strong spread of social media such as Facebook, TikTok, and Instagram encouraged Vietnamese men to have higher grooming standards, and accordingly they looked for more relevant products. Mostly influenced by Japanese, Korean, and Western idols, they started to research products and use daily products formulated specifically for men. Within men’s grooming, men’s toiletries performed well in 2022, supported by various social media trends relating to skin care and hair care. There was also an increasing sense that men did not want to be seen using products typically targeted towards women. Nevertheless, current value sales were still unable to return to the 2020 level in 2022, with this expected to be achieved in 2023. While men’s toiletries remained the largest category in 2022, men’s fragrances saw stronger growth. The smallest category in men’s grooming overall remained men’s post-shave, as the majority of men in rural areas think it is a waste of time to use such products. There has also been a lack of marketing activities to raise consumers’ awareness of such products in recent years. Diversity in brand activities to raise awareness Global brands continued to lead men’s grooming in value terms in Vietnam in 2022. International Consumer Products Co Ltd maintained its leadership through the top brand X-Men, followed by Unza Vietnam Co Ltd (Wipro) with Romano, and Unilever Vietnam International Co Ltd with Clear Men. Global brands continued to dominate due to their wide distribution networks, strong financial capability and dynamic marketing activities. For instance, Clear Men sponsors football and basketball events for young consumers nationwide, such as the National Student Basketball Tournament 2022 for men and women across 79 universities. It had booths at the entrance to matches to demonstrate its products and emphasise the importance of scalp health, highlighting the ability of Clear Men to eliminate dandruff itching, and fight sweat and bacteria.
  78. B E A U T Y A N D P

    E R S O N A L C A R E I N V I E T N A M P a s s p o r t 71 © E u r o m o n i t o r I n t e r n a t i o n a l Meanwhile, Nivea Men focused on content marketing – supporting consumers with product information and knowledge so they could improve the condition of their skin and hair. The brand also introduced Nivea Men Sensitive After-Shave Balm for sensitive skin. Local brands have so far tended to lag behind due to limited financial power and narrow distribution. Men’s demands are similar to those for women In general, the product features expected by men are gradually similar to those expected by women, such as moisturising, whitening, and a long-lasting scent. However, while products targeted towards women have various scents and brand choices, the majority of men’s grooming items have been offering popular, similar scents for a while now, which can be recognised easily in a crowd. Not wanting to use the same scent as everyone else, the younger generation tend to prefer unscented products, or just a light fragrance. Whitening was the most demanded feature at the end of the review period. Young men admire Korean idols and tend to use whitening cream or sun care products to maintain a fairer and healthy skin to follow their style. However, the variety of products available in men’s grooming remains limited, which is leading those with a presence to boost their marketing activities, focusing on online campaigns in order to raise consumer awareness and their brand image. PROSPECTS AND OPPORTUNITIES Rapid growth projected for men’s grooming in the forecast period Men’s grooming in Vietnam has room to grow strongly in the forecast period, with current value increases expected across all categories as the impact of the pandemic disappears, and due to higher living standards as incomes rise. This will also be due to growing consumer awareness of personal grooming and expanding brand choice. In addition, greater awareness of the benefits of using men’s grooming products in terms of appearance, image and wellbeing should also stimulate sales. Cultural influences from Korean or Western lifestyles are also set to drive growth, under the strong influence of social media. Importantly, exposure to South Korean culture is seeing men in Vietnam pay more attention to their appearance and style, which is set to continue to boost the demand for men’s grooming. The growth potential in the category is also set to foster higher investment in marketing brands and products. Marketing activities are expected to be geared more towards premium than mass men’s grooming products, as the leading players look to drive value sales. Increasingly competitive environment as the growth potential is significant Men’s grooming is also expected to become more competitive in the forecast period. As the category is still considered underdeveloped, it retains high growth potential. Not only are global brands offering male-specific products in the mass segment, such as Clear Men, Romano, and X-Men, but also increasingly in the mid-priced to premium range, with brands such as Innisfree, Clinique, Kiehl’s, Shiseido, Lancôme and Dior. Local brands have also started to increase their penetration of men’s grooming, due to growing demand for lower prices than international brands. Some local players are likely to look for niches, such as natural products for male consumers, to deepen their penetration. For example, this has already been seen with the herbal antidandruff shampoo from Sao Thai Duong Cosmetics, which claims to work for up to five days without the need to rewash hair.
  79. B E A U T Y A N D P

    E R S O N A L C A R E I N V I E T N A M P a s s p o r t 72 © E u r o m o n i t o r I n t e r n a t i o n a l E-commerce will help men’s grooming penetrate rural areas Offline retailers currently offer a very narrow choice of products specifically for men, even in supermarkets or beauty specialists. The majority of products in such outlets are facial cleansers, bath and shower products and deodorants. However, consumers increasingly expect to see a wider product choice, such as skin care, hair care and other products for men at these retailers. Meanwhile, e-commerce sites such as Lazada, Shopee and Tiki are helping men’s grooming products to reach a wider consumer base across all provinces in Vietnam, with various choices available in terms of brands, products, and scents. Many consumers turned to e-commerce in search of convenience and safer shopping during the pandemic, but the growth of e-commerce is expected to continue in the forecast period, with discount programmes and free shipping fees strongly encouraging consumers to shop online. Moreover, in men’s grooming, as in other areas of beauty and personal care, digitalisation is becoming increasingly visible beyond e-commerce, especially digital marketing. Livestreaming on Facebook and Zalo has become an effective way for leading companies to advertise their products, interact with consumers and enhance their brand reputation. CATEGORY DATA Table 77 Sales of Men’s Grooming by Category: Value 2017-2022 VND billion 2017 2018 2019 2020 2021 2022 - Mass Men's Fragrances 238.9 260.4 280.9 247.2 228.2 241.1 - Premium Men's 509.5 560.4 617.6 531.5 500.0 531.6 Fragrances Men's Fragrances 748.4 820.8 898.4 778.7 728.2 772.7 -- Mass Men's Skin Care 283.2 308.6 324.8 347.8 358.3 371.3 -- Premium Men's Skin 6.6 7.2 8.0 9.2 9.7 10.0 Care - Men's Skin Care 289.8 315.8 332.8 357.0 368.0 381.3 -- Mass Men's Hair Care 1,990.4 2,060.1 2,178.5 2,321.0 2,146.6 2,214.2 -- Premium Men's Hair - - - - - - Care - Men's Hair Care 1,990.4 2,060.1 2,178.5 2,321.0 2,146.6 2,214.2 -- Mass Men's Deodorants 620.9 701.6 788.7 847.7 802.9 846.8 -- Premium Men's - - - - - - Deodorants - Men's Deodorants 620.9 701.6 788.7 847.7 802.9 846.8 -- Mass Men's Bath and 274.5 292.4 316.9 340.8 319.5 355.6 Shower -- Premium Men's Bath - - - - - - and Shower - Men's Bath and Shower 274.5 292.4 316.9 340.8 319.5 355.6 Men's Toiletries 3,175.6 3,369.9 3,616.8 3,866.5 3,637.0 3,797.8 - Men's Razors and Blades 540.0 578.7 614.1 639.9 588.2 612.9 - Men's Pre-Shave 135.6 145.8 155.2 157.9 143.7 155.0 - Men's Post-Shave 8.0 5.5 5.7 5.6 5.2 5.5 Men's Shaving 683.7 730.0 774.9 803.4 737.1 773.4 Men's Grooming 4,607.6 4,920.6 5,290.2 5,448.6 5,102.3 5,343.9 Source: Euromonitor International from official statistics, trade associations, trade press, company research, store checks, trade interviews, trade sources
  80. B E A U T Y A N D P

    E R S O N A L C A R E I N V I E T N A M P a s s p o r t 73 © E u r o m o n i t o r I n t e r n a t i o n a l Table 78 Sales of Men’s Grooming by Category: % Value Growth 2017-2022 % current value growth 2021/22 2017-22 CAGR 2017/22 Total - Mass Men's Fragrances 5.6 0.2 0.9 - Premium Men's Fragrances 6.3 0.9 4.3 Men's Fragrances 6.1 0.6 3.2 -- Mass Men's Skin Care 3.6 5.6 31.1 -- Premium Men's Skin Care 3.1 8.5 50.6 - Men's Skin Care 3.6 5.6 31.6 -- Mass Men's Hair Care 3.1 2.2 11.2 -- Premium Men's Hair Care - - - - Men's Hair Care 3.1 2.2 11.2 -- Mass Men's Deodorants 5.5 6.4 36.4 -- Premium Men's Deodorants - - - - Men's Deodorants 5.5 6.4 36.4 -- Mass Men's Bath and Shower 11.3 5.3 29.5 -- Premium Men's Bath and Shower - - - - Men's Bath and Shower 11.3 5.3 29.5 Men's Toiletries 4.4 3.6 19.6 - Men's Razors and Blades 4.2 2.6 13.5 - Men's Pre-Shave 7.9 2.7 14.3 - Men's Post-Shave 5.6 -7.3 -31.5 Men's Shaving 4.9 2.5 13.1 Men's Grooming 4.7 3.0 16.0 Source: Euromonitor International from official statistics, trade associations, trade press, company research, store checks, trade interviews, trade sources Table 79 Sales of Men's Razors and Blades by Type: % Value Breakdown 2019-2022 % retail value rsp 2019 2020 2021 2022 Disposables 48.8 48.7 48.7 48.5 Systems 49.2 49.4 49.4 49.5 Systems - Razors 20.1 20.3 20.4 20.5 Systems - Refill Blades 29.1 29.1 29.0 29.0 Other Razors and Blades 2.0 1.9 1.9 2.0 Total 100.0 100.0 100.0 100.0 Source: Euromonitor International from official statistics, trade associations, trade press, company research, store checks, trade interviews, trade sources Table 80 Sales of Men's Skin Care by Type: % Value Breakdown 2019-2022 % retail value rsp 2019 2020 2021 2022 Facial Care 97.7 97.6 97.6 97.0 Body Care 2.3 2.4 2.5 3.0 Total 100.0 100.0 100.0 100.0 Source: Euromonitor International from official statistics, trade associations, trade press, company research, store checks, trade interviews, trade sources Table 81 NBO Company Shares of Men’s Grooming: % Value 2018-2022
  81. B E A U T Y A N D P

    E R S O N A L C A R E I N V I E T N A M P a s s p o r t 74 © E u r o m o n i t o r I n t e r n a t i o n a l % retail value rsp Company 2018 2019 2020 2021 2022 International Consumer 20.8 20.1 21.3 20.9 21.2 Products Co Ltd Unza Vietnam Co Ltd 13.7 14.2 15.4 15.4 16.1 Unilever Vietnam 15.0 14.8 14.9 14.8 14.6 International Co Ltd Beiersdorf Vietnam Ltd Co 9.7 10.1 10.4 11.0 11.0 Oral-B (Vietnam) Ltd 8.3 8.5 8.7 8.8 9.0 Coty Beauty Vietnam Co Ltd 5.2 5.5 4.8 4.6 4.6 Croma Pharma GmbH 2.4 2.3 2.3 2.3 2.3 Inter Parfums Asia 1.1 1.2 1.0 1.4 1.5 Pacific Pte Ltd Saigon Cosmetics Corp 1.7 1.7 1.4 1.3 1.2 L'Oréal Vietnam Co Ltd 1.1 1.2 1.1 1.1 1.2 Dai Viet Huong Trading 1.5 1.3 1.2 1.1 1.1 Manufacturing Co Ltd Shiseido Cosmetics 1.1 1.1 1.0 1.0 1.0 Vietnam Co Ltd Dorco Co Ltd 0.9 0.8 0.8 0.8 0.8 Inter Parfums Inc - - - - 0.7 Rohto-Mentholatum Vietnam 0.7 0.6 0.6 0.7 0.7 Co Ltd Chanel SA 0.5 0.6 0.5 0.5 0.6 Edgewell Personal Care 0.7 0.6 0.6 0.6 0.6 Brands LLC Mandom Vietnam Co Ltd 0.4 0.4 0.4 0.4 0.4 Oriflame Vietnam Ltd - - 0.7 0.4 0.4 Kenzo Parfums SA 0.4 0.4 0.3 0.4 0.4 AmorePacific Vietnam JSC 0.1 0.1 0.2 0.2 0.3 LG Vina Cosmetics Co Ltd 0.2 0.1 0.2 0.2 0.2 Colgate-Palmolive 0.3 0.3 0.2 0.2 0.2 (Vietnam) Co Ltd Kao Vietnam Ltd 0.2 0.2 0.2 0.2 0.2 Euroitalia Srl 0.3 0.3 0.2 0.2 0.2 Givenchy SA, Parfums 0.2 0.2 0.2 0.2 0.2 Give Back Beauty LLC - - - - 0.2 Henkel Vietnam Co Ltd 0.1 0.0 0.0 0.0 0.0 Estée Lauder Vietnam Co Ltd 1.0 1.1 0.8 0.9 - Thuong Xuan Cosmetic Co Ltd 1.1 1.2 - - - Others 11.3 10.9 10.5 10.3 9.3 Total 100.0 100.0 100.0 100.0 100.0 Source: Euromonitor International from official statistics, trade associations, trade press, company research, store checks, trade interviews, trade sources Table 82 LBN Brand Shares of Men’s Grooming: % Value 2019-2022 % retail value rsp Brand (GBO) Company (NBO) 2019 2020 2021 2022 X-Men (Marico Ltd) International Consumer 20.1 21.3 20.9 21.2 Products Co Ltd Romano (Wipro Ltd) Unza Vietnam Co Ltd 14.2 15.4 15.4 16.1 Clear Men (Unilever Unilever Vietnam 11.3 11.3 11.2 11.1 Group) International Co Ltd Gillette (Procter & Oral-B (Vietnam) Ltd 6.7 6.9 6.9 7.1 Gamble Co, The)
  82. B E A U T Y A N D P

    E R S O N A L C A R E I N V I E T N A M P a s s p o r t 75 © E u r o m o n i t o r I n t e r n a t i o n a l Nivea Men Deodorant Beiersdorf Vietnam Ltd Co 6.6 6.8 7.0 6.9 (Beiersdorf AG) Nivea Men (Beiersdorf Beiersdorf Vietnam Ltd Co 3.5 3.6 4.0 4.1 AG) Axe (Unilever Group) Unilever Vietnam 2.5 2.5 2.6 2.6 International Co Ltd Croma (STADA Croma Pharma GmbH 2.3 2.3 2.3 2.3 Arzneimittel AG) Gillette Foamy Oral-B (Vietnam) Ltd 1.6 1.7 1.7 1.8 (Procter & Gamble Co, The) Ramus Dai Viet Huong Trading 1.3 1.2 1.1 1.1 Manufacturing Co Ltd adidas classic (Coty Coty Beauty Vietnam Co Ltd 1.2 1.1 1.1 1.1 Inc) Rexona Deodorant For Unilever Vietnam 0.8 0.8 0.9 0.9 Men (Unilever Group) International Co Ltd Davidoff (Coty Inc) Coty Beauty Vietnam Co Ltd 0.9 0.8 0.8 0.8 DKNY Inter Parfums Inc - - - 0.7 Oxy Men (Rohto Rohto-Mentholatum Vietnam 0.6 0.6 0.7 0.7 Pharmaceutical Co Ltd) Co Ltd Giorgio Armani L'Oréal Vietnam Co Ltd 0.7 0.6 0.6 0.7 (L'Oréal Groupe) Coach (Inter Parfums Inter Parfums Asia 0.7 0.6 0.6 0.6 Inc) Pacific Pte Ltd Calvin Klein (Coty Inc) Coty Beauty Vietnam Co Ltd 1.0 0.8 0.6 0.6 Chanel Chanel SA 0.6 0.5 0.5 0.6 Issey Miyake Shiseido Cosmetics 0.6 0.5 0.5 0.5 (Shiseido Co Ltd) Vietnam Co Ltd Lacoste (Coty Inc) Coty Beauty Vietnam Co Ltd 0.6 0.5 0.5 0.5 Burberry (Coty Inc) Coty Beauty Vietnam Co Ltd 0.6 0.5 0.5 0.5 Jean Paul Gaultier Shiseido Cosmetics 0.5 0.5 0.5 0.5 (Puig SL) Vietnam Co Ltd Guess (Inter Parfums Inter Parfums Asia 0.5 0.4 0.4 0.4 Inc) Pacific Pte Ltd TJ Dorco Co Ltd 0.5 0.4 0.4 0.4 Hugo Boss (Coty Inc) Coty Beauty Vietnam Co Ltd 0.5 0.4 0.4 0.4 Gatsby (Mandom Corp) Mandom Vietnam Co Ltd 0.4 0.4 0.4 0.4 Dorco Dorco Co Ltd 0.4 0.4 0.4 0.4 Kenzo (LVMH Moët Kenzo Parfums SA 0.4 0.3 0.4 0.4 Hennessy Louis Vuitton SA) Wilkinson Edgewell Personal Care 0.4 0.3 0.3 0.3 Brands LLC DKNY (Estée Lauder Estée Lauder Vietnam Co Ltd 0.9 0.7 0.7 - Cos Inc) Salvatore Ferragamo Salvatore Ferragamo SpA 0.4 0.3 - - Oriflame (Oriflame Thuong Xuan Cosmetic Co Ltd 1.0 - - - Cosmetics SA) Others Others 15.8 15.3 15.5 14.5 Total Total 100.0 100.0 100.0 100.0 Source: Euromonitor International from official statistics, trade associations, trade press, company research, store checks, trade interviews, trade sources Table 83 LBN Brand Shares of Men's Razors and Blades: % Value 2019-2022 % retail value rsp Brand (GBO) Company (NBO) 2019 2020 2021 2022
  83. B E A U T Y A N D P

    E R S O N A L C A R E I N V I E T N A M P a s s p o r t 76 © E u r o m o n i t o r I n t e r n a t i o n a l Gillette (Procter & Oral-B (Vietnam) Ltd 56.4 57.4 58.7 60.6 Gamble Co, The) Croma (STADA Croma Pharma GmbH 20.2 20.0 19.6 19.6 Arzneimittel AG) TJ Dorco Co Ltd 3.9 3.8 3.7 3.7 Dorco Twin Dorco Co Ltd 3.2 3.2 3.2 3.2 Wilkinson Edgewell Personal Care 3.3 3.0 2.9 3.0 Brands LLC Wilkinson Energizer Holdings Inc - - - - Bic Société Bic SA - - - - Others Others 13.0 12.7 11.9 9.9 Total Total 100.0 100.0 100.0 100.0 Source: Euromonitor International from official statistics, trade associations, trade press, company research, store checks, trade interviews, trade sources Table 84 Forecast Sales of Men’s Grooming by Category: Value 2022-2027 VND billion 2022 2023 2024 2025 2026 2027 - Mass Men's Fragrances 241.1 250.9 260.1 267.8 274.6 280.5 - Premium Men's 531.6 566.4 604.3 647.6 696.2 751.1 Fragrances Men's Fragrances 772.7 817.2 864.4 915.3 970.8 1,031.5 -- Mass Men's Skin Care 371.3 375.3 382.9 397.2 416.1 437.6 -- Premium Men's Skin 10.0 10.3 10.7 11.1 11.5 12.1 Care - Men's Skin Care 381.3 385.6 393.6 408.3 427.7 449.7 -- Mass Men's Hair Care 2,214.2 2,320.5 2,443.7 2,580.6 2,730.4 2,896.5 -- Premium Men's Hair - - - - - - Care - Men's Hair Care 2,214.2 2,320.5 2,443.7 2,580.6 2,730.4 2,896.5 -- Mass Men's Deodorants 846.8 877.1 922.9 980.1 1,055.0 1,142.5 -- Premium Men's - - - - - - Deodorants - Men's Deodorants 846.8 877.1 922.9 980.1 1,055.0 1,142.5 -- Mass Men's Bath and 355.6 384.6 416.1 450.4 488.2 530.4 Shower -- Premium Men's Bath - - - - - - and Shower - Men's Bath and Shower 355.6 384.6 416.1 450.4 488.2 530.4 Men's Toiletries 3,797.8 3,967.9 4,176.2 4,419.4 4,701.3 5,019.1 - Men's Razors and Blades 612.9 640.2 671.1 705.3 745.6 789.4 - Men's Pre-Shave 155.0 160.4 165.5 170.5 175.2 180.0 - Men's Post-Shave 5.5 5.7 5.9 6.2 6.5 6.8 Men's Shaving 773.4 806.2 842.5 882.0 927.3 976.2 Men's Grooming 5,343.9 5,591.3 5,883.1 6,216.7 6,599.5 7,026.8 Source: Euromonitor International from trade associations, trade press, company research, trade interviews, trade sources Table 85 Forecast Sales of Men’s Grooming by Category: % Value Growth 2022-2027 % constant value growth 2022/2023 2022-27 CAGR 2022/27 Total - Mass Men's Fragrances 4.1 3.1 16.3 - Premium Men's Fragrances 6.5 7.2 41.3
  84. B E A U T Y A N D P

    E R S O N A L C A R E I N V I E T N A M P a s s p o r t 77 © E u r o m o n i t o r I n t e r n a t i o n a l Men's Fragrances 5.8 5.9 33.5 -- Mass Men's Skin Care 1.1 3.3 17.9 -- Premium Men's Skin Care 3.1 3.9 20.9 - Men's Skin Care 1.1 3.4 17.9 -- Mass Men's Hair Care 4.8 5.5 30.8 -- Premium Men's Hair Care - - - - Men's Hair Care 4.8 5.5 30.8 -- Mass Men's Deodorants 3.6 6.2 34.9 -- Premium Men's Deodorants - - - - Men's Deodorants 3.6 6.2 34.9 -- Mass Men's Bath and Shower 8.1 8.3 49.2 -- Premium Men's Bath and Shower - - - - Men's Bath and Shower 8.1 8.3 49.2 Men's Toiletries 4.5 5.7 32.2 - Men's Razors and Blades 4.4 5.2 28.8 - Men's Pre-Shave 3.5 3.0 16.1 - Men's Post-Shave 3.1 4.5 24.5 Men's Shaving 4.2 4.8 26.2 Men's Grooming 4.6 5.6 31.5 Source: Euromonitor International from trade associations, trade press, company research, trade interviews, trade sources
  85. B E A U T Y A N D P

    E R S O N A L C A R E I N V I E T N A M P a s s p o r t 78 © E u r o m o n i t o r I n t e r n a t i o n a l ORAL CARE IN VIETNAM - CATEGORY ANALYSIS KEY DATA FINDINGS ▪ Retail value sales grow by 5% in current terms in 2022 to VND8.0 trillion ▪ Mouthwashes/dental rinses is the best performing category in 2022, with retail value sales rising by 7% in current terms to VND510 billion ▪ Unilever Vietnam International Co Ltd is the leading player in 2022, with a retail value share of 42% ▪ Retail sales are set to rise at a current value CAGR of 6% (2022 constant value CAGR of 2%) over the forecast period to VND10.7 trillion 2022 DEVELOPMENTS Oral care posts stable growth in Vietnam as awareness of oral hygiene rises Rising health awareness and recognition of the need to maintain high dental hygiene helped oral care register current value growth throughout the pandemic, and this continued in 2022, although at a slightly slower rate. Growth was also supported by increasing product diversity and expansion in rural areas. In addition, the government has been paying attention to oral diseases, and running more activities in the community to raise consumers’ awareness and provide correct knowledge of how to maintain good oral hygiene. In 2022, the Ministry of Health announced that dental diseases are common in Vietnam, and have consequences on one’s health, which raised consumers’ awareness of the need for oral care. Growth was particularly supported by younger consumers, as social media encouraged good oral hygiene and the use of different kinds of oral care products to have whiter teeth and fresh breath. This explains the dynamic growth of mouthwashes/dental rinses from a low base over recent years, while the more mature categories of manual toothbrushes and toothpaste saw slower and more stable growth rates. Unilever maintains its leading position Unilever Vietnam International Co Ltd, Colgate-Palmolive (Vietnam) Co Ltd, and Oral-B (Vietnam) Ltd continued to dominate oral care in Vietnam in value terms in 2022, together accounting for more than three quarters of sales. These players leverage wide distribution networks, strong finances, new launches, and dynamic marketing activities to stay clear of the field. While Unilever’s Closeup brand mainly focuses on “Cool Fresh Breath” in its marketing activities, its P/S brand, which was also the leader in oral care in 2022, adapts to various consumer needs – offering various products with added value, such as herbs, pink salt and green tea, and different types of functions, such as whitening within seven days, and to protect against sensitive teeth. Unilever is also very active in terms of marketing activities on social media, as well as cooperating with retailers to offer discounts, toothbrushes, or mini-sized mouthwash as gifts. Its Closeup mini-games mainly target special days for couples, such as Valentine’s Day. The brand also runs outdoor marketing activities, such as Smile Detox, whereby free samples of whitening toothpaste were offered for consumers to try and see their
  86. B E A U T Y A N D P

    E R S O N A L C A R E I N V I E T N A M P a s s p o r t 79 © E u r o m o n i t o r I n t e r n a t i o n a l efficacy. Colgate is also very active in Vietnam. At the end of 2022 it introduced a dental whitening kit with a simple design which is easy to use, and claims to make teeth whiter after three weeks. It also offers various combo discounts via e-commerce, such as Shopee and Lazada, for double-day sales. Whitening and sensitivity remain key features Strongly influenced by media content, young Vietnamese consumers are seeking whiter teeth, and this is leading to rising demand for this value-added feature in toothpaste, with an increasing share of sales accounted for by whitening toothpaste. Besides, sensitive teeth is also a problem faced by many consumers, and for this reason they prefer toothpastes such as Sensodyne and P/S Sensitive Mineral Expert, which are targeted to relieve sensitivity. Recently, imported products from Thailand and Korea offering such features have also been displayed more widely via both online and offline channels, driving more competition in these segments. Nevertheless, traditional/standard/basic toothpaste still dominated sales in Vietnam in 2022. PROSPECTS AND OPPORTUNITIES Oral care expected to continue growing in the coming years Oral care has potential for continued growth in the forecast period, supported by consumers’ need to maintain high personal hygiene standards, including dental hygiene. With rising disposable incomes and increasing knowledge, consumers are expected to pay more attention to a broader range of oral care products. Brands are also offering a wider range of oral care products in the market, such as power toothbrushes, home teeth whitening kits, and water flossers. Products with value added features are expected to bring more variety to the market and offer a wider choice for consumers. Meanwhile, products such as mouthwashes/dental rinses are increasingly seen as a must-have for daily oral care, and this category is set to continue to see the highest growth in the forecast period. Listerine was the leading brand in 2022, but a wider choice of products which show clear efficacy is expected. Whitening likely to remain an important feature With more people paying attention to their appearance, especially their smile, partly due to social media, it is not only younger consumers who are likely to prioritise whitening in oral care, but also older consumers. As income levels are expected to grow in the coming years, consumers are expected to have more purchasing power to try innovative offerings in this space, such as whitening kits. However, brands will also need to raise consumer awareness and knowledge about such products. Meanwhile, the niche of children’s oral care has not seen much innovation, with limited product diversity in the country. For instance, toothpastes for children mainly offer fruit flavours such as strawberry and grape. Hence, there is potential for players to explore this space. Players are likely to increasingly look to offer more natural and herbal offerings to meet consumers’ demand for healthier options and compete in the category. Consumers in Vietnam have already been attracted to herbal formulations containing ingredients such as mint, charcoal, clover, cinnamon, ginger, and areca nut, and more such launches are expected in the forecast period. Offline channels will continue to dominate When it comes to basic oral care products such as manual toothbrushes and toothpaste, consumers still have the habit of buying them at convenience stores or small local grocers as
  87. B E A U T Y A N D P

    E R S O N A L C A R E I N V I E T N A M P a s s p o r t 80 © E u r o m o n i t o r I n t e r n a t i o n a l needed, or along with their grocery shopping trip at supermarkets or hypermarkets. Therefore, offline channels are expected to retain their importance. The rapid expansion of mini supermarkets such as Bach Hoa Xanh and Winmart into suburban areas is also expected to contribute to growth in offline sales of oral care products in Vietnam. For high-end products such as electric toothbrushes, whitening kits, and water flossers, since their unit prices are relatively high, but these products are fairly new in the market, consumers are still not sure about their efficacy. They will need consultants/advisers to advise on these products, and are expected to shop in trusted offline retailers. With such strength for offline channels, e-commerce has not managed to gain a significant share of sales, with its share in oral care the lowest of any beauty and personal care category in 2022. CATEGORY DATA Table 86 Sales of Oral Care by Category: Value 2017-2022 VND billion 2017 2018 2019 2020 2021 2022 Toothpaste 3,800.5 3,876.5 4,031.6 4,434.7 4,805.1 5,064.0 - Power Toothbrushes - - - - - - - Manual Toothbrushes 1,844.7 1,881.6 1,992.2 2,151.5 2,289.9 2,406.4 Toothbrushes 1,844.7 1,881.6 1,992.2 2,151.5 2,289.9 2,406.4 Tooth Whiteners - - - - - - Mouthwashes/Dental Rinses 336.2 361.4 385.0 431.1 475.6 509.7 Mouth Fresheners - - - - - - Denture Care - - - - - - Dental Floss - - - - - - Oral Care 5,981.3 6,119.4 6,408.7 7,017.3 7,570.6 7,980.1 Source: Euromonitor International from official statistics, trade associations, trade press, company research, store checks, trade interviews, trade sources Note: Oral Care total excludes the category total for manual and power toothbrushes Table 87 Sales of Oral Care by Category: % Value Growth 2017-2022 % current value growth 2021/22 2017-22 CAGR 2017/22 Total Toothpaste 5.4 5.9 33.2 - Power Toothbrushes - - - - Manual Toothbrushes 5.1 5.5 30.5 Toothbrushes 5.1 5.5 30.5 Tooth Whiteners - - - Mouthwashes/Dental Rinses 7.2 8.7 51.6 Mouth Fresheners - - - Denture Care - - - Dental Floss - - - Oral Care 5.4 5.9 33.4 Source: Euromonitor International from official statistics, trade associations, trade press, company research, store checks, trade interviews, trade sources Note: Oral Care total excludes the category total for manual and power toothbrushes Table 88 Sales of Toothbrushes by Category: Value 2017-2022
  88. B E A U T Y A N D P

    E R S O N A L C A R E I N V I E T N A M P a s s p o r t 81 © E u r o m o n i t o r I n t e r n a t i o n a l VND billion 2017 2018 2019 2020 2021 2022 --- Electric Toothbrush - - - - - - Units --- Electric Toothbrush - - - - - - Replacement Heads -- Electric Toothbrushes - - - - - - --- Battery Toothbrush - - - - - - Units --- Battery Toothbrush - - - - - - Replacement Heads -- Battery Toothbrushes - - - - - - - Power Toothbrushes - - - - - - - Manual Toothbrushes 1,844.7 1,881.6 1,992.2 2,151.5 2,289.9 2,406.4 Toothbrushes 1,844.7 1,881.6 1,992.2 2,151.5 2,289.9 2,406.4 Source: Euromonitor International from official statistics, trade associations, trade press, company research, store checks, trade interviews, trade sources Table 89 Sales of Toothbrushes by Category: % Value Growth 2017-2022 % current value growth 2021/22 2017-22 CAGR 2017/22 Total --- Electric Toothbrush Units - - - --- Electric Toothbrush Replacement Heads - - - -- Electric Toothbrushes - - - --- Battery Toothbrush Units - - - --- Battery Toothbrush Replacement Heads - - - -- Battery Toothbrushes - - - - Power Toothbrushes - - - - Manual Toothbrushes 5.1 5.5 30.5 Toothbrushes 5.1 5.5 30.5 Source: Euromonitor International from official statistics, trade associations, trade press, company research, store checks, trade interviews, trade sources Table 90 Sales of Toothpaste by Type: % Value Breakdown 2018-2022 % retail value rsp 2018 2019 2020 2021 2022 Traditional/Standard/Basic 60.2 59.6 59.4 59.3 59.0 Total Care/Complete Care 5.0 5.1 5.0 5.0 5.3 Whitening 12.8 12.8 13.0 13.1 13.1 Fresh Breath 3.9 4.0 4.1 4.1 4.2 Children's 3.0 3.1 3.1 3.2 3.2 Sensitive 3.5 3.7 3.8 3.9 4.0 Gum Health 11.7 11.7 11.6 11.5 11.2 Total 100.0 100.0 100.0 100.0 100.0 Source: Euromonitor International from official statistics, trade associations, trade press, company research, store checks, trade interviews, trade sources Table 91 NBO Company Shares of Oral Care: % Value 2018-2022 % retail value rsp
  89. B E A U T Y A N D P

    E R S O N A L C A R E I N V I E T N A M P a s s p o r t 82 © E u r o m o n i t o r I n t e r n a t i o n a l Company 2018 2019 2020 2021 2022 Unilever Vietnam 43.0 41.5 42.2 42.4 42.4 International Co Ltd Colgate-Palmolive 21.3 21.5 21.7 21.8 22.2 (Vietnam) Co Ltd Oral-B (Vietnam) Ltd 12.3 12.5 12.3 12.2 12.2 GlaxoSmithKline Plc 4.3 4.9 5.0 5.2 5.5 Amway Vietnam Co Ltd 2.4 2.5 2.3 2.3 2.3 Johnson & Johnson Vietnam 0.8 0.8 0.9 1.0 1.0 Co Ltd Nu Skin Vietnam Co Ltd 0.5 0.7 0.7 0.7 0.9 Jordan AS 0.9 0.9 0.9 0.9 0.9 LG Vina Cosmetics Co Ltd 0.7 0.7 0.6 0.6 0.6 Dai Viet Huong Trading 0.6 0.6 0.6 0.6 0.6 Manufacturing Co Ltd Aloe Trading Co Ltd 0.6 0.7 0.7 0.6 0.6 Lion Corp 0.7 0.5 0.4 0.4 0.4 Procter & Gamble Vietnam 0.1 0.1 0.1 0.1 0.1 Ltd Thuong Xuan Cosmetic Co Ltd 0.1 0.1 - - - Daso Group - - - - - Others 11.6 11.9 11.5 11.2 10.4 Total 100.0 100.0 100.0 100.0 100.0 Source: Euromonitor International from official statistics, trade associations, trade press, company research, store checks, trade interviews, trade sources Table 92 LBN Brand Shares of Oral Care: % Value 2019-2022 % retail value rsp Brand (GBO) Company (NBO) 2019 2020 2021 2022 P/S (Unilever Group) Unilever Vietnam 29.6 29.7 29.8 29.5 International Co Ltd Colgate (Colgate- Colgate-Palmolive 18.1 18.4 18.4 18.7 Palmolive Co) (Vietnam) Co Ltd Closeup (Unilever Unilever Vietnam 11.9 12.5 12.7 12.9 Group) International Co Ltd Oral-B (Procter & Oral-B (Vietnam) Ltd 12.5 12.3 12.2 12.2 Gamble Co, The) Sensodyne (Haleon plc) GlaxoSmithKline Plc - - - 4.2 Darlie (Colgate- Colgate-Palmolive 2.9 2.9 2.9 2.9 Palmolive Co) (Vietnam) Co Ltd Glister (Amway Corp) Amway Vietnam Co Ltd 2.5 2.3 2.3 2.3 Aquafresh (Haleon plc) GlaxoSmithKline Plc - - - 1.2 Listerine (Johnson & Johnson & Johnson Vietnam 0.8 0.9 1.0 1.0 Johnson Inc) Co Ltd Nu Skin (Nu Skin Nu Skin Vietnam Co Ltd 0.7 0.7 0.7 0.9 Enterprises Inc) Jordan (Orkla Group) Jordan AS 0.9 0.9 0.9 0.9 Doreen Dai Viet Huong Trading 0.6 0.6 0.6 0.6 Manufacturing Co Ltd Forever Bright Aloe Trading Co Ltd 0.7 0.7 0.6 0.6 (Forever Living Products International LLC) Colgate Plax (Colgate- Colgate-Palmolive 0.5 0.5 0.6 0.6 Palmolive Co) (Vietnam) Co Ltd Atman (LG Household & LG Vina Cosmetics Co Ltd 0.5 0.5 0.5 0.5
  90. B E A U T Y A N D P

    E R S O N A L C A R E I N V I E T N A M P a s s p o r t 83 © E u r o m o n i t o r I n t e r n a t i o n a l Health Care Ltd) Kodomo Lion Corp 0.3 0.3 0.3 0.3 Bamboo Salt (LG LG Vina Cosmetics Co Ltd 0.1 0.1 0.1 0.1 Household & Health Care Ltd) Crest (Procter & Procter & Gamble Vietnam 0.1 0.1 0.1 0.1 Gamble Co, The) Ltd Fresh & White Lion Corp 0.1 0.1 0.1 0.1 Sensodyne GlaxoSmithKline Plc 3.7 3.8 3.9 - Aquafresh GlaxoSmithKline Plc 1.2 1.2 1.2 - Oriflame (Oriflame Thuong Xuan Cosmetic Co Ltd 0.1 - - - Cosmetics SA) Zact Lion Corp 0.0 - - - Dacco Daso Group - - - - Lucky (LG Household & LG Vina Cosmetics Co Ltd - - - - Health Care Ltd) Fluocaril (Procter & Procter & Gamble Vietnam - - - - Gamble Co, The) Ltd Others Others 11.9 11.5 11.2 10.4 Total Total 100.0 100.0 100.0 100.0 Source: Euromonitor International from official statistics, trade associations, trade press, company research, store checks, trade interviews, trade sources Table 93 LBN Brand Shares of Mouthwashes/Dental Rinses: % Value 2019-2022 % retail value rsp Brand (GBO) Company (NBO) 2019 2020 2021 2022 Listerine (Johnson & Johnson & Johnson Vietnam 13.3 14.9 15.5 16.0 Johnson Inc) Co Ltd Colgate Plax (Colgate- Colgate-Palmolive 8.1 8.5 9.0 9.1 Palmolive Co) (Vietnam) Co Ltd P/S Mouthwash Unilever Vietnam 6.0 6.5 6.9 7.0 (Unilever Group) International Co Ltd T-B Traphaco JSC 0.9 0.9 0.9 0.9 Oral-B (Procter & Oral-B (Vietnam) Ltd - - - - Gamble Co, The) Others Others 71.7 69.3 67.7 67.1 Total Total 100.0 100.0 100.0 100.0 Source: Euromonitor International from official statistics, trade associations, trade press, company research, store checks, trade interviews, trade sources Table 94 LBN Brand Shares of Toothpaste: % Value 2019-2022 % retail value rsp Brand (GBO) Company (NBO) 2019 2020 2021 2022 P/S (Unilever Group) Unilever Vietnam 39.1 38.9 38.8 38.2 International Co Ltd Closeup (Unilever Unilever Vietnam 18.9 19.7 20.0 20.3 Group) International Co Ltd Colgate (Colgate- Colgate-Palmolive 13.6 13.9 14.0 14.2 Palmolive Co) (Vietnam) Co Ltd Sensodyne (Haleon plc) GlaxoSmithKline Plc - - - 6.7 Darlie (Colgate- Colgate-Palmolive 4.6 4.5 4.5 4.6 Palmolive Co) (Vietnam) Co Ltd Glister (Amway Corp) Amway Vietnam Co Ltd 4.0 3.7 3.6 3.6
  91. B E A U T Y A N D P

    E R S O N A L C A R E I N V I E T N A M P a s s p o r t 84 © E u r o m o n i t o r I n t e r n a t i o n a l Aquafresh (Haleon plc) GlaxoSmithKline Plc - - - 1.9 Nu Skin (Nu Skin Nu Skin Vietnam Co Ltd 1.1 1.1 1.1 1.4 Enterprises Inc) Doreen Dai Viet Huong Trading 1.0 1.0 1.0 1.0 Manufacturing Co Ltd Forever Bright Aloe Trading Co Ltd 1.1 1.1 0.9 0.9 (Forever Living Products International LLC) Kodomo Lion Corp 0.6 0.4 0.4 0.4 Bamboo Salt (LG LG Vina Cosmetics Co Ltd 0.2 0.2 0.2 0.2 Household & Health Care Ltd) Crest (Procter & Procter & Gamble Vietnam 0.2 0.2 0.2 0.2 Gamble Co, The) Ltd Fresh & White Lion Corp 0.2 0.2 0.2 0.2 Oriflame (Oriflame Oriflame Vietnam Ltd - 0.1 0.1 0.1 Cosmetics SA) Sensodyne GlaxoSmithKline Plc 5.9 6.0 6.2 - Aquafresh GlaxoSmithKline Plc 1.8 1.8 1.9 - Oriflame (Oriflame Thuong Xuan Cosmetic Co Ltd 0.2 - - - Cosmetics SA) Zact Lion Corp 0.1 - - - Dacco Daso Group - - - - Lucky Anti-Cavity For LG Vina Cosmetics Co Ltd - - - - Kids (LG Household & Health Care Ltd) Oral-B (Procter & Oral-B (Vietnam) Ltd - - - - Gamble Co, The) Fluocaril KM 2x1 Procter & Gamble Vietnam - - - - (Procter & Gamble Co, Ltd The) Others Others 7.4 7.1 7.0 6.1 Total Total 100.0 100.0 100.0 100.0 Source: Euromonitor International from official statistics, trade associations, trade press, company research, store checks, trade interviews, trade sources Table 95 Forecast Sales of Oral Care by Category: Value 2022-2027 VND billion 2022 2023 2024 2025 2026 2027 Toothpaste 5,064.0 5,132.2 5,200.2 5,265.3 5,321.1 5,373.1 - Power Toothbrushes - - - - - - - Manual Toothbrushes 2,406.4 2,461.4 2,527.7 2,597.8 2,672.3 2,752.4 Toothbrushes 2,406.4 2,461.4 2,527.7 2,597.8 2,672.3 2,752.4 Tooth Whiteners - - - - - - Mouthwashes/Dental Rinses 509.7 538.5 566.2 594.1 619.8 644.0 Mouth Fresheners - - - - - - Denture Care - - - - - - Dental Floss - - - - - - Oral Care 7,980.1 8,132.1 8,294.1 8,457.1 8,613.2 8,769.6 Source: Euromonitor International from trade associations, trade press, company research, trade interviews, trade sources Note: Oral Care total excludes the category total for manual and power toothbrushes Table 96 Forecast Sales of Oral Care by Category: % Value Growth 2022-2027
  92. B E A U T Y A N D P

    E R S O N A L C A R E I N V I E T N A M P a s s p o r t 85 © E u r o m o n i t o r I n t e r n a t i o n a l % constant value growth 2022/2023 2022-27 CAGR 2022/27 Total Toothpaste 1.3 1.2 6.1 - Power Toothbrushes - - - - Manual Toothbrushes 2.3 2.7 14.4 Toothbrushes 2.3 2.7 14.4 Tooth Whiteners - - - Mouthwashes/Dental Rinses 5.7 4.8 26.4 Mouth Fresheners - - - Denture Care - - - Dental Floss - - - Oral Care 1.9 1.9 9.9 Source: Euromonitor International from trade associations, trade press, company research, trade interviews, trade sources Note: Oral Care total excludes the category total for manual and power toothbrushes Table 97 Forecast Sales of Toothbrushes by Category: Value 2022-2027 VND billion 2022 2023 2024 2025 2026 2027 --- Electric Toothbrush - - - - - - Units --- Electric Toothbrush - - - - - - Replacement Heads -- Electric Toothbrushes - - - - - - --- Battery Toothbrush - - - - - - Units --- Battery Toothbrush - - - - - - Replacement Heads -- Battery Toothbrushes - - - - - - - Power Toothbrushes - - - - - - - Manual Toothbrushes 2,406.4 2,461.4 2,527.7 2,597.8 2,672.3 2,752.4 Toothbrushes 2,406.4 2,461.4 2,527.7 2,597.8 2,672.3 2,752.4 Source: Euromonitor International from trade associations, trade press, company research, trade interviews, trade sources Table 98 Forecast Sales of Toothbrushes by Category: % Value Growth 2022-2027 % constant value growth 2022/2023 2022-27 CAGR 2022/27 Total --- Electric Toothbrush Units - - - --- Electric Toothbrush Replacement Heads - - - -- Electric Toothbrushes - - - --- Battery Toothbrush Units - - - --- Battery Toothbrush Replacement Heads - - - -- Battery Toothbrushes - - - - Power Toothbrushes - - - - Manual Toothbrushes 2.3 2.7 14.4 Toothbrushes 2.3 2.7 14.4 Source: Euromonitor International from trade associations, trade press, company research, trade interviews, trade sources
  93. B E A U T Y A N D P

    E R S O N A L C A R E I N V I E T N A M P a s s p o r t 86 © E u r o m o n i t o r I n t e r n a t i o n a l
  94. B E A U T Y A N D P

    E R S O N A L C A R E I N V I E T N A M P a s s p o r t 87 © E u r o m o n i t o r I n t e r n a t i o n a l SKIN CARE IN VIETNAM - CATEGORY ANALYSIS KEY DATA FINDINGS ▪ Retail value sales rise by 8% in current terms in 2022 to VND21.4 trillion ▪ Body care is the best performing category in 2022, with retail value sales growing by 9% in current terms to VND1.4 trillion ▪ Shiseido Cosmetics Vietnam Co Ltd is the leading player in 2022, with a retail value share of 10% ▪ Retail sales are set to grow at a current value CAGR of 10% (2022 constant value CAGR of 6%) over the forecast period to VND34.8 trillion 2022 DEVELOPMENTS Rising knowledge of skin health drives solid growth in skin care in 2022 Skin care in Vietnam continued to record current value growth in 2022, driven mostly by younger consumers, who have started to take care of their skin earlier than previous generations, and are actively seeking skin care knowledge due to the impact of social media. However, with growing awareness about one’s health and skin health, consumers are becoming more careful when considering purchasing skin care products. They prioritise large, well-known and trusted brands, which makes it hard for small new brands to compete in the market. Therefore, international companies led the way in 2022, with L'Oréal Vietnam Co Ltd, Unilever Vietnam International Co Ltd, LG Vina Cosmetics Co Ltd, AmorePacific Vietnam JSC, Beiersdorf Vietnam Ltd Co, and Estée Lauder Vietnam Co Ltd following the leader Shiseido Cosmetics Vietnam Co Ltd. The preference for global or international brands lies in many local consumers’ belief that foreign products offer better quality than local alternatives. Therefore, they tend to be willing to pay higher prices for the perceived higher quality of international skin care brands. Skinimalism is A key trend Simple and minimal skin care (skinimalism) routines continue to be the top choice for consumers – especially given their increasingly busy lifestyles. The basic steps usually include cleansing, moisturising, and sun protection. Brands were also observed catching on to this trend – offering combo gifts that include mini versions of these products. L’Oréal, for example, offers 30% discount plus a three-item combo gift of make-up remover, moisturiser and sun care, when consumers interact with its Facebook posts. With the skinimalism trend, consumers are actively looking for the few products that they use to be effective, and also potentially endorsed by trusted certifications or experts. At the end of the review period brands were therefore observed boosting their marketing activities in this regard. For example, on its social media posts L’Oréal actively shows recommendations and endorsements from experts on the quality of its products.
  95. B E A U T Y A N D P

    E R S O N A L C A R E I N V I E T N A M P a s s p o r t 88 © E u r o m o n i t o r I n t e r n a t i o n a l Livestreaming and occasion marketing used to attract consumers Many leading skin care players, including Shiseido Cosmetics, Estée Lauder Vietnam, and L'Oréal Vietnam, are active in digital marketing. Huge numbers of users make Facebook and TikTok highly popular social networks for companies looking to engage consumers, advertise brands and products, and enhance their brand reputation digitally. Social media activities have been boosted by global brands in particular, which has made e-commerce very competitive. Livestreaming with famous skin care experts or influencers, giving deep discounts, gifting during livestreams, and mini games, are tools used by brands. Brands have also been observed to tap into occasion marketing for product launches. For example, Shiseido introduced an improved version of its Ultimune series, which claims to enhance vitality for facial skin, especially around the eyes. Amongst its online activities, the brand tapped into occasion marketing around Lunar New Year to promote its product. In mass skin care, for International Women's Day 2022 L’Oréal introduced Glycolic-Bright serum with AHA, which claims to help whiten, tone, and reduce dark spots. This was exciting for younger consumers, since the price point is considered value for money. The brand is available via L'Oréal Paris stores on LazMall and ShopeeMall, and via the brand’s official website. PROSPECTS AND OPPORTUNITIES Skin care set to register dynamic growth over the forecast period Skin care still has a great deal of growth potential in Vietnam. Over the forecast period a double-digit current value CAGR is expected, supported by rising disposable incomes, further penetration of rural areas, and a continued focus on appearance at work and socially, as well as growing awareness of the importance of health and wellbeing. Young people especially are being highly impacted by social media, continuously changing their make-up style, which is also encouraging them to use skin care products to take better care of their skin. Moreover, the influence of South Korean, Japanese and Western cultures is predicted to see more regional, international and global trends penetrate skin care in Vietnam, as more consumers pay attention to their appearance and wellbeing. The development of modern retailers is also expected to contribute to the growth of skin care in Vietnam in the forecast period, as retailers expand their reach to rural areas, such as the pharmacies Pharmacity, Long Chau and An Khang, which offer a wide variety of skin care products. Anti-ageing products likely to have opportunities for growth Consumers’ desire to manage the visible signs of ageing presents the opportunity for players to introduce facial care products with attributes that can slow the visible signs of ageing. Brands’ social media activities are already raising awareness of the need to take care of the skin when reaching 25 years of age, to reduce the effects of ageing, while the ageing population in the country will also contribute to growth. Skin rejuvenation products with enzymes are therefore gaining popularity. For instance, Murad Night Fix Enzyme Treatment For Tired Skin claims to minimise wrinkles, replenish moisture, and revive youthfulness. Mandelic acid, which is considered to be a gentler alpha hydroxy acid (AHA), is also being observed in facial skin care products in the market. As a result of the higher need and demand for anti-agers, more international and domestic companies are set to invest in launching new products to meet the needs and preferences of consumers.
  96. B E A U T Y A N D P

    E R S O N A L C A R E I N V I E T N A M P a s s p o r t 89 © E u r o m o n i t o r I n t e r n a t i o n a l Shoppertainment expected to be explored further in the forecast period Over the review period skin care saw significant growth in sales via retail e-commerce, and this is set to continue in the forecast period. Owners of both premium and mass brands regularly launch promotional campaigns featuring discounts of up to 50%, or free gifts, such as handbags and skin care products, via online channels, including e-commerce, each month. Importantly, e- commerce is expected to continue to develop and grow strongly over the forecast period as the government in Vietnam has launched new regulations to boost sales via the channel. Thus, sales and marketing trajectories are set to continue to move in the direction of e-commerce in the short to medium term. Digital marketing will also continue to be developed as a key tool to reach consumers. Shoppertainment – the blending of online shopping and entertainment – is expected to become more popular in the coming years, and is predicted to play an important role in skin care. Digital engagement activities such as livestreaming via social networks including Facebook and TikTok are being explored by brands and e-commerce platforms to boost online sales and also drive consumer stickiness to online shopping. CATEGORY DATA Table 99 Sales of Skin Care by Category: Value 2017-2022 VND billion 2017 2018 2019 2020 2021 2022 - Mass Skin Care Sets/ 307.8 373.7 446.3 515.4 562.6 610.1 Kits - Premium Skin Care 100.3 121.0 132.8 124.0 126.9 136.4 Sets/Kits Skin Care Sets/Kits 408.1 494.8 579.1 639.4 689.4 746.5 - Mass Hand Care 101.1 110.9 122.5 135.8 147.9 158.6 - Premium Hand Care 23.2 24.9 27.3 30.2 32.3 34.2 Hand Care 124.3 135.7 149.8 166.1 180.2 192.8 -- Mass Toners 324.1 362.5 406.7 474.9 523.8 571.8 -- Premium Toners 354.9 402.1 440.4 444.2 458.8 482.3 - Toners 679.0 764.6 847.1 919.1 982.6 1,054.1 -- Mass Lip Care 277.7 308.8 349.2 373.1 394.4 419.0 -- Premium Lip Care - - - - - - - Lip Care 277.7 308.8 349.2 373.1 394.4 419.0 --- Mass Anti-Agers 746.6 834.0 933.5 1,086.2 1,185.7 1,287.9 --- Premium Anti-Agers 1,521.1 1,777.5 2,039.5 2,158.0 2,276.7 2,399.5 -- Anti-Agers 2,267.7 2,611.5 2,972.9 3,244.2 3,462.4 3,687.4 --- Mass Basic 2,910.1 3,251.0 3,630.7 4,202.2 4,604.1 5,002.5 Moisturisers --- Premium Basic 2,315.5 2,656.5 2,995.0 3,233.4 3,485.4 3,673.3 Moisturisers -- Basic Moisturisers 5,225.6 5,907.5 6,625.7 7,435.5 8,089.5 8,675.8 - Moisturisers And 7,493.3 8,519.0 9,598.6 10,679.8 11,551.9 12,363.1 Treatments --- Mass Facial - - - - - - Cleansing Wipes --- Premium Facial - - - - - - Cleansing Wipes -- Facial Cleansing Wipes - - - - - - --- Mass Liquid/Cream/ 2,260.4 2,353.3 2,513.5 2,826.9 3,081.3 3,352.5 Gel/Bar Cleansers --- Premium Liquid/ 466.8 521.1 583.1 631.6 685.0 738.6
  97. B E A U T Y A N D P

    E R S O N A L C A R E I N V I E T N A M P a s s p o r t 90 © E u r o m o n i t o r I n t e r n a t i o n a l Cream/Gel/Bar Cleansers -- Liquid/Cream/Gel/Bar 2,727.1 2,874.4 3,096.6 3,458.5 3,766.2 4,091.1 Cleansers - Facial Cleansers 2,727.1 2,874.4 3,096.6 3,458.5 3,766.2 4,091.1 -- Mass Face Masks 136.8 150.0 168.8 195.6 215.7 236.3 -- Premium Face Masks 54.1 61.1 68.4 75.9 82.6 88.8 - Face Masks 190.8 211.1 237.3 271.5 298.3 325.1 -- Mass Acne Treatments 215.0 240.2 270.4 311.0 342.6 368.2 -- Premium Acne 166.6 198.2 243.5 289.9 327.6 359.9 Treatments - Acne Treatments 381.6 438.5 513.9 600.8 670.2 728.1 Facial Care 11,749.5 13,116.4 14,642.6 16,302.8 17,663.7 18,980.4 -- Mass General Purpose 814.8 921.0 1,046.3 1,153.4 1,232.5 1,345.7 Body Care -- Premium General 40.3 44.8 51.5 57.0 62.8 68.3 Purpose Body Care - General Purpose Body 855.0 965.8 1,097.8 1,210.4 1,295.3 1,414.0 Care -- Mass Firming/Anti- 30.5 30.8 31.1 31.4 29.4 30.1 Cellulite Body Care -- Premium Firming/Anti- - - - - - - Cellulite Body Care - Firming/Anti- 30.5 30.8 31.1 31.4 29.4 30.1 Cellulite Body Care Body Care 885.6 996.6 1,128.9 1,241.7 1,324.7 1,444.1 Skin Care 13,167.5 14,743.5 16,500.3 18,350.0 19,858.1 21,363.8 Source: Euromonitor International from official statistics, trade associations, trade press, company research, store checks, trade interviews, trade sources Table 100 Sales of Skin Care by Category: % Value Growth 2017-2022 % current value growth 2021/22 2017-22 CAGR 2017/22 Total - Mass Skin Care Sets/Kits 8.4 14.7 98.2 - Premium Skin Care Sets/Kits 7.5 6.3 36.0 Skin Care Sets/Kits 8.3 12.8 82.9 - Mass Hand Care 7.2 9.4 56.9 - Premium Hand Care 5.8 8.0 47.2 Hand Care 7.0 9.2 55.1 -- Mass Toners 9.2 12.0 76.4 -- Premium Toners 5.1 6.3 35.9 - Toners 7.3 9.2 55.2 -- Mass Lip Care 6.2 8.6 50.9 -- Premium Lip Care - - - - Lip Care 6.2 8.6 50.9 --- Mass Anti-Agers 8.6 11.5 72.5 --- Premium Anti-Agers 5.4 9.5 57.7 -- Anti-Agers 6.5 10.2 62.6 --- Mass Basic Moisturisers 8.7 11.4 71.9 --- Premium Basic Moisturisers 5.4 9.7 58.6 -- Basic Moisturisers 7.2 10.7 66.0 - Moisturisers And Treatments 7.0 10.5 65.0 --- Mass Facial Cleansing Wipes - - - --- Premium Facial Cleansing Wipes - - - -- Facial Cleansing Wipes - - - --- Mass Liquid/Cream/Gel/Bar Cleansers 8.8 8.2 48.3 --- Premium Liquid/Cream/Gel/Bar Cleansers 7.8 9.6 58.2 -- Liquid/Cream/Gel/Bar Cleansers 8.6 8.4 50.0
  98. B E A U T Y A N D P

    E R S O N A L C A R E I N V I E T N A M P a s s p o r t 91 © E u r o m o n i t o r I n t e r n a t i o n a l - Facial Cleansers 8.6 8.4 50.0 -- Mass Face Masks 9.6 11.6 72.8 -- Premium Face Masks 7.5 10.4 64.3 - Face Masks 9.0 11.2 70.4 -- Mass Acne Treatments 7.5 11.4 71.2 -- Premium Acne Treatments 9.9 16.7 116.1 - Acne Treatments 8.6 13.8 90.8 Facial Care 7.5 10.1 61.5 -- Mass General Purpose Body Care 9.2 10.6 65.2 -- Premium General Purpose Body Care 8.8 11.1 69.5 - General Purpose Body Care 9.2 10.6 65.4 -- Mass Firming/Anti-Cellulite Body Care 2.1 -0.3 -1.6 -- Premium Firming/Anti-Cellulite Body Care - - - - Firming/Anti-Cellulite Body Care 2.1 -0.3 -1.6 Body Care 9.0 10.3 63.1 Skin Care 7.6 10.2 62.2 Source: Euromonitor International from official statistics, trade associations, trade press, company research, store checks, trade interviews, trade sources Table 101 NBO Company Shares of Skin Care: % Value 2018-2022 % retail value rsp Company 2018 2019 2020 2021 2022 Shiseido Cosmetics 12.5 12.2 11.6 10.6 10.1 Vietnam Co Ltd L'Oréal Vietnam Co Ltd 8.0 8.6 9.2 9.6 9.8 Unilever Vietnam 9.1 8.4 8.3 8.1 8.0 International Co Ltd LG Vina Cosmetics Co Ltd 5.4 5.1 4.5 4.4 4.4 AmorePacific Vietnam JSC 2.8 2.9 3.5 3.9 4.1 Beiersdorf Vietnam Ltd Co 3.9 3.8 3.6 3.5 3.4 Estée Lauder Vietnam Co Ltd 3.5 3.4 3.0 2.7 2.7 Rohto-Mentholatum Vietnam 2.0 2.0 1.9 1.9 1.9 Co Ltd Hanoi International 0.7 0.9 1.0 1.1 1.1 Friendship Hospital JSC Pierre Fabre SA, 0.7 0.8 0.9 1.0 1.0 Laboratoires Procter & Gamble Vietnam 1.2 1.1 1.1 1.0 1.0 Ltd Nestlé SA 0.9 0.9 1.0 1.0 1.0 Nippon Menard Cosmetic Co 1.1 1.1 1.0 0.9 0.9 Ltd Amway Vietnam Co Ltd 0.9 0.9 0.8 0.7 0.7 Kanebo Cosmetics Inc 0.9 0.8 0.7 0.6 0.6 Clarins SA 0.7 0.7 0.6 0.6 0.5 Body Shop (Vietnam) Co 0.6 0.6 0.6 0.5 0.5 Ltd, The NAOS SAS 0.4 0.4 0.5 0.5 0.5 Fine Today Shiseido Co Ltd - - - 0.4 0.5 Oriflame Vietnam Ltd - - 0.8 0.4 0.4 Dang Duong Comestic Co Ltd 0.5 0.5 0.4 0.4 0.4 Kao Vietnam Ltd 0.4 0.4 0.3 0.3 0.3 Elizabeth Arden Inc 0.5 0.4 0.4 0.3 0.3 Unza Vietnam Co Ltd 0.3 0.3 0.3 0.3 0.3 Dai Viet Huong Trading 0.4 0.3 0.3 0.3 0.3 Manufacturing Co Ltd Dermalogica Vietnam Co Ltd 0.5 0.4 0.3 0.3 0.3
  99. B E A U T Y A N D P

    E R S O N A L C A R E I N V I E T N A M P a s s p o r t 92 © E u r o m o n i t o r I n t e r n a t i o n a l Stiefel Laboratories Pte 0.2 0.2 0.2 0.2 0.2 Ltd Thorakao Cosmetics Ltd 0.1 0.1 0.1 0.1 0.1 Johnson & Johnson Vietnam 0.2 0.1 0.1 0.1 0.1 Co Ltd Aloe Trading Co Ltd 0.1 0.1 0.1 0.1 0.1 Ascendia Brands Inc 0.1 0.1 0.0 - - Thuong Xuan Cosmetic Co Ltd 1.4 1.4 - - - Others 40.0 41.0 42.9 44.0 44.6 Total 100.0 100.0 100.0 100.0 100.0 Source: Euromonitor International from official statistics, trade associations, trade press, company research, store checks, trade interviews, trade sources Table 102 LBN Brand Shares of Skin Care: % Value 2019-2022 % retail value rsp Brand (GBO) Company (NBO) 2019 2020 2021 2022 Shiseido (Shiseido Co Shiseido Cosmetics 11.7 11.1 10.6 10.1 Ltd) Vietnam Co Ltd Pond's (Unilever Group) Unilever Vietnam 7.0 6.9 6.8 6.7 International Co Ltd Lancôme (L'Oréal L'Oréal Vietnam Co Ltd 3.0 3.0 3.0 2.9 Groupe) Vichy (L'Oréal Groupe) L'Oréal Vietnam Co Ltd 2.0 2.4 2.7 2.8 The Face Shop (LG LG Vina Cosmetics Co Ltd 1.8 2.1 2.2 2.3 Household & Health Care Ltd) La Roche-Posay L'Oréal Vietnam Co Ltd 1.3 1.6 1.8 1.9 (L'Oréal Groupe) Nivea (Beiersdorf AG) Beiersdorf Vietnam Ltd Co 2.1 1.9 1.8 1.7 Estée Lauder (Estée Estée Lauder Vietnam Co Ltd 2.0 1.9 1.7 1.7 Lauder Cos Inc) Laneíge (AmorePacific AmorePacific Vietnam JSC 1.1 1.2 1.4 1.4 Corp) Innisfree AmorePacific Vietnam JSC 0.7 1.0 1.2 1.3 (AmorePacific Corp) L'Oréal Paris Dermo- L'Oréal Vietnam Co Ltd 1.2 1.2 1.2 1.2 Expertise (L'Oréal Groupe) Sulwhasoo AmorePacific Vietnam JSC 1.0 1.1 1.2 1.2 (AmorePacific Corp) Paula's Choice Hanoi International - - 1.1 1.1 (Unilever Group) Friendship Hospital JSC The History of Whoo LG Vina Cosmetics Co Ltd 1.6 1.1 1.1 1.1 (LG Household & Health Care Ltd) Clinique (Estée Estée Lauder Vietnam Co Ltd 1.4 1.1 1.0 1.0 Lauder Cos Inc) Avène Pierre Fabre SA, 0.8 0.9 1.0 1.0 Laboratoires Nivea Men (Beiersdorf Beiersdorf Vietnam Ltd Co 1.1 1.1 1.0 1.0 AG) Olay (Procter & Procter & Gamble Vietnam 1.1 1.1 1.0 1.0 Gamble Co, The) Ltd Cetaphil (Galderma SA) Nestlé SA 0.9 1.0 1.0 1.0 Menard Nippon Menard Cosmetic Co 1.1 1.0 0.9 0.9 Ltd Kiehl's (L'Oréal L'Oréal Vietnam Co Ltd 0.8 0.8 0.8 0.8
  100. B E A U T Y A N D P

    E R S O N A L C A R E I N V I E T N A M P a s s p o r t 93 © E u r o m o n i t o r I n t e r n a t i o n a l Groupe) Vaseline Intensive Unilever Vietnam 0.8 0.7 0.7 0.7 Care (Unilever Group) International Co Ltd Eucerin (Beiersdorf AG) Beiersdorf Vietnam Ltd Co 0.5 0.6 0.6 0.6 Acnes (Rohto Rohto-Mentholatum Vietnam 0.6 0.6 0.6 0.6 Pharmaceutical Co Ltd) Co Ltd Lip Ice (Rohto Rohto-Mentholatum Vietnam 0.6 0.6 0.6 0.6 Pharmaceutical Co Ltd) Co Ltd Kanebo (Kao Corp) Kanebo Cosmetics Inc 0.8 0.6 0.6 0.6 Clarins Clarins SA 0.7 0.6 0.6 0.5 Hazeline (Unilever Unilever Vietnam 0.6 0.5 0.5 0.5 Group) International Co Ltd The Body Shop Body Shop (Vietnam) Co 0.6 0.6 0.5 0.5 (Natura&Co) Ltd, The Bioderma NAOS SAS 0.4 0.5 0.5 0.5 Paula's Choice Hanoi International 0.9 1.0 - - (Paula's Choice LLC) Friendship Hospital JSC Oriflame (Oriflame Thuong Xuan Cosmetic Co Ltd 1.4 - - - Cosmetics SA) Others Others 48.4 50.3 50.5 51.1 Total Total 100.0 100.0 100.0 100.0 Source: Euromonitor International from official statistics, trade associations, trade press, company research, store checks, trade interviews, trade sources Table 103 LBN Brand Shares of Basic Moisturisers: % Value 2019-2022 % retail value rsp Brand (GBO) Company (NBO) 2019 2020 2021 2022 Shiseido (Shiseido Co Shiseido Cosmetics 14.1 13.3 12.8 12.0 Ltd) Vietnam Co Ltd Pond's (Unilever Group) Unilever Vietnam 11.9 11.9 11.6 11.3 International Co Ltd Vichy (L'Oréal Groupe) L'Oréal Vietnam Co Ltd 3.0 3.5 3.9 4.1 Lancôme (L'Oréal L'Oréal Vietnam Co Ltd 3.2 3.2 3.1 3.1 Groupe) Avène Pierre Fabre SA, 1.7 1.9 2.0 2.1 Laboratoires La Roche-Posay L'Oréal Vietnam Co Ltd 1.4 1.7 1.9 2.1 (L'Oréal Groupe) The Face Shop (LG LG Vina Cosmetics Co Ltd 1.2 1.4 1.5 1.6 Household & Health Care Ltd) Paula's Choice Hanoi International - - 1.6 1.5 (Unilever Group) Friendship Hospital JSC Laneíge (AmorePacific AmorePacific Vietnam JSC 1.2 1.4 1.5 1.5 Corp) Menard Nippon Menard Cosmetic Co 1.5 1.3 1.2 1.1 Ltd Eucerin (Beiersdorf AG) Beiersdorf Vietnam Ltd Co 0.9 1.0 1.1 1.1 Clinique (Estée Estée Lauder Vietnam Co Ltd 1.6 1.3 1.2 1.1 Lauder Cos Inc) Estée Lauder (Estée Estée Lauder Vietnam Co Ltd 1.6 1.3 1.2 1.1 Lauder Cos Inc) One Today Dang Duong Comestic Co Ltd 1.2 1.0 1.0 0.9 Innisfree AmorePacific Vietnam JSC 0.5 0.7 0.8 0.9 (AmorePacific Corp) Sulwhasoo AmorePacific Vietnam JSC 0.7 0.7 0.7 0.8 (AmorePacific Corp)
  101. B E A U T Y A N D P

    E R S O N A L C A R E I N V I E T N A M P a s s p o r t 94 © E u r o m o n i t o r I n t e r n a t i o n a l Artistry Pure White Amway Vietnam Co Ltd 1.0 0.7 0.7 0.7 (Amway Corp) L'Oréal Paris Dermo- L'Oréal Vietnam Co Ltd 0.8 0.8 0.7 0.7 Expertise (L'Oréal Groupe) Clarins Clarins SA 0.8 0.7 0.7 0.7 Kiehl's (L'Oréal L'Oréal Vietnam Co Ltd 0.7 0.7 0.7 0.7 Groupe) Kanebo (Kao Corp) Kanebo Cosmetics Inc 0.9 0.7 0.7 0.6 Olay (Procter & Procter & Gamble Vietnam 0.6 0.6 0.6 0.5 Gamble Co, The) Ltd The History of Whoo LG Vina Cosmetics Co Ltd 0.8 0.6 0.5 0.5 (LG Household & Health Care Ltd) The Body Shop Body Shop (Vietnam) Co 0.5 0.5 0.5 0.5 (Natura&Co) Ltd, The Elizabeth Arden Elizabeth Arden Inc 0.6 0.5 0.4 0.4 (Revlon Inc) Lacvert Essance (LG LG Vina Cosmetics Co Ltd 0.5 0.4 0.4 0.3 Household & Health Care Ltd) Hazeline (Unilever Unilever Vietnam 0.4 0.4 0.3 0.3 Group) International Co Ltd Oriflame (Oriflame Oriflame Vietnam Ltd - 0.6 0.3 0.3 Cosmetics SA) Isa Knox (LG LG Vina Cosmetics Co Ltd 0.3 0.3 0.2 0.2 Household & Health Care Ltd) Dermalogica (Unilever Dermalogica Vietnam Co Ltd 0.4 0.3 0.2 0.2 Group) Paula's Choice Hanoi International 1.3 1.5 - - (Paula's Choice LLC) Friendship Hospital JSC Za (Shiseido Co Ltd) Shiseido Cosmetics 0.4 0.1 - - Vietnam Co Ltd Oriflame (Oriflame Thuong Xuan Cosmetic Co Ltd 1.0 - - - Cosmetics SA) Others Others 43.2 45.0 46.0 46.7 Total Total 100.0 100.0 100.0 100.0 Source: Euromonitor International from official statistics, trade associations, trade press, company research, store checks, trade interviews, trade sources Table 104 LBN Brand Shares of Anti-agers: % Value 2019-2022 % retail value rsp Brand (GBO) Company (NBO) 2019 2020 2021 2022 Shiseido (Shiseido Co Shiseido Cosmetics 21.0 20.4 19.5 19.0 Ltd) Vietnam Co Ltd Lancôme (L'Oréal L'Oréal Vietnam Co Ltd 7.5 7.8 7.9 7.8 Groupe) Estée Lauder (Estée Estée Lauder Vietnam Co Ltd 7.3 7.1 6.7 6.6 Lauder Cos Inc) Sulwhasoo AmorePacific Vietnam JSC 2.8 3.1 3.4 3.3 (AmorePacific Corp) L'Oréal Paris Dermo- L'Oréal Vietnam Co Ltd 3.1 3.1 3.1 3.0 Expertise (L'Oréal Groupe) Olay (Procter & Procter & Gamble Vietnam 3.1 3.0 2.9 2.9 Gamble Co, The) Ltd
  102. B E A U T Y A N D P

    E R S O N A L C A R E I N V I E T N A M P a s s p o r t 95 © E u r o m o n i t o r I n t e r n a t i o n a l Pond's (Unilever Group) Unilever Vietnam 2.5 2.5 2.6 2.7 International Co Ltd Laneíge (AmorePacific AmorePacific Vietnam JSC 2.1 2.3 2.5 2.7 Corp) The Face Shop (LG LG Vina Cosmetics Co Ltd 1.9 2.2 2.5 2.7 Household & Health Care Ltd) Vichy (L'Oréal Groupe) L'Oréal Vietnam Co Ltd 1.7 2.1 2.4 2.6 Menard Nippon Menard Cosmetic Co 2.7 2.5 2.3 2.4 Ltd The History of Whoo LG Vina Cosmetics Co Ltd 3.2 2.3 2.2 2.3 (LG Household & Health Care Ltd) Clinique (Estée Estée Lauder Vietnam Co Ltd 2.8 2.3 2.2 2.2 Lauder Cos Inc) Innisfree AmorePacific Vietnam JSC 0.7 1.0 1.3 1.6 (AmorePacific Corp) Eversoft (Wipro Ltd) Unza Vietnam Co Ltd 1.4 1.3 1.3 1.3 Artistry Crème (Amway Amway Vietnam Co Ltd 1.3 1.3 1.2 1.2 Corp) Kanebo (Kao Corp) Kanebo Cosmetics Inc 1.7 1.4 1.2 1.2 Paula's Choice Hanoi International - - 1.0 1.0 (Unilever Group) Friendship Hospital JSC Clarins Clarins SA 1.2 1.0 0.9 0.8 O HUI (LG Household & LG Vina Cosmetics Co Ltd 1.4 0.8 0.7 0.6 Health Care Ltd) Elizabeth Arden Elizabeth Arden Inc 0.8 0.7 0.6 0.6 (Revlon Inc) SU:M37 (LG Household LG Vina Cosmetics Co Ltd 0.7 0.6 0.5 0.5 & Health Care Ltd) Oriflame (Oriflame Oriflame Vietnam Ltd - 1.0 0.5 0.5 Cosmetics SA) Isa Knox (LG LG Vina Cosmetics Co Ltd 0.5 0.4 0.3 0.3 Household & Health Care Ltd) Mamonde (AmorePacific AmorePacific Vietnam JSC - 0.3 0.3 0.3 Corp) Dermalogica (Unilever Dermalogica Vietnam Co Ltd 0.4 0.3 0.2 0.2 Group) Nu Skin (Nu Skin Nu Skin Vietnam Co Ltd 0.1 0.2 0.2 0.2 Enterprises Inc) Freeman (PH Beauty Freeman Cosmetics Corp 0.2 0.2 0.2 0.2 Labs LLC) L'Occitane Hals Group 0.1 0.1 0.1 0.1 (L'Occitane International SA) Hada Labo (Rohto Rohto-Mentholatum Vietnam 0.1 0.1 0.1 0.1 Pharmaceutical Co Ltd) Co Ltd Paula's Choice Hanoi International 0.8 0.9 - - (Paula's Choice LLC) Friendship Hospital JSC Oriflame (Oriflame Thuong Xuan Cosmetic Co Ltd 1.7 - - - Cosmetics SA) Others Others 25.4 27.9 29.1 29.0 Total Total 100.0 100.0 100.0 100.0 Source: Euromonitor International from official statistics, trade associations, trade press, company research, store checks, trade interviews, trade sources Table 105 LBN Brand Shares of Firming/Anti-cellulite Body Care: % Value 2019-2022
  103. B E A U T Y A N D P

    E R S O N A L C A R E I N V I E T N A M P a s s p o r t 96 © E u r o m o n i t o r I n t e r n a t i o n a l % retail value rsp Brand (GBO) Company (NBO) 2019 2020 2021 2022 Nivea Body Firming Beiersdorf Vietnam Ltd Co 35.1 31.3 29.9 32.5 (Beiersdorf AG) Avon (Avon Products Avon Cosmetics Vietnam Ltd - - - - Inc) Others Others 64.9 68.7 70.1 67.5 Total Total 100.0 100.0 100.0 100.0 Source: Euromonitor International from official statistics, trade associations, trade press, company research, store checks, trade interviews, trade sources Table 106 LBN Brand Shares of General Purpose Body Care: % Value 2019-2022 % retail value rsp Brand (GBO) Company (NBO) 2019 2020 2021 2022 Nivea (Beiersdorf AG) Beiersdorf Vietnam Ltd Co 15.5 12.9 12.1 11.1 Vaseline Intensive Unilever Vietnam 10.5 10.3 10.1 9.7 Care (Unilever Group) International Co Ltd The Face Shop (LG LG Vina Cosmetics Co Ltd 3.9 4.1 4.1 3.9 Household & Health Care Ltd) Olay (Procter & Procter & Gamble Vietnam 3.3 3.1 3.0 2.8 Gamble Co, The) Ltd Innisfree AmorePacific Vietnam JSC 1.5 2.0 2.1 2.3 (AmorePacific Corp) Hazeline (Unilever Unilever Vietnam 2.1 2.1 2.0 1.9 Group) International Co Ltd Vichy (L'Oréal Groupe) L'Oréal Vietnam Co Ltd 1.4 1.5 1.7 1.6 Clarins Clarins SA 1.5 1.4 1.4 1.5 Oriflame (Oriflame Oriflame Vietnam Ltd - 2.8 1.4 1.4 Cosmetics SA) The Body Shop Body Shop (Vietnam) Co 1.0 1.0 0.9 0.9 (Natura&Co) Ltd, The Sulwhasoo AmorePacific Vietnam JSC 0.7 0.8 0.8 0.8 (AmorePacific Corp) Enchanteur (Wipro Ltd) Unza Vietnam Co Ltd 0.8 0.8 0.8 0.7 Eucerin (Beiersdorf AG) Beiersdorf Vietnam Ltd Co 0.5 0.6 0.6 0.7 Kiehl's (L'Oréal L'Oréal Vietnam Co Ltd 0.4 0.4 0.4 0.4 Groupe) Cetaphil (Galderma SA) Nestlé SA 0.2 0.2 0.2 0.2 Roger Gallois Roger Gallois, Laboratoires 0.1 0.1 0.1 0.1 Elizabeth Arden Elizabeth Arden Inc 0.1 0.1 0.1 0.1 (Revlon Inc) L'Occitane Hals Group 0.1 0.0 0.0 0.0 (L'Occitane International SA) Lander Ascendia Brands Inc 0.8 0.3 - - Sweet Secret Ascendia Brands Inc 0.4 0.2 - - Oriflame (Oriflame Thuong Xuan Cosmetic Co Ltd 4.6 - - - Cosmetics SA) Oriflame Men Thuong Xuan Cosmetic Co Ltd 0.1 - - - (Oriflame Cosmetics SA) Avon (Avon Products Avon Cosmetics Vietnam Ltd - - - - Inc) The Body Shop Body Shop (Vietnam) Co - - - - (L'Oréal Groupe) Ltd, The Elizabeth Arden Elizabeth Arden Inc - - - -
  104. B E A U T Y A N D P

    E R S O N A L C A R E I N V I E T N A M P a s s p o r t 97 © E u r o m o n i t o r I n t e r n a t i o n a l Cetaphil Nestlé SA - - - - Eversoft (Wipro Ltd) Unza Vietnam Co Ltd - - - - Others Others 50.6 55.4 58.2 59.9 Total Total 100.0 100.0 100.0 100.0 Source: Euromonitor International from official statistics, trade associations, trade press, company research, store checks, trade interviews, trade sources Table 107 LBN Brand Shares of Premium Skin Care: % Value 2019-2022 % retail value rsp Brand (GBO) Company (NBO) 2019 2020 2021 2022 Shiseido (Shiseido Co Shiseido Cosmetics 29.2 29.0 28.0 27.1 Ltd) Vietnam Co Ltd Lancôme (L'Oréal L'Oréal Vietnam Co Ltd 7.5 7.8 7.8 7.9 Groupe) Vichy (L'Oréal Groupe) L'Oréal Vietnam Co Ltd 4.9 6.2 7.0 7.4 La Roche-Posay L'Oréal Vietnam Co Ltd 3.3 4.1 4.7 5.0 (L'Oréal Groupe) Estée Lauder (Estée Estée Lauder Vietnam Co Ltd 5.1 4.8 4.5 4.4 Lauder Cos Inc) Laneíge (AmorePacific AmorePacific Vietnam JSC 2.8 3.2 3.6 3.7 Corp) Sulwhasoo AmorePacific Vietnam JSC 2.6 2.8 3.1 3.1 (AmorePacific Corp) Paula's Choice Hanoi International - - 3.0 3.0 (Unilever Group) Friendship Hospital JSC The History of Whoo LG Vina Cosmetics Co Ltd 4.0 3.0 2.8 2.9 (LG Household & Health Care Ltd) Clinique (Estée Estée Lauder Vietnam Co Ltd 3.5 3.0 2.7 2.7 Lauder Cos Inc) Avène Pierre Fabre SA, 2.0 2.4 2.6 2.7 Laboratoires Menard Nippon Menard Cosmetic Co 2.8 2.6 2.5 2.5 Ltd Kiehl's (L'Oréal L'Oréal Vietnam Co Ltd 1.9 2.0 2.0 2.0 Groupe) Kanebo (Kao Corp) Kanebo Cosmetics Inc 2.0 1.7 1.5 1.5 Clarins Clarins SA 1.7 1.6 1.5 1.4 Bioderma NAOS SAS 1.1 1.2 1.3 1.3 O HUI (LG Household & LG Vina Cosmetics Co Ltd 2.0 1.2 1.1 1.1 Health Care Ltd) Artistry Pure White Amway Vietnam Co Ltd 1.0 0.8 0.8 0.8 (Amway Corp) Elizabeth Arden Elizabeth Arden Inc 1.1 0.9 0.8 0.8 (Revlon Inc) Dermalogica (Unilever Dermalogica Vietnam Co Ltd 1.1 0.9 0.7 0.7 Group) Paula's Choice Hanoi International 2.3 2.7 - - (Paula's Choice LLC) Friendship Hospital JSC Others Others 18.1 18.2 18.2 18.1 Total Total 100.0 100.0 100.0 100.0 Source: Euromonitor International from official statistics, trade associations, trade press, company research, store checks, trade interviews, trade sources Table 108 Forecast Sales of Skin Care by Category: Value 2022-2027
  105. B E A U T Y A N D P

    E R S O N A L C A R E I N V I E T N A M P a s s p o r t 98 © E u r o m o n i t o r I n t e r n a t i o n a l VND billion 2022 2023 2024 2025 2026 2027 - Mass Skin Care Sets/ 610.1 660.4 712.4 763.5 814.3 865.1 Kits - Premium Skin Care 136.4 146.0 156.0 166.2 175.8 184.0 Sets/Kits Skin Care Sets/Kits 746.5 806.5 868.4 929.7 990.0 1,049.2 - Mass Hand Care 158.6 165.4 173.0 181.3 191.1 202.6 - Premium Hand Care 34.2 35.2 36.7 38.2 40.0 42.0 Hand Care 192.8 200.7 209.7 219.5 231.1 244.6 -- Mass Toners 571.8 605.2 646.8 693.0 744.5 801.4 -- Premium Toners 482.3 505.4 529.3 551.4 572.8 593.3 - Toners 1,054.1 1,110.7 1,176.1 1,244.4 1,317.3 1,394.7 -- Mass Lip Care 419.0 433.7 455.1 481.4 511.7 546.4 -- Premium Lip Care - - - - - - - Lip Care 419.0 433.7 455.1 481.4 511.7 546.4 --- Mass Anti-Agers 1,287.9 1,395.6 1,505.8 1,622.7 1,740.8 1,866.5 --- Premium Anti-Agers 2,399.5 2,459.9 2,560.1 2,674.2 2,816.9 2,984.9 -- Anti-Agers 3,687.4 3,855.5 4,066.0 4,296.9 4,557.7 4,851.4 --- Mass Basic 5,002.5 5,263.1 5,587.9 6,013.6 6,510.9 7,080.5 Moisturisers --- Premium Basic 3,673.3 3,779.8 3,919.3 4,083.4 4,271.1 4,495.1 Moisturisers -- Basic Moisturisers 8,675.8 9,042.9 9,507.1 10,097.0 10,781.9 11,575.6 - Moisturisers And 12,363.1 12,898.4 13,573.1 14,393.9 15,339.6 16,427.0 Treatments --- Mass Facial - - - - - - Cleansing Wipes --- Premium Facial - - - - - - Cleansing Wipes -- Facial Cleansing Wipes - - - - - - --- Mass Liquid/Cream/ 3,352.5 3,539.5 3,753.7 4,003.0 4,281.7 4,592.2 Gel/Bar Cleansers --- Premium Liquid/ 738.6 791.0 844.4 895.0 942.4 987.3 Cream/Gel/Bar Cleansers -- Liquid/Cream/Gel/Bar 4,091.1 4,330.5 4,598.1 4,898.1 5,224.1 5,579.5 Cleansers - Facial Cleansers 4,091.1 4,330.5 4,598.1 4,898.1 5,224.1 5,579.5 -- Mass Face Masks 236.3 255.4 273.9 292.1 309.4 326.2 -- Premium Face Masks 88.8 91.3 93.7 96.6 99.5 102.2 - Face Masks 325.1 346.7 367.6 388.7 408.9 428.4 -- Mass Acne Treatments 368.2 390.6 411.4 430.9 449.2 466.0 -- Premium Acne 359.9 387.6 420.6 456.7 496.1 539.4 Treatments - Acne Treatments 728.1 778.2 832.0 887.6 945.3 1,005.4 Facial Care 18,980.4 19,898.1 21,002.1 22,294.0 23,747.0 25,381.4 -- Mass General Purpose 1,345.7 1,436.5 1,529.2 1,623.7 1,718.9 1,816.8 Body Care -- Premium General 68.3 70.3 72.3 74.2 75.8 77.4 Purpose Body Care - General Purpose Body 1,414.0 1,506.8 1,601.5 1,697.9 1,794.7 1,894.2 Care -- Mass Firming/Anti- 30.1 30.4 31.2 32.3 33.6 35.1 Cellulite Body Care -- Premium Firming/Anti- - - - - - - Cellulite Body Care - Firming/Anti- 30.1 30.4 31.2 32.3 33.6 35.1 Cellulite Body Care
  106. B E A U T Y A N D P

    E R S O N A L C A R E I N V I E T N A M P a s s p o r t 99 © E u r o m o n i t o r I n t e r n a t i o n a l Body Care 1,444.1 1,537.1 1,632.7 1,730.2 1,828.4 1,929.3 Skin Care 21,363.8 22,442.4 23,712.9 25,173.5 26,796.5 28,604.5 Source: Euromonitor International from trade associations, trade press, company research, trade interviews, trade sources Table 109 Forecast Sales of Skin Care by Category: % Value Growth 2022-2027 % constant value growth 2022/2023 2022-27 CAGR 2022/27 Total - Mass Skin Care Sets/Kits 8.3 7.2 41.8 - Premium Skin Care Sets/Kits 7.0 6.2 34.9 Skin Care Sets/Kits 8.0 7.0 40.5 - Mass Hand Care 4.3 5.0 27.8 - Premium Hand Care 3.1 4.2 22.9 Hand Care 4.1 4.9 26.9 -- Mass Toners 5.8 7.0 40.2 -- Premium Toners 4.8 4.2 23.0 - Toners 5.4 5.8 32.3 -- Mass Lip Care 3.5 5.5 30.4 -- Premium Lip Care - - - - Lip Care 3.5 5.5 30.4 --- Mass Anti-Agers 8.4 7.7 44.9 --- Premium Anti-Agers 2.5 4.5 24.4 -- Anti-Agers 4.6 5.6 31.6 --- Mass Basic Moisturisers 5.2 7.2 41.5 --- Premium Basic Moisturisers 2.9 4.1 22.4 -- Basic Moisturisers 4.2 5.9 33.4 - Moisturisers And Treatments 4.3 5.8 32.9 --- Mass Facial Cleansing Wipes - - - --- Premium Facial Cleansing Wipes - - - -- Facial Cleansing Wipes - - - --- Mass Liquid/Cream/Gel/Bar Cleansers 5.6 6.5 37.0 --- Premium Liquid/Cream/Gel/Bar Cleansers 7.1 6.0 33.7 -- Liquid/Cream/Gel/Bar Cleansers 5.9 6.4 36.4 - Facial Cleansers 5.9 6.4 36.4 -- Mass Face Masks 8.1 6.7 38.0 -- Premium Face Masks 2.8 2.9 15.2 - Face Masks 6.6 5.7 31.8 -- Mass Acne Treatments 6.1 4.8 26.6 -- Premium Acne Treatments 7.7 8.4 49.9 - Acne Treatments 6.9 6.7 38.1 Facial Care 4.8 6.0 33.7 -- Mass General Purpose Body Care 6.7 6.2 35.0 -- Premium General Purpose Body Care 3.0 2.5 13.3 - General Purpose Body Care 6.6 6.0 34.0 -- Mass Firming/Anti-Cellulite Body Care 1.0 3.2 16.8 -- Premium Firming/Anti-Cellulite Body Care - - - - Firming/Anti-Cellulite Body Care 1.0 3.2 16.8 Body Care 6.4 6.0 33.6 Skin Care 5.0 6.0 33.9 Source: Euromonitor International from trade associations, trade press, company research, trade interviews, trade sources
  107. B E A U T Y A N D P

    E R S O N A L C A R E I N V I E T N A M P a s s p o r t 100 © E u r o m o n i t o r I n t e r n a t i o n a l SUN CARE IN VIETNAM - CATEGORY ANALYSIS KEY DATA FINDINGS ▪ Retail value sales grow by 6% in current terms in 2022 to VND145 billion ▪ Baby and child-specific sun care is the best performing category in 2022, with retail value sales growing by 9% in current terms to VND12.5 billion ▪ Rohto-Mentholatum Vietnam Co Ltd is the leading player in 2022, with a retail value share of 20% ▪ Retail sales are set to rise at a current value CAGR of 10% (2022 constant value CAGR of 6%) over the forecast period to VND237 billion 2022 DEVELOPMENTS Sun care returns to growth as mobility resumes Two years of double-digit current value decline were seen for sun care in 2020 and 2021, as COVID-19 lockdowns and social distancing rules saw people work, study, and socialise with family at home, and they generally spent much less time outdoors, limiting the need for such products. However, as consumers stepped out of their homes more frequently in 2022, thus needing to use sun protection, sun care returned to growth in Vietnam in 2022. Sun protection remains a must-have item for many Vietnamese consumers as part of their daily skin care routine – driven by consumer awareness of the need to protect themselves from ultraviolet rays. This is partly also thanks to brands offering various price ranges suitable for different consumers’ budgets, and constant marketing campaigns on social media. Nevertheless, sales were unable to recover to the pre-pandemic level. In addition to typical formats such as gel and lotion, formats such as solid, patch, and spray were also observed during 2022, and younger consumers in particular were keen to try such products. Product availability in this category is not limited to big cities, with such products well- distributed and displayed across retailers in all parts of the country. Global brands dominate sun care in Vietnam Sun care in Vietnam is dominated by global players, with the category lacking strong local representation. In mass adult sun protection, Rohto-Mentholatum Vietnam Co Ltd retained its leading position in 2022, with three key lines: Skinaqua with moisturising feature, ToneupUV, and Sunplay. Sunplay enjoys a trusted brand image amongst Vietnamese consumers, since it has been present in the market for many years, and offers strong sun protection for outdoor activities. It is also very active on social media with mini games and promotional programmes on Facebook; for example, 2023 is the year of the cat in Vietnam, and it launched a sun care series with the cat icon “Meow” to attract younger consumers. In addition, Sunplay has a strong distribution network, with its products easily found across different offline retailers. Premium adult sun protection accounts for lower sales, and saw slower growth than the mass segment in 2022. The price gap between the premium and mass segments is quite large, which can deter consumers from trading up, as sun protection is normally treated as a daily use item. Consumers who can afford premium sun care products usually require a different approach in
  108. B E A U T Y A N D P

    E R S O N A L C A R E I N V I E T N A M P a s s p o r t 101 © E u r o m o n i t o r I n t e r n a t i o n a l terms of marketing. Most brands use trusted beauty influencers to recommend products on TikTok and Facebook. Anessa, one of the leading premium adult sun protection brands, offers a wide variety of sun care products with various added features, including moisturising, dust protection, water resistance, BB cream foundation, and for different skin types, and also comes in different formats, such as lotion, gel and spray. Consumers migrate online due to the wide choice and offers In addition to beauty specialists, supermarkets and hypermarkets, e-commerce continued to see an increasing share of distribution in sun care in value terms in 2022, supported by platforms such as Shopee, Lazada, and Tiki. Consumers prioritise purchasing from trusted retailers such as Watsons and Guardian, and they can also purchase other products from multiple brands from these retailers. In brands’ official shops on e-commerce sites, they frequently offer deep discounts of up to 50%, buy-one-get-one-free, or gifts on double-day sales or weekends to boost online sales. Meanwhile, although still accounting for nearly a quarter of sales in 2022, small local grocers has been seeing its share decline, as normally these offer only a couple of mass products, with very limited brand choice. Also, the prices are usually higher than in larger offline retailers and online, offering almost no promotional programmes. Moreover, as in other beauty and personal care categories, digital marketing is becoming an increasingly significant tool to advertise brands and products and increase brand representation and recognition in the market. This trend is in line with the rising popularity of e-commerce as a sales channel, and is only likely to develop and grow. In 2022, Facebook remained the most popular social media platform for players looking to increase their interaction with customers. PROSPECTS AND OPPORTUNITIES Sun care set to see dynamic growth due to growth potential in rural areas Rising disposable incomes and growing awareness of skin health are amongst the factors expected to contribute to the dynamic current value growth of sun care in Vietnam in the forecast period. With Vietnamese consumers taking care of their beauty overall and skin in particular, sun care is increasingly treated as a must-have item amongst all age groups. However, strong growth potential still exists in rural areas. Meanwhile, product innovation in terms of added benefits, such as moisturisation, tinting and hydration, as well as newer formats, are expected to support growth in the category. In addition, the return of travel will contribute to recovery. After the severe declines seen during the pandemic, current value sales are expected to recover to the pre-pandemic (2019) level in 2025. Although growth is expected across all categories, baby and child-specific sun care is set to see the strongest growth, as consumers are increasingly keen to protect their children’s skin. Multifunctional products will remain A threat to specialised sun care offerings The review period saw the blurring of the lines of sun protection with colour cosmetics and skin care products, especially facial care products, in response to rising awareness of the dangers of sun exposure. This was clearly seen in BB/CC cream, foundation and anti-agers. Indeed, a number of new, innovative colour cosmetics and facial care products were launched in Vietnam, such as BB/CC cream and foundation with low SPF15-30. These products claimed to be suitable for avoiding skin dryness, while offering some sun protection. The demand for such multifunctional products has increased because of their convenience, and this is set to continue.
  109. B E A U T Y A N D P

    E R S O N A L C A R E I N V I E T N A M P a s s p o r t 102 © E u r o m o n i t o r I n t e r n a t i o n a l However, while this trend might reduce the growth potential within sun care over the forecast period, its impact is likely to be relatively limited, as a large number of consumers do not use colour cosmetics in Vietnam. Nonetheless, over the forecast period more innovative beauty and skin care products with sun protection functionality are expected to enter the marketplace, in line with local consumers’ demand for higher standards when purchasing such products. For this reason, sun care manufacturers may look to develop more sophisticated products incorporating skin care properties, for example. Beauty specialists and e-commerce expected to maintain growth Beauty specialists such as Watsons and Guardian are expected to grow in importance in term of distribution in sun care over the forecast period. These retailers usually offer a wide variety of sun care brands from which to choose, making it easy for consumers to try different brands in- store and purchase accordingly. However, the number of brands’ official stores is also increasing on e-commerce sites such as Shopee and Lazada. Brands including Sunplay and Anessa always launch discount programmes on double-days, with up to 50% off, or buy-one- get-one-free. Many consumers spend time promotion-hunting to buy premium items in particular, as the prices can be very attractive. However, mass sun care is expected to continue to see higher growth than premium sun care in the forecast period. CATEGORY DATA Table 110 Sales of Sun Care by Category: Value 2017-2022 VND billion 2017 2018 2019 2020 2021 2022 Baby and Child-specific 13.6 14.5 15.2 13.7 11.4 12.5 Sun Care -- Mass Sun Protection 83.2 98.2 111.1 97.3 87.5 92.3 -- Premium Sun Protection 17.0 23.3 31.8 27.3 24.5 25.6 - Sun Protection 100.2 121.5 142.9 124.7 112.1 117.9 -- Mass Self-Tanning - - - - - - -- Premium Self-Tanning - - - - - - - Self-Tanning - - - - - - -- Mass Aftersun 6.8 7.4 8.0 6.9 6.3 6.7 -- Premium Aftersun 9.2 9.9 10.6 8.7 7.7 8.1 - Aftersun 16.0 17.3 18.6 15.6 14.0 14.8 Adult Sun Care 116.2 138.8 161.5 140.3 126.1 132.6 Sun Care 129.8 153.3 176.7 154.0 137.5 145.1 Source: Euromonitor International from official statistics, trade associations, trade press, company research, store checks, trade interviews, trade sources Table 111 Sales of Sun Care by Category: % Value Growth 2017-2022 % current value growth 2021/22 2017-22 CAGR 2017/22 Total Baby and Child-specific Sun Care 9.2 -1.7 -8.1 -- Mass Sun Protection 5.4 2.1 10.9 -- Premium Sun Protection 4.3 8.5 50.6 - Sun Protection 5.1 3.3 17.6 -- Mass Self-Tanning - - -
  110. B E A U T Y A N D P

    E R S O N A L C A R E I N V I E T N A M P a s s p o r t 103 © E u r o m o n i t o r I n t e r n a t i o n a l -- Premium Self-Tanning - - - - Self-Tanning - - - -- Mass Aftersun 5.6 -0.4 -1.9 -- Premium Aftersun 5.1 -2.6 -12.4 - Aftersun 5.3 -1.6 -7.9 Adult Sun Care 5.2 2.7 14.1 Sun Care 5.5 2.3 11.8 Source: Euromonitor International from official statistics, trade associations, trade press, company research, store checks, trade interviews, trade sources Table 112 NBO Company Shares of Sun Care: % Value 2018-2022 % retail value rsp Company 2018 2019 2020 2021 2022 Rohto-Mentholatum Vietnam 18.7 19.6 19.8 20.2 20.1 Co Ltd Kao Vietnam Ltd 12.7 12.4 12.5 12.6 11.7 L'Oréal Vietnam Co Ltd 9.2 10.0 10.5 10.7 11.0 LG Vina Cosmetics Co Ltd 9.8 9.0 8.9 9.0 9.9 Shiseido Cosmetics 5.8 7.6 7.6 7.4 7.4 Vietnam Co Ltd Beiersdorf Vietnam Ltd Co 6.6 5.9 6.0 5.8 6.3 AmorePacific Vietnam JSC 3.1 3.5 3.5 3.5 3.3 Oriflame Vietnam Ltd - - 4.6 2.8 2.8 Body Shop (Vietnam) Co 2.4 2.4 2.5 2.4 2.6 Ltd, The Avon Cosmetics Vietnam Ltd 1.9 2.2 2.2 2.2 2.3 Bübchen-Werk Ewald Hermes 2.5 2.3 2.3 2.2 2.2 Pharmazeutische Fabrik GmbH Hanoi International 1.4 1.7 1.6 1.5 1.5 Friendship Hospital JSC Revlon Inc 1.3 1.1 1.1 1.1 1.4 Pierre Fabre SA, 1.4 1.4 1.4 1.4 1.3 Laboratoires Fine Today Shiseido Co Ltd - - - 0.7 0.8 ISIS Pharma France SAS 0.7 0.6 0.6 0.7 0.6 Dermalogica Vietnam Co Ltd 0.3 0.2 0.3 0.2 0.2 Thuong Xuan Cosmetic Co Ltd 6.8 6.9 - - - Others 15.5 13.2 14.5 15.8 14.6 Total 100.0 100.0 100.0 100.0 100.0 Source: Euromonitor International from official statistics, trade associations, trade press, company research, store checks, trade interviews, trade sources Table 113 LBN Brand Shares of Sun Care: % Value 2019-2022 % retail value rsp Brand (GBO) Company (NBO) 2019 2020 2021 2022 Sunplay (Rohto Rohto-Mentholatum Vietnam 19.6 19.8 20.2 20.1 Pharmaceutical Co Ltd) Co Ltd Bioré (Kao Corp) Kao Vietnam Ltd 12.4 12.5 12.6 11.7 The Face Shop (LG LG Vina Cosmetics Co Ltd 9.0 8.9 9.0 9.9 Household & Health Care Ltd) Vichy Capital Soleil L'Oréal Vietnam Co Ltd 4.5 4.8 4.8 5.1 (L'Oréal Groupe)
  111. B E A U T Y A N D P

    E R S O N A L C A R E I N V I E T N A M P a s s p o r t 104 © E u r o m o n i t o r I n t e r n a t i o n a l Anessa (Shiseido Co Shiseido Cosmetics 3.1 3.5 3.9 3.9 Ltd) Vietnam Co Ltd Shiseido (Shiseido Co Shiseido Cosmetics 3.7 3.4 3.6 3.5 Ltd) Vietnam Co Ltd Innisfree AmorePacific Vietnam JSC 3.5 3.5 3.5 3.3 (AmorePacific Corp) Nivea (Beiersdorf AG) Beiersdorf Vietnam Ltd Co 3.2 3.2 3.3 3.3 Garnier Ambre Solaire L'Oréal Vietnam Co Ltd 3.2 3.2 3.2 3.2 (L'Oréal Groupe) Oriflame (Oriflame Oriflame Vietnam Ltd - 4.6 2.8 2.8 Cosmetics SA) La Roche-Posay L'Oréal Vietnam Co Ltd 2.2 2.5 2.7 2.7 (L'Oréal Groupe) The Body Shop Body Shop (Vietnam) Co 2.4 2.5 2.4 2.6 (Natura&Co) Ltd, The Nivea Sun (Beiersdorf Beiersdorf Vietnam Ltd Co 2.1 2.2 2.0 2.4 AG) Avon (Natura&Co) Avon Cosmetics Vietnam Ltd - 2.2 2.2 2.3 Bübchen (Katjes Group) Bübchen-Werk Ewald Hermes - 2.3 2.2 2.2 Pharmazeutische Fabrik GmbH Paula's Choice Hanoi International - - 1.5 1.5 (Unilever Group) Friendship Hospital JSC Absolutes Revlon Inc 1.1 1.1 1.1 1.4 Avène Pierre Fabre SA, 1.4 1.4 1.4 1.3 Laboratoires Senka Fine Today Shiseido Co Ltd - - 0.7 0.8 Isis Pharma ISIS Pharma France SAS 0.6 0.6 0.7 0.6 Eucerin (Beiersdorf AG) Beiersdorf Vietnam Ltd Co 0.5 0.5 0.5 0.6 Dermalogica (Unilever Dermalogica Vietnam Co Ltd 0.2 0.3 0.2 0.2 Group) Paula's Choice Hanoi International 1.7 1.6 - - (Paula's Choice LLC) Friendship Hospital JSC Senka (Shiseido Co Ltd) Shiseido Cosmetics 0.7 0.7 - - Vietnam Co Ltd Oriflame (Oriflame Thuong Xuan Cosmetic Co Ltd 6.9 - - - Cosmetics SA) Bübchen (Galderma SA) Bübchen-Werk Ewald Hermes 2.3 - - - Pharmazeutische Fabrik GmbH Avon (Avon Products Avon Cosmetics Vietnam Ltd 2.2 - - - Inc) The Body Shop Body Shop (Vietnam) Co - - - - (L'Oréal Groupe) Ltd, The Bübchen (Nestlé SA) Bübchen-Werk Ewald Hermes - - - - Pharmazeutische Fabrik GmbH Dermalogica Dermalogica Vietnam Co Ltd - - - - (Dermalogica Inc) Others Others 13.2 14.5 15.8 14.6 Total Total 100.0 100.0 100.0 100.0 Source: Euromonitor International from official statistics, trade associations, trade press, company research, store checks, trade interviews, trade sources Table 114 LBN Brand Shares of Premium Adult Sun Care: % Value 2019-2022 % retail value rsp Brand (GBO) Company (NBO) 2019 2020 2021 2022 Vichy Capital Soleil L'Oréal Vietnam Co Ltd 18.9 20.5 20.3 21.8 (L'Oréal Groupe) Anessa (Shiseido Co Shiseido Cosmetics 13.0 15.0 16.5 16.8
  112. B E A U T Y A N D P

    E R S O N A L C A R E I N V I E T N A M P a s s p o r t 105 © E u r o m o n i t o r I n t e r n a t i o n a l Ltd) Vietnam Co Ltd Shiseido (Shiseido Co Shiseido Cosmetics 15.5 14.7 15.2 15.0 Ltd) Vietnam Co Ltd La Roche-Posay L'Oréal Vietnam Co Ltd 9.2 10.5 11.7 11.5 (L'Oréal Groupe) Paula's Choice Hanoi International - - 6.4 6.5 (Unilever Group) Friendship Hospital JSC Avène Pierre Fabre SA, 5.8 6.1 5.8 5.7 Laboratoires Isis Pharma ISIS Pharma France SAS 2.6 2.8 2.8 2.6 Dermalogica (Unilever Dermalogica Vietnam Co Ltd 1.0 1.1 0.9 1.1 Group) Paula's Choice Hanoi International 7.1 7.0 - - (Paula's Choice LLC) Friendship Hospital JSC Dermalogica Dermalogica Vietnam Co Ltd - - - - (Dermalogica Inc) Others Others 26.8 22.3 20.4 19.1 Total Total 100.0 100.0 100.0 100.0 Source: Euromonitor International from official statistics, trade associations, trade press, company research, store checks, trade interviews, trade sources Table 115 Forecast Sales of Sun Care by Category: Value 2022-2027 VND billion 2022 2023 2024 2025 2026 2027 Baby and Child-specific 12.5 13.6 14.7 15.9 17.1 18.3 Sun Care -- Mass Sun Protection 92.3 97.1 103.3 110.5 118.5 127.7 -- Premium Sun Protection 25.6 26.2 27.0 28.0 29.3 30.9 - Sun Protection 117.9 123.3 130.3 138.5 147.8 158.6 -- Mass Self-Tanning - - - - - - -- Premium Self-Tanning - - - - - - - Self-Tanning - - - - - - -- Mass Aftersun 6.7 6.9 7.1 7.5 7.9 8.4 -- Premium Aftersun 8.1 8.3 8.5 8.8 9.2 9.6 - Aftersun 14.8 15.2 15.6 16.3 17.1 18.0 Adult Sun Care 132.6 138.5 145.9 154.8 164.9 176.6 Sun Care 145.1 152.1 160.7 170.7 182.0 194.9 Source: Euromonitor International from trade associations, trade press, company research, trade interviews, trade sources Table 116 Forecast Sales of Sun Care by Category: % Value Growth 2022-2027 % constant value growth 2022/2023 2022-27 CAGR 2022/27 Total Baby and Child-specific Sun Care 9.0 7.9 46.5 -- Mass Sun Protection 5.2 6.7 38.4 -- Premium Sun Protection 2.5 3.8 20.6 - Sun Protection 4.6 6.1 34.5 -- Mass Self-Tanning - - - -- Premium Self-Tanning - - - - Self-Tanning - - - -- Mass Aftersun 2.9 4.6 25.3 -- Premium Aftersun 2.5 3.6 19.6 - Aftersun 2.7 4.1 22.2
  113. B E A U T Y A N D P

    E R S O N A L C A R E I N V I E T N A M P a s s p o r t 106 © E u r o m o n i t o r I n t e r n a t i o n a l Adult Sun Care 4.4 5.9 33.2 Sun Care 4.8 6.1 34.3 Source: Euromonitor International from trade associations, trade press, company research, trade interviews, trade sources
  114. B E A U T Y A N D P

    E R S O N A L C A R E I N V I E T N A M P a s s p o r t 107 © E u r o m o n i t o r I n t e r n a t i o n a l PREMIUM BEAUTY AND PERSONAL CARE IN VIETNAM - CATEGORY ANALYSIS KEY DATA FINDINGS ▪ Retail value sales grow by 6% in current terms in 2022 to VND12.4 trillion ▪ Premium bath and shower is the best performing category in 2022, with retail value sales growing by 8% in current terms to VND13.7 billion ▪ Shiseido Cosmetics Vietnam Co Ltd is the leading player in 2022, with a retail value share of 22% ▪ Retail sales are set to grow at a current value CAGR of 9% (2022 constant value CAGR of 5%) over the forecast period to VND19.1 trillion 2022 DEVELOPMENTS Premium beauty and personal care maintains growth as optimism returns In 2022, premium beauty and personal care recorded a stronger current value performance than seen since 2019, driving sales above the pre-pandemic level. The reopening of shopping centres and brand stores was the main reason for this growth, since premium brands encouraged consumers to return to stores and try products in person before buying. Higher incomes, with GDP reaching over 8% growth in 2022, made consumers optimistic about the future, and they were willing to pay higher prices for beauty and personal care products as they wanted to look after themselves. In addition, purchasing gifts for women on special occasions such as Women’s Day and Valentine’s Day contributed to growth, since premium brands always offer sophisticated packaging and gift packs containing multiple items to attract consumers. Buying a premium brand to gift is one way of people showing their loved ones they care. Premium skin care remained by far the largest category within premium beauty and personal care in 2022, and was one of only two categories (the other being premium bath and shower) to see current value growth every year over 2020-2022. Customer experience is the most important factor Consumers have to pay higher prices for premium beauty and personal care products; therefore, they also expect to have a better experience and receive value for the extra money spent. The premium segment has been becoming increasingly competitive as the competition for customers increases. Brands are having to customise their products based on local and individual demand, and understand customers to win in the market. For instance, AI (artificial intelligence) technologies and personalisation have been utilised to enhance the experience for customers in-store. For example, Chanel launched Lipscanner, which helps consumers to choose the right colour of lipstick suitable for their skin tone, offering over 400 colours, which is an exciting shopping experience for consumers. Besides, added features in premium products help consumers to justify their higher spending compared with mass products and convince them to buy. For instance, Shiseido introduced its Urban Environment Triple Benefit Beauty
  115. B E A U T Y A N D P

    E R S O N A L C A R E I N V I E T N A M P a s s p o r t 108 © E u r o m o n i t o r I n t e r n a t i o n a l Suncare Emulsion, which contains various added features, such as sun protection, moisturiser, and anti-ageing, bringing the user more youthful and plumper skin. Offline channels remain important for consumers in the premium segment Due to the nature of premium beauty and personal care, many consumers still prefer to check out the ingredients in such products and try them in person, as well as receive consultations and advice on how to apply them, for instance. Therefore, offline retail channels such as shopping centres and brands’ stores are considered more convenient by many consumers of premium products. Nevertheless, e-commerce saw growth across the board during the pandemic, including for sales of premium beauty and personal care products, as consumers spent more time secluded at home. Livestreaming has become a popular method that companies use to showcase and advertise their products, as well as to increase interaction with consumers and improve the shopping experience. Shopee Premium is considered an outstanding e-commerce platform for consumers to purchase premium products from multiple brands, where they can also find various exclusive promotions, such as discounts and free gifts. However, this channel is used mostly by consumers who already know and use a particular premium brand, and use it for the purchase of frequently used items, rather than for new product trials. PROSPECTS AND OPPORTUNITIES Continued growth expected in the coming years with normalisation of lifestyles Even stronger current value growth rates are expected for premium beauty and personal care in the forecast period, with growth projected across all categories. Premium colour cosmetics and fragrances in particular will benefit from the return to pre-pandemic lifestyles, as this will increase consumption occasions. There is also predicted to be an increase in the number of new international companies entering Vietnam, which can be expected to create a large number of jobs in the market, with rising income levels and higher living standards providing an optimistic view for sales of premium products. According to the General Statistics Office, the living standards of households improved in 2022, with per capita income estimated to increase by 9.5% in 2022 compared with 2021. As disposable incomes are set to grow further over the forecast period, consumers are likely to have a more optimistic view of their future spending. This is expected to affect their shopping behaviour, with consumers more willing to spend on premium offerings. The opportunities for choosing premium beauty and personal care products are hence forecast to increase alongside over the coming years. The Vietnamese market is also expected to see more premium brands opening stores in Vietnam, both online and offline, while existing brands will continue to research and develop their products to adapt to the demands of local consumers. Sustainability likely to be an area for development Premium beauty and personal care is expected to become more competitive over the forecast period, with the landscape increasingly accommodating new and existing players. First, various free trade agreements (FTAs) signed with countries such as Thailand, China, Australia, and New Zealand, as well as the EU, in the review period will attract a higher number of international companies, not least due to the up to 0% tariff reduction. Second, as the economy improves post-pandemic, the country has high growth potential within the ASEAN region.
  116. B E A U T Y A N D P

    E R S O N A L C A R E I N V I E T N A M P a s s p o r t 109 © E u r o m o n i t o r I n t e r n a t i o n a l In order to gain a competitive advantage, players will need to look to trends such as sustainability. Young consumers in Vietnam are paying more attention to sustainable products, and from premium brands in particular, consumers expect to see higher levels of sustainable offerings, ranging from ingredient formulation to packaging. According to Euromonitor International’s Voice of the Consumer: Beauty survey 2022, 35% of respondents in Asia Pacific associate natural ingredient formulation as a feature of premium beauty products. Leading global brands are making sustainability commitments which include packaging-related goals. Taking the example of L'Oréal, by 2030, it aims to have 100% of the plastic used for the packaging of its products to come from recycled or bioplastic sources. In the coming years, premium beauty and personal care is expected to see more products with natural origin and environmental claims, as a new standard to convince consumers of their sustainability credentials. E-commerce will see further investment by premium brands Other than improving their offline stores and counters in shopping centres, more premium brands are expected to gradually sell their products on premium e-commerce platforms such as Shopee Premium, or create their own mobile applications to offer consumers the most convenience. Normally, premium brands offer few discounts; therefore, Shopee Premium is forecast to be the most dynamic hub for consumers to see promotions for such products, which is not only exciting the current older customer base, but also younger consumers, who may be able to buy items on their wish list. Consumers also expect to be able to join shopping entertainment or livestreaming sections on social platforms to gain more knowledge about premium products, or receive advice from experts on how to use the products correctly. Thus, the use of livestreams on social networks such as Facebook and TikTok is expected to continue in the forecast period. For example, leading premium skin care brand Shiseido is likely to continue to run livestreams with various skin care experts or celebrities to provide skin care advice and introduce its brands and products to consumers. CATEGORY DATA Table 117 Sales of Premium Beauty and Personal Care by Category: Value 2017-2022 VND billion 2017 2018 2019 2020 2021 2022 - Premium Sun Protection 17.0 23.3 31.8 27.3 24.5 25.6 - Premium Self-Tanning - - - - - - - Premium Aftersun 9.2 9.9 10.6 8.7 7.7 8.1 Premium Adult Sun Care 26.2 33.2 42.4 36.0 32.2 33.6 - Premium Skin Care 100.3 121.0 132.8 124.0 126.9 136.4 Sets/Kits - Premium Hand Care 23.2 24.9 27.3 30.2 32.3 34.2 - Premium Facial Care 4,878.8 5,616.5 6,369.9 6,833.1 7,316.1 7,742.3 - Premium Body Care 40.3 44.8 51.5 57.0 62.8 68.3 Premium Skin Care 5,042.7 5,807.2 6,581.5 7,044.3 7,538.1 7,981.2 Premium Hair Care 622.8 686.0 761.8 813.9 775.0 822.7 - Premium Fragrance 30.6 41.4 53.0 44.7 41.1 44.1 Sets/Kits - Premium Unisex 2.1 2.1 2.2 1.9 1.8 1.9 Fragrances - Premium Women's 1,150.7 1,323.2 1,528.4 1,299.1 1,240.3 1,337.1 Fragrances
  117. B E A U T Y A N D P

    E R S O N A L C A R E I N V I E T N A M P a s s p o r t 110 © E u r o m o n i t o r I n t e r n a t i o n a l - Premium Men's 509.5 560.4 617.6 531.5 500.0 531.6 Fragrances Premium Fragrances 1,692.8 1,927.2 2,201.1 1,877.2 1,783.2 1,914.8 Premium Deodorants 97.1 166.4 236.3 262.2 254.3 264.4 - Premium Colour 3.9 4.6 5.1 3.9 2.8 3.0 Cosmetics Sets/Kits - Premium Nail Products - - - - - - - Premium Lip Products 609.6 690.5 758.9 618.8 542.9 578.7 - Premium Facial Make-Up 599.2 662.1 736.4 607.7 540.4 579.3 - Premium Eye Make-Up 204.9 214.1 225.9 175.4 152.6 160.8 Premium Colour Cosmetics 1,417.6 1,571.3 1,726.3 1,405.7 1,238.6 1,321.8 Premium Bath and Shower 6.7 10.0 12.4 12.5 12.7 13.7 Premium Baby and Child- - - - - - - specific Products Premium Beauty and 8,905.8 10,201.3 11,561.7 11,451.8 11,634.0 12,352.3 Personal Care Source: Euromonitor International from official statistics, trade associations, trade press, company research, store checks, trade interviews, trade sources Note: Premium beauty and personal care sales are additionally included within baby and child-specific products, bath and shower, colour cosmetics, deodorants, fragrances, hair care, skin care and sun care Table 118 Sales of Premium Beauty and Personal Care by Category: % Value Growth 2017-2022 % current value growth 2021/22 2017-22 CAGR 2017/22 Total - Premium Sun Protection 4.3 8.5 50.6 - Premium Self-Tanning - - - - Premium Aftersun 5.1 -2.6 -12.4 Premium Adult Sun Care 4.5 5.1 28.5 - Premium Skin Care Sets/Kits 7.5 6.3 36.0 - Premium Hand Care 5.8 8.0 47.2 - Premium Facial Care 5.8 9.7 58.7 - Premium Body Care 8.8 11.1 69.5 Premium Skin Care 5.9 9.6 58.3 Premium Hair Care 6.2 5.7 32.1 - Premium Fragrance Sets/Kits 7.4 7.6 44.2 - Premium Unisex Fragrances 7.4 -1.2 -5.8 - Premium Women's Fragrances 7.8 3.0 16.2 - Premium Men's Fragrances 6.3 0.9 4.3 Premium Fragrances 7.4 2.5 13.1 Premium Deodorants 4.0 22.2 172.4 - Premium Colour Cosmetics Sets/Kits 9.8 -4.8 -22.0 - Premium Nail Products - - - - Premium Lip Products 6.6 -1.0 -5.1 - Premium Facial Make-Up 7.2 -0.7 -3.3 - Premium Eye Make-Up 5.4 -4.7 -21.5 Premium Colour Cosmetics 6.7 -1.4 -6.8 Premium Bath and Shower 8.0 15.3 103.8 Premium Baby and Child-specific Products - - - Premium Beauty and Personal Care 6.2 6.8 38.7 Source: Euromonitor International from official statistics, trade associations, trade press, company research, store checks, trade interviews, trade sources Note: Premium beauty and personal care sales are additionally included within baby and child-specific products, bath and shower, colour cosmetics, deodorants, fragrances, hair care, skin care and sun care
  118. B E A U T Y A N D P

    E R S O N A L C A R E I N V I E T N A M P a s s p o r t 111 © E u r o m o n i t o r I n t e r n a t i o n a l Table 119 NBO Company Shares of Premium Beauty and Personal Care: % Value 2018- 2022 % retail value rsp Company 2018 2019 2020 2021 2022 Shiseido Cosmetics 23.6 22.6 22.9 22.7 22.1 Vietnam Co Ltd L'Oréal Vietnam Co Ltd 14.9 15.9 18.2 19.3 20.0 Estée Lauder Vietnam Co Ltd 11.4 11.2 10.0 9.4 8.0 AmorePacific Vietnam JSC 3.8 3.8 4.4 4.9 5.0 LG Vina Cosmetics Co Ltd 4.9 4.7 3.7 3.5 3.6 Coty Beauty Vietnam Co Ltd 3.4 3.4 3.1 2.7 2.7 Chanel SA 2.5 2.6 2.2 2.1 2.1 Hanoi International 1.1 1.3 1.7 2.0 1.9 Friendship Hospital JSC Nippon Menard Cosmetic Co 2.0 1.9 1.9 1.8 1.8 Ltd Inter Parfums Asia 1.3 1.3 1.2 1.8 1.8 Pacific Pte Ltd Pierre Fabre SA, 1.1 1.1 1.5 1.7 1.8 Laboratoires Amway Vietnam Co Ltd 1.7 1.7 1.6 1.6 1.7 Inter Parfums Inc - - - - 1.3 Clarins SA 1.2 1.2 1.1 1.1 1.1 Kanebo Cosmetics Inc 1.4 1.3 1.2 1.1 1.1 NAOS SAS 0.6 0.6 0.7 0.8 0.8 Christian Dior SA, Parfums 1.0 1.0 0.9 0.8 0.8 Elizabeth Arden Inc 0.9 0.7 0.7 0.7 0.6 Nu Skin Vietnam Co Ltd 0.3 0.4 0.5 0.6 0.6 Mascolo Ltd 0.6 0.6 0.6 0.6 0.6 Dermalogica Vietnam Co Ltd 0.8 0.6 0.6 0.5 0.5 Euroitalia Srl 0.6 0.6 0.5 0.5 0.4 Creative Nature Group 0.5 0.5 0.5 0.4 0.4 John Paul Mitchell 0.5 0.4 0.5 0.4 0.4 Systems Inc Givenchy SA, Parfums 0.4 0.4 0.4 0.4 0.4 Make Up For Ever Co Ltd 0.4 0.4 0.3 0.2 0.3 Kenzo Parfums SA 0.2 0.2 0.2 0.2 0.2 Revlon Inc 0.2 0.2 0.2 0.1 0.1 Hals Group 0.1 0.1 0.1 0.1 0.1 Puig SL 0.4 0.1 0.1 0.1 0.1 Salvatore Ferragamo SpA 0.9 0.9 0.7 - - Others 17.3 18.0 17.9 18.0 17.8 Total 100.0 100.0 100.0 100.0 100.0 Source: Euromonitor International from official statistics, trade associations, trade press, company research, store checks, trade interviews, trade sources Table 120 LBN Brand Shares of Premium Beauty and Personal Care: % Value 2019-2022 % retail value rsp Brand (GBO) Company (NBO) 2019 2020 2021 2022 Shiseido (Shiseido Co Shiseido Cosmetics 20.2 20.6 20.6 20.0 Ltd) Vietnam Co Ltd Lancôme (L'Oréal L'Oréal Vietnam Co Ltd 5.5 5.9 6.0 6.2 Groupe) Vichy (L'Oréal Groupe) L'Oréal Vietnam Co Ltd 2.8 3.8 4.5 4.8 La Roche-Posay L'Oréal Vietnam Co Ltd 1.9 2.5 3.0 3.2
  119. B E A U T Y A N D P

    E R S O N A L C A R E I N V I E T N A M P a s s p o r t 112 © E u r o m o n i t o r I n t e r n a t i o n a l (L'Oréal Groupe) Estée Lauder (Estée Estée Lauder Vietnam Co Ltd 3.4 3.4 3.2 3.2 Lauder Cos Inc) Laneíge (AmorePacific AmorePacific Vietnam JSC 2.1 2.4 2.7 2.8 Corp) L'Oréal Professionnel L'Oréal Vietnam Co Ltd 2.8 3.0 2.8 2.8 (L'Oréal Groupe) Clinique (Estée Estée Lauder Vietnam Co Ltd 2.7 2.4 2.3 2.2 Lauder Cos Inc) Sulwhasoo AmorePacific Vietnam JSC 1.7 1.9 2.1 2.1 (AmorePacific Corp) Chanel Chanel SA 2.6 2.2 2.1 2.1 Mac (Estée Lauder Cos Estée Lauder Vietnam Co Ltd 2.8 2.4 2.0 2.0 Inc) Paula's Choice Hanoi International - - 2.0 1.9 (Unilever Group) Friendship Hospital JSC The History of Whoo LG Vina Cosmetics Co Ltd 2.3 1.8 1.8 1.9 (LG Household & Health Care Ltd) Menard Nippon Menard Cosmetic Co 1.9 1.9 1.8 1.8 Ltd Avène Pierre Fabre SA, 1.1 1.5 1.7 1.8 Laboratoires Kiehl's (L'Oréal L'Oréal Vietnam Co Ltd 1.1 1.2 1.3 1.3 Groupe) DKNY Inter Parfums Inc - - - 1.3 Clarins Clarins SA 1.2 1.1 1.1 1.1 Kanebo (Kao Corp) Kanebo Cosmetics Inc 1.3 1.2 1.1 1.1 Issey Miyake Shiseido Cosmetics 1.2 1.1 1.1 1.0 (Shiseido Co Ltd) Vietnam Co Ltd Shu Uemura (L'Oréal L'Oréal Vietnam Co Ltd 1.1 1.0 1.0 1.0 Groupe) O HUI (LG Household & LG Vina Cosmetics Co Ltd 1.6 1.1 1.0 1.0 Health Care Ltd) Davidoff (Coty Inc) Coty Beauty Vietnam Co Ltd 1.2 1.1 1.0 1.0 Bioderma NAOS SAS 0.6 0.7 0.8 0.8 Dior (LVMH Moët Christian Dior SA, Parfums 1.0 0.9 0.8 0.8 Hennessy Louis Vuitton SA) Jean Paul Gaultier Shiseido Cosmetics 0.8 0.7 0.7 0.7 (Puig SL) Vietnam Co Ltd Salvatore Ferragamo Inter Parfums Asia - - 0.6 0.7 (Inter Parfums Inc) Pacific Pte Ltd Elizabeth Arden Elizabeth Arden Inc 0.7 0.7 0.7 0.6 (Revlon Inc) Coach (Inter Parfums Inter Parfums Asia 0.7 0.6 0.6 0.6 Inc) Pacific Pte Ltd Nu Skin (Nu Skin Nu Skin Vietnam Co Ltd 0.4 0.5 0.6 0.6 Enterprises Inc) DKNY (Estée Lauder Estée Lauder Vietnam Co Ltd 1.5 1.3 1.2 - Cos Inc) Paula's Choice Hanoi International 1.3 1.7 - - (Paula's Choice LLC) Friendship Hospital JSC Salvatore Ferragamo Salvatore Ferragamo SpA 0.9 0.7 - - Others Others 29.6 28.5 27.7 27.5 Total Total 100.0 100.0 100.0 100.0 Source: Euromonitor International from official statistics, trade associations, trade press, company research, store checks, trade interviews, trade sources
  120. B E A U T Y A N D P

    E R S O N A L C A R E I N V I E T N A M P a s s p o r t 113 © E u r o m o n i t o r I n t e r n a t i o n a l Table 121 Forecast Sales of Premium Beauty and Personal Care by Category: Value 2022-2027 VND billion 2022 2023 2024 2025 2026 2027 - Premium Sun Protection 25.6 26.2 27.0 28.0 29.3 30.9 - Premium Self-Tanning - - - - - - - Premium Aftersun 8.1 8.3 8.5 8.8 9.2 9.6 Premium Adult Sun Care 33.6 34.5 35.5 36.8 38.5 40.5 - Premium Skin Care 136.4 146.0 156.0 166.2 175.8 184.0 Sets/Kits - Premium Hand Care 34.2 35.2 36.7 38.2 40.0 42.0 - Premium Facial Care 7,742.3 8,015.0 8,367.3 8,757.3 9,198.7 9,702.2 - Premium Body Care 68.3 70.3 72.3 74.2 75.8 77.4 Premium Skin Care 7,981.2 8,266.5 8,632.3 9,035.9 9,490.3 10,005.6 Premium Hair Care 822.7 853.5 890.0 931.6 969.5 1,013.0 - Premium Fragrance 44.1 46.1 48.7 51.6 55.4 60.0 Sets/Kits - Premium Unisex 1.9 2.0 2.1 2.2 2.3 2.4 Fragrances - Premium Women's 1,337.1 1,418.9 1,498.8 1,576.9 1,652.3 1,727.0 Fragrances - Premium Men's 531.6 566.4 604.3 647.6 696.2 751.1 Fragrances Premium Fragrances 1,914.8 2,033.4 2,153.8 2,278.2 2,406.2 2,540.5 Premium Deodorants 264.4 274.1 286.0 300.6 317.4 340.2 - Premium Colour 3.0 3.2 3.5 3.8 4.1 4.5 Cosmetics Sets/Kits - Premium Nail Products - - - - - - - Premium Lip Products 578.7 608.0 638.3 668.7 700.4 733.2 - Premium Facial Make-Up 579.3 609.2 645.7 687.5 738.7 800.2 - Premium Eye Make-Up 160.8 169.8 180.8 193.9 208.7 226.4 Premium Colour Cosmetics 1,321.8 1,390.3 1,468.4 1,553.9 1,652.0 1,764.4 Premium Bath and Shower 13.7 14.7 16.0 17.4 18.8 26.3 Premium Baby and Child- - - - - - - specific Products Premium Beauty and 12,352.3 12,866.9 13,482.0 14,154.4 14,892.7 15,730.4 Personal Care Source: Euromonitor International from trade associations, trade press, company research, trade interviews, trade sources Note: Premium beauty and personal care sales are additionally included within baby and child-specific products, bath and shower, colour cosmetics, deodorants, fragrances, hair care, skin care and sun care Table 122 Forecast Sales of Premium Beauty and Personal Care by Category: % Value Growth 2022-2027 % constant value growth 2022/2023 2022-27 CAGR 2022/27 Total - Premium Sun Protection 2.5 3.8 20.6 - Premium Self-Tanning - - - - Premium Aftersun 2.5 3.6 19.6 Premium Adult Sun Care 2.5 3.8 20.4 - Premium Skin Care Sets/Kits 7.0 6.2 34.9 - Premium Hand Care 3.1 4.2 22.9 - Premium Facial Care 3.5 4.6 25.3 - Premium Body Care 3.0 2.5 13.3 Premium Skin Care 3.6 4.6 25.4
  121. B E A U T Y A N D P

    E R S O N A L C A R E I N V I E T N A M P a s s p o r t 114 © E u r o m o n i t o r I n t e r n a t i o n a l Premium Hair Care 3.7 4.2 23.1 - Premium Fragrance Sets/Kits 4.5 6.3 36.0 - Premium Unisex Fragrances 3.7 4.0 21.7 - Premium Women's Fragrances 6.1 5.3 29.2 - Premium Men's Fragrances 6.5 7.2 41.3 Premium Fragrances 6.2 5.8 32.7 Premium Deodorants 3.7 5.2 28.7 - Premium Colour Cosmetics Sets/Kits 7.4 8.3 49.1 - Premium Nail Products - - - - Premium Lip Products 5.1 4.8 26.7 - Premium Facial Make-Up 5.2 6.7 38.1 - Premium Eye Make-Up 5.6 7.1 40.9 Premium Colour Cosmetics 5.2 5.9 33.5 Premium Bath and Shower 7.0 13.9 91.7 Premium Baby and Child-specific Products - - - Premium Beauty and Personal Care 4.2 5.0 27.3 Source: Euromonitor International from trade associations, trade press, company research, trade interviews, trade sources Note: Premium beauty and personal care sales are additionally included within baby and child-specific products, bath and shower, colour cosmetics, deodorants, fragrances, hair care, skin care and sun care
  122. B E A U T Y A N D P

    E R S O N A L C A R E I N V I E T N A M P a s s p o r t 115 © E u r o m o n i t o r I n t e r n a t i o n a l MASS BEAUTY AND PERSONAL CARE IN VIETNAM - CATEGORY ANALYSIS KEY DATA FINDINGS ▪ Retail value sales grow by 5% in current terms in 2022 to VND40.0 trillion ▪ Mass colour cosmetics is the best performing category in 2022, with retail value sales growing by 7% in current terms to VND1.7 trillion ▪ Unilever Vietnam International Co Ltd is the leading player in 2022, with a retail value share of 24% ▪ Retail sales are set to rise at a current value CAGR of 9% (2022 constant value CAGR of 5%) over the forecast period to VND62.3 trillion 2022 DEVELOPMENTS Mass beauty and personal care sees solid growth in 2022 Mass beauty and personal care in Vietnam recorded solid current value growth in 2022, seeing complete recovery from the slight sales decline seen the previous year due to the pandemic. Growth was seen across all categories, although those hit the hardest in 2020 and 2021 were still unable to return to the pre-pandemic level of current value sales, including mass colour cosmetics and mass fragrances. As consumers tended to pay more attention to their spending, and were keen on value for money items, mass products with a long history and well- known brand names found it easier to win share. Meanwhile, the spread of TikTok, YouTube and Facebook penetration to rural areas strongly contributed to growth for mass beauty and personal care. Younger people with limited budgets prioritised choosing products which received good reviews and feedback on social media, or those with recommendations from trusted influencers. Global brands continue to lead with dynamic activities Global players continue to lead mass beauty and personal care in Vietnam, supported by their long-established presence, high brand recognition and, increasingly, a focus on digital marketing in the wake of the pandemic. Unilever Vietnam International Co Ltd, which maintained its strong lead in mass beauty and personal care in value terms in 2022, offers multiple brands across a range of categories, including mass hair care, bath and shower, deodorants, skin care and colour cosmetics, through brands including Lifebuoy, Dove, Sunsilk, Clear, and Pond’s. In addition to a wide range of strong brands, Unilever’s position is underpinned by dynamic marketing, including digital, and a wide distribution network across Vietnam, alongside innovation and new product development. In terms of sustainability, its brands are reducing the use of plastic in their packaging, working towards NDPE (No Deforestation, Peat or Exploitation). Marketing messages are important for driving growth for Unilever brands. For instance, Dove’s marketing message is that consumers should have the confidence to express themselves. Meanwhile, Unilever has also raised brand awareness through social activities,
  123. B E A U T Y A N D P

    E R S O N A L C A R E I N V I E T N A M P a s s p o r t 116 © E u r o m o n i t o r I n t e r n a t i o n a l such as “R?a tay v?i xà phòng vì m?t Vi?t Nam kh?e m?nh hon” from Lifebouy, which means “Wash your hands with soap for a healthier Vietnam“; and “B?o v? n? cu?i Vi?t Nam” from the P/S oral care brand, which means “Protect the Vietnamese smile”. Meanwhile, Maybelline New York from L'Oréal Vietnam saw one of the strongest value growth rates in 2022, and regained the lead in mass colour cosmetics in this year. It is a top-of-mind brand in terms of value for money, and aims to empower women through its actions. For example, it launched the campaign #Maybeli on TikTok, with the hashtag expressing the goal of empowering women in society, conveying its brand message through music and dance. The campaign went viral and the brand received 173 million video views. Ingredients previously only seen in premium brands now offered by mass brands New ingredients and features are always being researched and developed by brands, and applied quickly across all mass beauty and personal care categories, due to strong competitiveness and rapidly-changing consumer demand. For instance, long-lasting herbal and sweet scents are offered in hair care and body care products, as this an important feature to attract consumers. Meanwhile, active ingredients such as retinol and niacinamide, which were previously mainly seen in the premium segment, are gradually also being used in mass products and claim to boost product efficacy; for example, Vaseline Brightening Body Lotion 5% Niacinamide and Olay B3+ Retinol Body Lotion are brands advertised on social media. Such new product developments helped to drive dynamic current value growth for skin care in 2022 – the only mass beauty and personal care category to see growth in all years since the pandemic. The premiumisation of the mass segment is in line with Vietnamese consumers’ willingness to spend more on higher-quality beauty and personal care products. PROSPECTS AND OPPORTUNITIES Dynamic growth as spending increases amongst the rural population Supported by higher incomes and higher personal hygiene standards, consumers in Vietnam are paying more attention to the usage of beauty and personal care products than in previous years, and this is set to continue in the forecast period. Rising awareness and increasing product availability also mean that consumers have more options available to them than ever before. Demand has been rising in rural areas in particular, and people in rural areas are also gradually using more task-specific products. For instance, while before, they may have used shampoo for both their hair and body, more people are now switching to using a shampoo on their hair and body wash/shower gel for washing their body. Combined with continued concern to receive good value for money, these trends are expected to drive strong current value growth in mass beauty and personal care in the forecast period. Growth will also be attributed to big players using trendy ingredients and carrying out marketing campaigns to target the appropriate consumer group across all provinces. Consumers will pay more attention to scents, packaging, formats, and ingredients In the forecast period, consumers are expected to pay more attention to their purchases in mass beauty and personal care, especially products such as shampoos, body wash/shower gel, and skin care. They will check the ingredients these products contain, and invest more time and effort in research, reading feedback online before buying. They understand more about what they are purchasing – for example, when purchasing fragrances, consumers can read the scent
  124. B E A U T Y A N D P

    E R S O N A L C A R E I N V I E T N A M P a s s p o r t 117 © E u r o m o n i t o r I n t e r n a t i o n a l ingredients information on the packaging and have a good idea of the fragrance, and are therefore now more confident buying such products online. While scent is the most attractive factor to consumers when it comes to purchasing mass products, natural ingredients such as rosemary, pennywort, and rice are also making consumers curious to try new products. Besides, the packaging is also an important factor, which is gradually becoming simpler in terms of colours, but also needs to carry all the necessary product information. Product formats are also becoming more varied, such as dry shampoo and serum lotion deodorant, amongst others, giving consumers a wide range of products from which to choose. E-commerce set to remain an important distribution channel E-commerce was seeing dynamic growth even before the pandemic, but saw an acceleration in 2020 as people stayed at home as much as possible. However, even as life returned to normal as the pandemic eased, e-commerce maintained growth in mass beauty and personal care as consumers valued the convenience, wide product assortment and competitive prices of this channel. Over the forecast period, mass players are expected to continue to cooperate with popular e-commerce platforms available in Vietnam, such as Tiki.vn, Lazada.vn and Shopee.vn, in an attempt to widen their reach and expand their consumer base. More companies are expected to set up stores on these online platforms to enable consumers to easily search for and compare products. In addition, the development of e-commerce sites’ logistics to rural areas (such as Lazada and Shopee) will allow for fast delivery, which will support more consumers being willing to buy beauty and personal care products online than ever before. Social media livestreams, such as via TikTok and Facebook, which help people relax and shop, are expected to remain lucrative, particularly as various trends emerge and go viral. On the other hand, mini supermarkets and offline pharmacies, including Bach Hoa Xanh, and Pharmacity, are also reaching rural areas, which will also contribute strongly to the growth of mass beauty and personal care in the forecast period. CATEGORY DATA Table 123 Sales of Mass Beauty and Personal Care by Category: Value 2017-2022 VND billion 2017 2018 2019 2020 2021 2022 - Mass Sun Protection 83.2 98.2 111.1 97.3 87.5 92.3 - Mass Self-Tanning - - - - - - - Mass Aftersun 6.8 7.4 8.0 6.9 6.3 6.7 Mass Adult Sun Care 90.0 105.6 119.1 104.2 93.9 99.0 - Mass Skin Care Sets/ 307.8 373.7 446.3 515.4 562.6 610.1 Kits - Mass Hand Care 101.1 110.9 122.5 135.8 147.9 158.6 - Mass Facial Care 6,870.7 7,499.9 8,272.8 9,469.7 10,347.6 11,238.1 - Mass Body Care 845.3 951.8 1,077.3 1,184.7 1,261.9 1,375.8 Mass Skin Care 8,124.8 8,936.3 9,918.9 11,305.7 12,320.0 13,382.6 Mass Hair Care 13,726.5 14,268.3 15,068.5 15,673.6 15,115.9 15,430.8 - Mass Fragrance Sets/ 3.0 4.0 5.1 4.4 4.1 4.3 Kits - Mass Unisex Fragrances - - - - - - - Mass Women's Fragrances 359.9 395.9 415.8 366.0 332.2 353.5 - Mass Men's Fragrances 238.9 260.4 280.9 247.2 228.2 241.1 Mass Fragrances 601.7 660.3 701.8 617.6 564.5 598.9 Mass Deodorants 1,594.6 1,804.3 2,022.5 2,176.8 2,090.8 2,172.6 - Mass Colour Cosmetics 31.8 40.8 50.2 43.3 37.8 40.5
  125. B E A U T Y A N D P

    E R S O N A L C A R E I N V I E T N A M P a s s p o r t 118 © E u r o m o n i t o r I n t e r n a t i o n a l Sets/Kits - Mass Nail Products 105.9 124.0 147.3 133.2 103.1 112.5 - Mass Lip Products 411.5 473.5 576.3 466.3 423.2 453.5 - Mass Facial Make-Up 681.6 807.1 958.0 840.3 751.8 810.0 - Mass Eye Make-Up 302.7 348.1 401.2 341.8 307.8 328.0 Mass Colour Cosmetics 1,533.5 1,793.5 2,133.0 1,824.8 1,623.6 1,744.5 Mass Bath and Shower 3,583.6 3,833.5 4,089.0 5,189.7 4,884.8 5,155.1 Mass Baby and Child- 1,337.2 1,406.9 1,499.9 1,475.9 1,395.5 1,446.7 specific Products Mass Beauty and 30,592.0 32,808.6 35,552.7 38,368.4 38,089.0 40,030.0 Personal Care Source: Euromonitor International from official statistics, trade associations, trade press, company research, store checks, trade interviews, trade sources Note: Mass beauty and personal care sales are additionally included within baby and child-specific products, bath and shower, colour cosmetics, deodorants, fragrances, hair care, skin care and sun care Table 124 Sales of Mass Beauty and Personal Care by Category: % Value Growth 2017- 2022 % current value growth 2021/22 2017-22 CAGR 2017/22 Total - Mass Sun Protection 5.4 2.1 10.9 - Mass Self-Tanning - - - - Mass Aftersun 5.6 -0.4 -1.9 Mass Adult Sun Care 5.4 1.9 9.9 - Mass Skin Care Sets/Kits 8.4 14.7 98.2 - Mass Hand Care 7.2 9.4 56.9 - Mass Facial Care 8.6 10.3 63.6 - Mass Body Care 9.0 10.2 62.8 Mass Skin Care 8.6 10.5 64.7 Mass Hair Care 2.1 2.4 12.4 - Mass Fragrance Sets/Kits 6.4 7.8 45.4 - Mass Unisex Fragrances - - - - Mass Women's Fragrances 6.4 -0.4 -1.8 - Mass Men's Fragrances 5.6 0.2 0.9 Mass Fragrances 6.1 -0.1 -0.5 Mass Deodorants 3.9 6.4 36.2 - Mass Colour Cosmetics Sets/Kits 7.2 4.9 27.3 - Mass Nail Products 9.1 1.2 6.2 - Mass Lip Products 7.2 2.0 10.2 - Mass Facial Make-Up 7.7 3.5 18.8 - Mass Eye Make-Up 6.6 1.6 8.4 Mass Colour Cosmetics 7.4 2.6 13.8 Mass Bath and Shower 5.5 7.5 43.9 Mass Baby and Child-specific Products 3.7 1.6 8.2 Mass Beauty and Personal Care 5.1 5.5 30.9 Source: Euromonitor International from official statistics, trade associations, trade press, company research, store checks, trade interviews, trade sources Note: Mass beauty and personal care sales are additionally included within baby and child-specific products, bath and shower, colour cosmetics, deodorants, fragrances, hair care, skin care and sun care Table 125 NBO Company Shares of Mass Beauty and Personal Care: % Value 2018-2022 % retail value rsp Company 2018 2019 2020 2021 2022 Unilever Vietnam 25.6 24.7 25.3 24.3 23.9
  126. B E A U T Y A N D P

    E R S O N A L C A R E I N V I E T N A M P a s s p o r t 119 © E u r o m o n i t o r I n t e r n a t i o n a l International Co Ltd Procter & Gamble Vietnam 6.2 5.9 5.5 5.3 5.3 Ltd Unza Vietnam Co Ltd 4.6 4.7 4.9 4.8 4.8 Beiersdorf Vietnam Ltd Co 4.3 4.5 4.4 4.5 4.4 LG Vina Cosmetics Co Ltd 2.9 2.9 2.8 2.9 3.0 International Consumer 3.3 3.1 3.1 2.9 2.8 Products Co Ltd L'Oréal Vietnam Co Ltd 1.9 1.9 1.7 1.6 1.8 AmorePacific Vietnam JSC 0.6 0.7 1.0 1.1 1.3 Rohto-Mentholatum Vietnam 1.0 1.1 1.1 1.1 1.1 Co Ltd Sao Thai Duong Cosmetics 1.0 1.1 1.0 1.0 0.9 JSC Hoa Linh Pharma Co Ltd 0.8 0.8 0.8 0.7 0.8 Oriflame Vietnam Ltd - - 1.0 0.6 0.6 Johnson & Johnson Vietnam 0.7 0.7 0.6 0.6 0.6 Co Ltd Saigon Cosmetics Corp 0.8 0.8 0.6 0.6 0.6 Nestlé SA 0.4 0.4 0.5 0.5 0.5 Sanofi-Aventis Vietnam Co 0.5 0.5 0.5 0.5 0.5 Ltd Dai Viet Huong Trading 0.6 0.5 0.5 0.5 0.4 Manufacturing Co Ltd Body Shop (Vietnam) Co 0.4 0.4 0.4 0.4 0.4 Ltd, The Hoyu Corp 0.4 0.4 0.4 0.4 0.4 Revlon Inc 0.5 0.5 0.4 0.4 0.4 Henkel Vietnam Co Ltd 0.3 0.3 0.4 0.4 0.4 Coty Beauty Vietnam Co Ltd 0.4 0.4 0.3 0.3 0.3 Fine Today Shiseido Co Ltd - - - 0.3 0.3 Kao Vietnam Ltd 0.3 0.3 0.2 0.3 0.2 MOI Cosmetics Co Ltd 0.1 0.2 0.2 0.2 0.2 Minh Viet International JSC 0.3 0.3 0.3 0.2 0.2 Viet My Hoa Phong Co Ltd 0.3 0.2 0.2 0.2 0.2 Bübchen-Werk Ewald Hermes 0.3 0.3 0.2 0.2 0.2 Pharmazeutische Fabrik GmbH Dang Duong Comestic Co Ltd 0.2 0.2 0.2 0.2 0.2 3Ri Chemical Co Ltd 0.0 0.0 0.2 0.2 0.2 Thuong Xuan Cosmetic Co Ltd 1.8 1.8 - - - Others 39.4 40.3 41.1 43.0 43.0 Total 100.0 100.0 100.0 100.0 100.0 Source: Euromonitor International from official statistics, trade associations, trade press, company research, store checks, trade interviews, trade sources Table 126 LBN Brand Shares of Mass Beauty and Personal Care: % Value 2019-2022 % retail value rsp Brand (GBO) Company (NBO) 2019 2020 2021 2022 Lifebuoy (Unilever Unilever Vietnam 4.0 5.2 4.7 4.6 Group) International Co Ltd Clear (Unilever Group) Unilever Vietnam 5.1 4.9 4.7 4.6 International Co Ltd Sunsilk (Unilever Unilever Vietnam 4.2 4.0 3.8 3.8 Group) International Co Ltd Pond's (Unilever Group) Unilever Vietnam 3.3 3.4 3.6 3.6 International Co Ltd Dove (Unilever Group) Unilever Vietnam 3.8 3.6 3.4 3.4
  127. B E A U T Y A N D P

    E R S O N A L C A R E I N V I E T N A M P a s s p o r t 120 © E u r o m o n i t o r I n t e r n a t i o n a l International Co Ltd X-Men (Marico Ltd) International Consumer 3.1 3.1 2.9 2.8 Products Co Ltd Nivea (Beiersdorf AG) Beiersdorf Vietnam Ltd Co 2.4 2.4 2.4 2.3 Enchanteur (Wipro Ltd) Unza Vietnam Co Ltd 2.1 2.2 2.3 2.3 Romano (Wipro Ltd) Unza Vietnam Co Ltd 2.3 2.3 2.2 2.2 The Face Shop (LG LG Vina Cosmetics Co Ltd 1.9 2.0 2.0 2.2 Household & Health Care Ltd) Head & Shoulders Procter & Gamble Vietnam 1.8 1.7 1.6 1.6 (Procter & Gamble Co, Ltd The) Pantene (Procter & Procter & Gamble Vietnam 1.8 1.7 1.6 1.6 Gamble Co, The) Ltd Clear Men (Unilever Unilever Vietnam 1.6 1.6 1.4 1.4 Group) International Co Ltd Rejoice (Procter & Procter & Gamble Vietnam 1.5 1.4 1.3 1.4 Gamble Co, The) Ltd Nivea Men Deodorant Beiersdorf Vietnam Ltd Co 1.2 1.2 1.2 1.1 (Beiersdorf AG) Innisfree AmorePacific Vietnam JSC 0.7 0.8 0.9 1.1 (AmorePacific Corp) Thai Duong Sao Thai Duong Cosmetics JSC 1.1 1.0 1.0 0.9 Maybelline New York L'Oréal Vietnam Co Ltd 1.0 0.8 0.7 0.9 (L'Oréal Groupe) Da Huong Hoa Linh Pharma Co Ltd 0.8 0.8 0.7 0.8 TRESemmé (Unilever Unilever Vietnam 0.7 0.7 0.7 0.7 Group) International Co Ltd L'Oréal Paris Dermo- L'Oréal Vietnam Co Ltd 0.6 0.6 0.6 0.6 Expertise (L'Oréal Groupe) Hazeline (Unilever Unilever Vietnam 0.7 0.6 0.6 0.6 Group) International Co Ltd Oriflame (Oriflame Oriflame Vietnam Ltd - 1.0 0.6 0.6 Cosmetics SA) Double Rich (LG LG Vina Cosmetics Co Ltd 0.6 0.6 0.6 0.6 Household & Health Care Ltd) Nivea Men (Beiersdorf Beiersdorf Vietnam Ltd Co 0.5 0.5 0.5 0.5 AG) Olay (Procter & Procter & Gamble Vietnam 0.5 0.5 0.5 0.5 Gamble Co, The) Ltd Cetaphil (Galderma SA) Nestlé SA 0.4 0.5 0.5 0.5 The Body Shop Body Shop (Vietnam) Co 0.4 0.4 0.4 0.4 (Natura&Co) Ltd, The Johnson's Baby Johnson & Johnson Vietnam 0.5 0.4 0.4 0.4 (Johnson & Johnson Inc) Co Ltd Bigen (Hoyu Co Ltd) Hoyu Corp 0.4 0.4 0.4 0.4 Oriflame (Oriflame Thuong Xuan Cosmetic Co Ltd 1.8 - - - Cosmetics SA) Others Others 49.0 49.7 51.5 51.7 Total Total 100.0 100.0 100.0 100.0 Source: Euromonitor International from official statistics, trade associations, trade press, company research, store checks, trade interviews, trade sources Table 127 Forecast Sales of Mass Beauty and Personal Care by Category: Value 2022- 2027 VND billion
  128. B E A U T Y A N D P

    E R S O N A L C A R E I N V I E T N A M P a s s p o r t 121 © E u r o m o n i t o r I n t e r n a t i o n a l 2022 2023 2024 2025 2026 2027 - Mass Sun Protection 92.3 97.1 103.3 110.5 118.5 127.7 - Mass Self-Tanning - - - - - - - Mass Aftersun 6.7 6.9 7.1 7.5 7.9 8.4 Mass Adult Sun Care 99.0 104.0 110.5 118.0 126.4 136.1 - Mass Skin Care Sets/ 610.1 660.4 712.4 763.5 814.3 865.1 Kits - Mass Hand Care 158.6 165.4 173.0 181.3 191.1 202.6 - Mass Facial Care 11,238.1 11,883.2 12,634.8 13,536.8 14,548.2 15,679.3 - Mass Body Care 1,375.8 1,466.8 1,560.4 1,656.0 1,752.6 1,851.9 Mass Skin Care 13,382.6 14,175.9 15,080.5 16,137.6 17,306.2 18,598.9 Mass Hair Care 15,430.8 15,789.4 16,278.0 16,849.6 17,486.7 18,175.0 - Mass Fragrance Sets/ 4.3 4.5 4.7 4.8 5.0 5.3 Kits - Mass Unisex Fragrances - - - - - - - Mass Women's Fragrances 353.5 370.6 384.6 398.1 407.9 414.7 - Mass Men's Fragrances 241.1 250.9 260.1 267.8 274.6 280.5 Mass Fragrances 598.9 625.9 649.4 670.7 687.5 700.5 Mass Deodorants 2,172.6 2,249.6 2,344.8 2,462.4 2,597.0 2,752.3 - Mass Colour Cosmetics 40.5 42.3 44.5 46.9 49.5 52.3 Sets/Kits - Mass Nail Products 112.5 118.3 124.2 129.5 134.8 139.9 - Mass Lip Products 453.5 476.6 503.5 534.6 572.4 619.3 - Mass Facial Make-Up 810.0 866.8 931.3 1,004.3 1,088.4 1,184.5 - Mass Eye Make-Up 328.0 343.5 361.6 382.2 406.7 434.1 Mass Colour Cosmetics 1,744.5 1,847.6 1,965.1 2,097.6 2,252.0 2,430.1 Mass Bath and Shower 5,155.1 5,411.5 5,687.2 5,968.7 6,256.2 6,538.7 Mass Baby and Child- 1,446.7 1,505.6 1,588.0 1,683.5 1,790.2 1,908.9 specific Products Mass Beauty and 40,030.0 41,709.5 43,703.5 45,988.0 48,502.1 51,240.5 Personal Care Source: Euromonitor International from trade associations, trade press, company research, trade interviews, trade sources Note: Mass beauty and personal care sales are additionally included within baby and child-specific products, bath and shower, colour cosmetics, deodorants, fragrances, hair care, skin care and sun care. Table 128 Forecast Sales of Mass Beauty and Personal Care by Category: % Value Growth 2022-2027 % constant value growth 2022/2023 2022-27 CAGR 2022/27 Total - Mass Sun Protection 5.2 6.7 38.4 - Mass Self-Tanning - - - - Mass Aftersun 2.9 4.6 25.3 Mass Adult Sun Care 5.1 6.6 37.5 - Mass Skin Care Sets/Kits 8.3 7.2 41.8 - Mass Hand Care 4.3 5.0 27.8 - Mass Facial Care 5.7 6.9 39.5 - Mass Body Care 6.6 6.1 34.6 Mass Skin Care 5.9 6.8 39.0 Mass Hair Care 2.3 3.3 17.8 - Mass Fragrance Sets/Kits 3.5 4.0 21.7 - Mass Unisex Fragrances - - - - Mass Women's Fragrances 4.8 3.2 17.3 - Mass Men's Fragrances 4.1 3.1 16.3 Mass Fragrances 4.5 3.2 17.0 Mass Deodorants 3.5 4.8 26.7
  129. B E A U T Y A N D P

    E R S O N A L C A R E I N V I E T N A M P a s s p o r t 122 © E u r o m o n i t o r I n t e r n a t i o n a l - Mass Colour Cosmetics Sets/Kits 4.6 5.2 29.1 - Mass Nail Products 5.2 4.4 24.3 - Mass Lip Products 5.1 6.4 36.6 - Mass Facial Make-Up 7.0 7.9 46.2 - Mass Eye Make-Up 4.7 5.8 32.4 Mass Colour Cosmetics 5.9 6.9 39.3 Mass Bath and Shower 5.0 4.9 26.8 Mass Baby and Child-specific Products 4.1 5.7 32.0 Mass Beauty and Personal Care 4.2 5.1 28.0 Source: Euromonitor International from trade associations, trade press, company research, trade interviews, trade sources Note: Mass beauty and personal care sales are additionally included within baby and child-specific products, bath and shower, colour cosmetics, deodorants, fragrances, hair care, skin care and sun care.