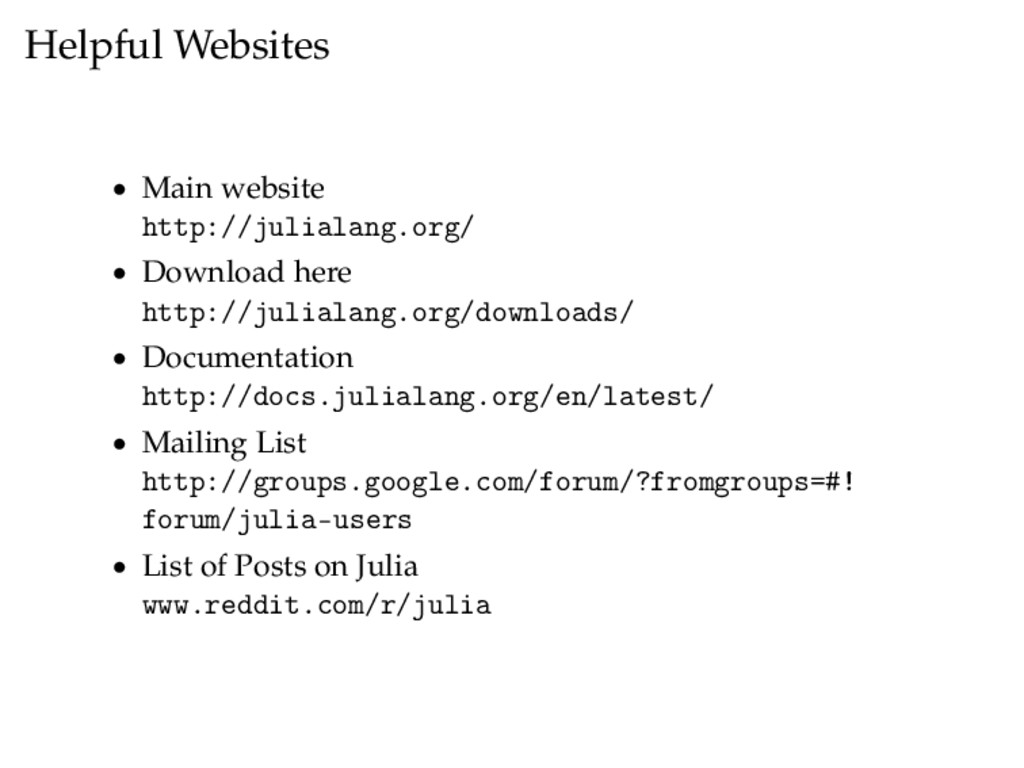
• Documentation http://docs.julialang.org/en/latest/ • Mailing List http://groups.google.com/forum/?fromgroups=#! forum/julia-users • List of Posts on Julia www.reddit.com/r/julia
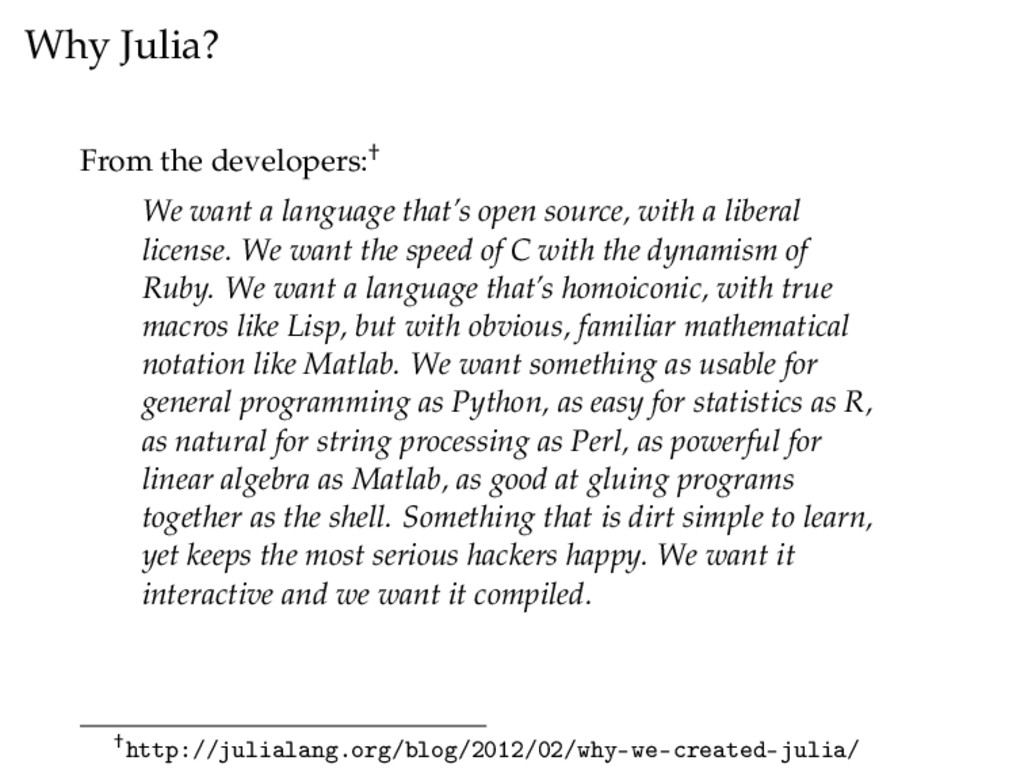
open source, with a liberal license. We want the speed of C with the dynamism of Ruby. We want a language that’s homoiconic, with true macros like Lisp, but with obvious, familiar mathematical notation like Matlab. We want something as usable for general programming as Python, as easy for statistics as R, as natural for string processing as Perl, as powerful for linear algebra as Matlab, as good at gluing programs together as the shell. Something that is dirt simple to learn, yet keeps the most serious hackers happy. We want it interactive and we want it compiled. †http://julialang.org/blog/2012/02/why-we-created-julia/
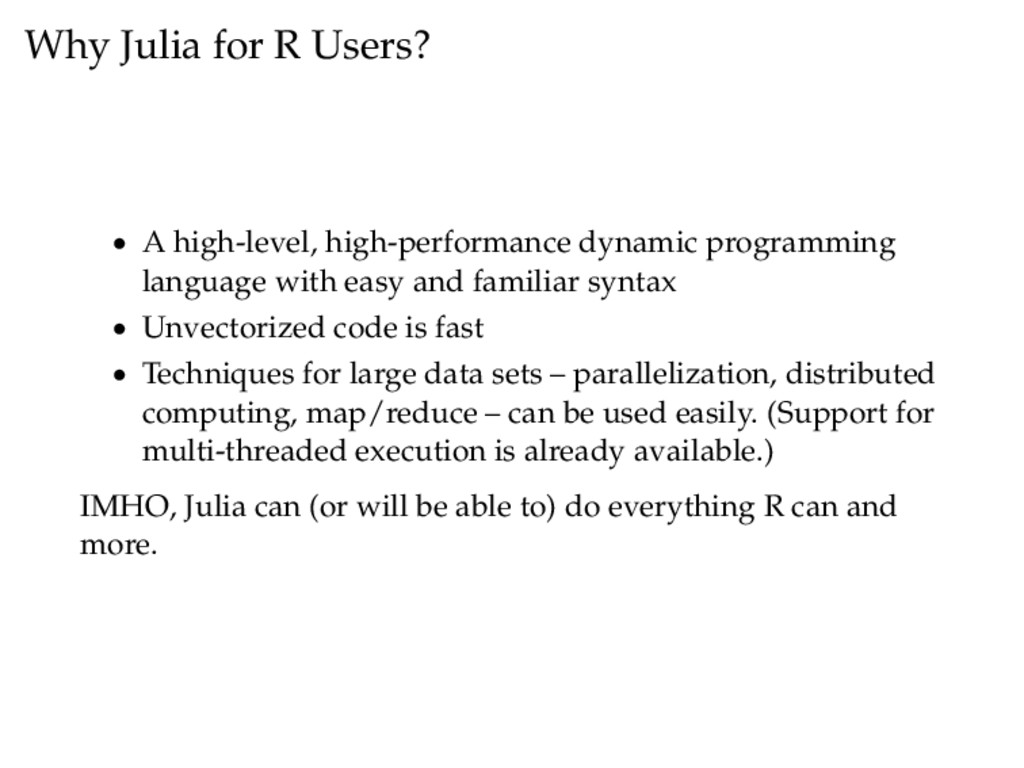
programming language with easy and familiar syntax • Unvectorized code is fast • Techniques for large data sets – parallelization, distributed computing, map/reduce – can be used easily. (Support for multi-threaded execution is already available.) IMHO, Julia can (or will be able to) do everything R can and more.
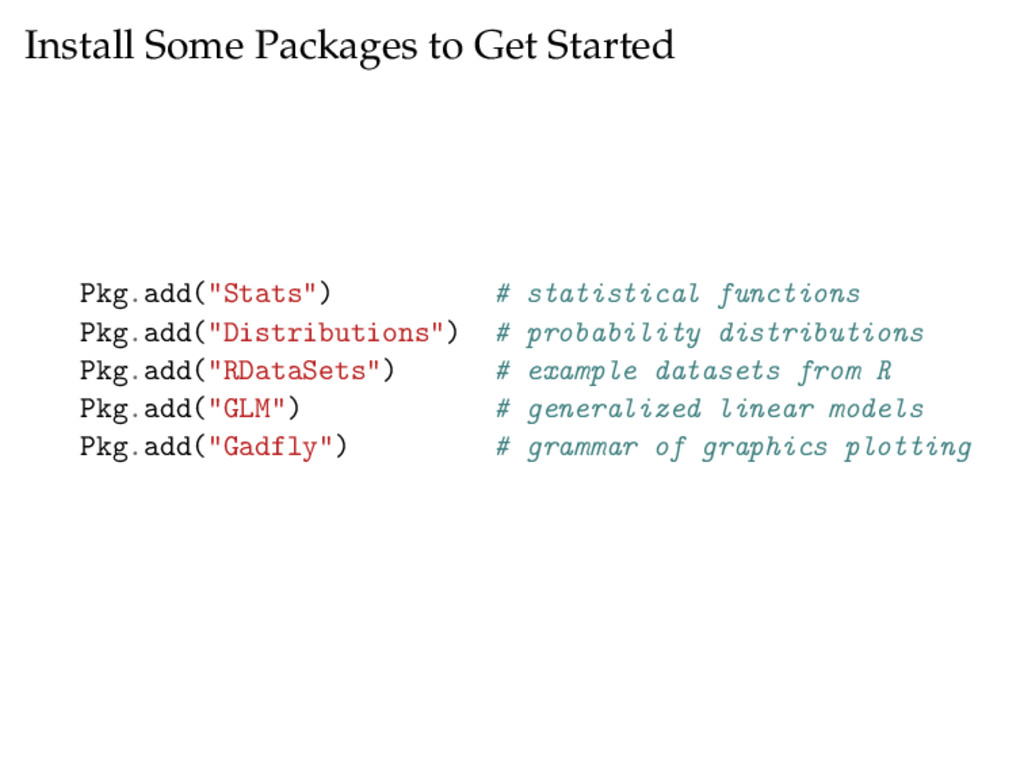
Pkg.add("Distributions") # probability distributions Pkg.add("RDataSets") # example datasets from R Pkg.add("GLM") # generalized linear models Pkg.add("Gadfly") # grammar of graphics plotting
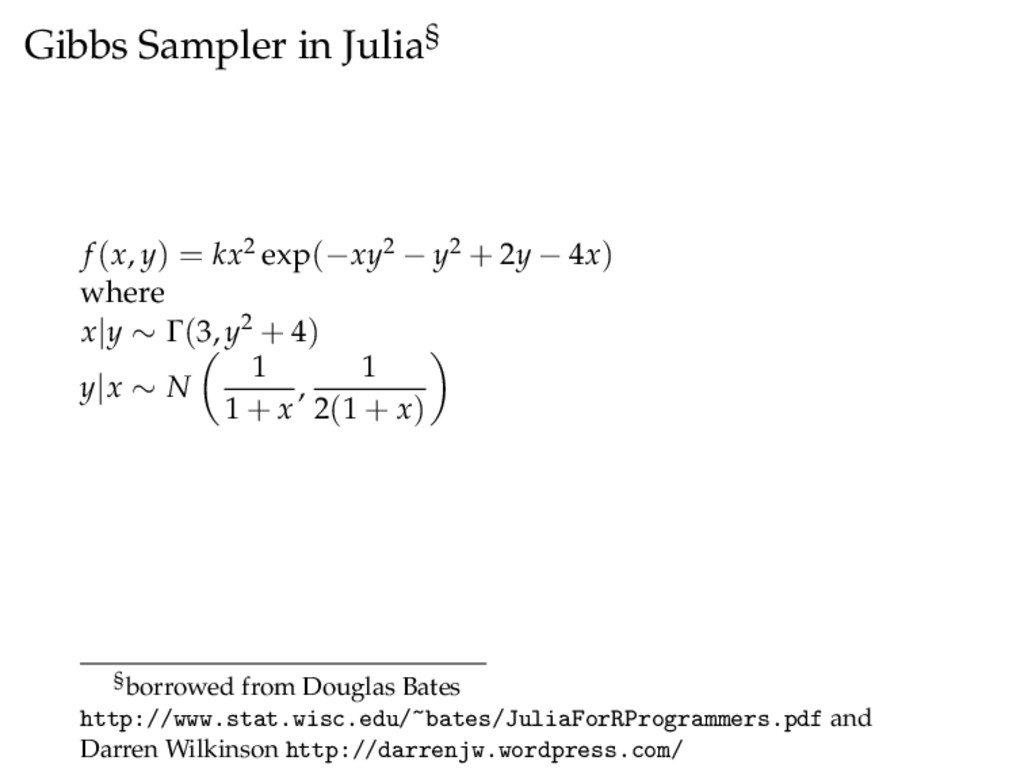
− y2 + 2y − 4x) where x|y ∼ Γ(3, y2 + 4) y|x ∼ N 1 1 + x , 1 2(1 + x) §borrowed from Douglas Bates http://www.stat.wisc.edu/~bates/JuliaForRProgrammers.pdf and Darren Wilkinson http://darrenjw.wordpress.com/
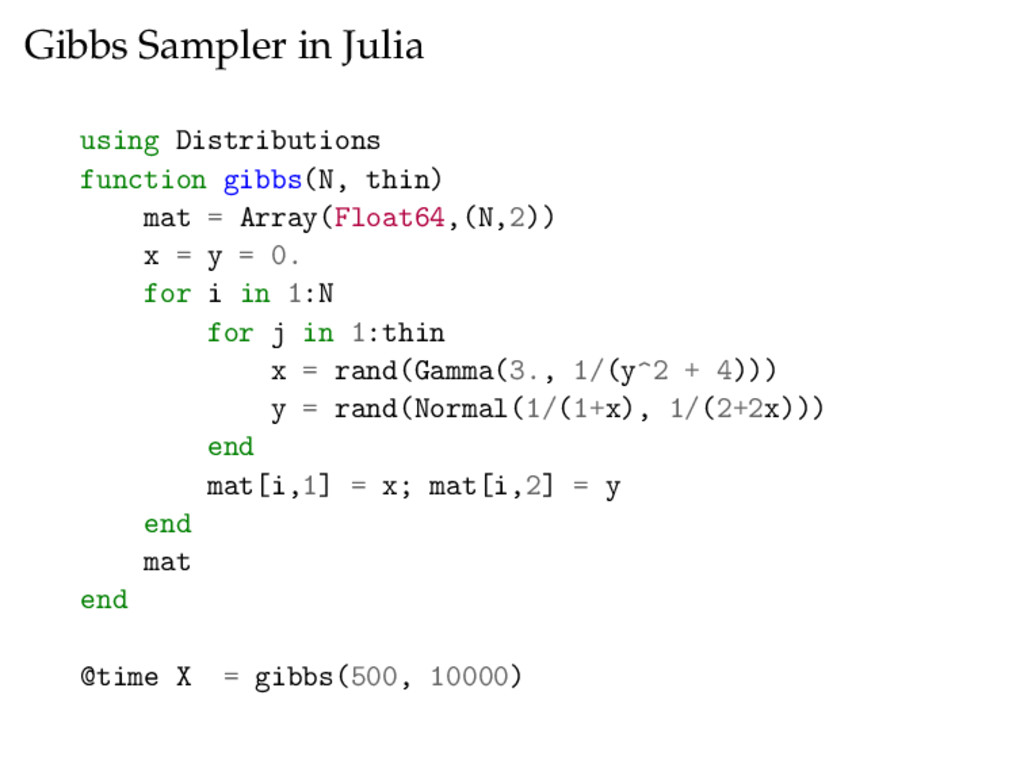
= Array(Float64,(N,2)) x = y = 0. for i in 1:N for j in 1:thin x = rand(Gamma(3., 1/(y^2 + 4))) y = rand(Normal(1/(1+x), 1/(2+2x))) end mat[i,1] = x; mat[i,2] = y end mat end @time X = gibbs(500, 10000)
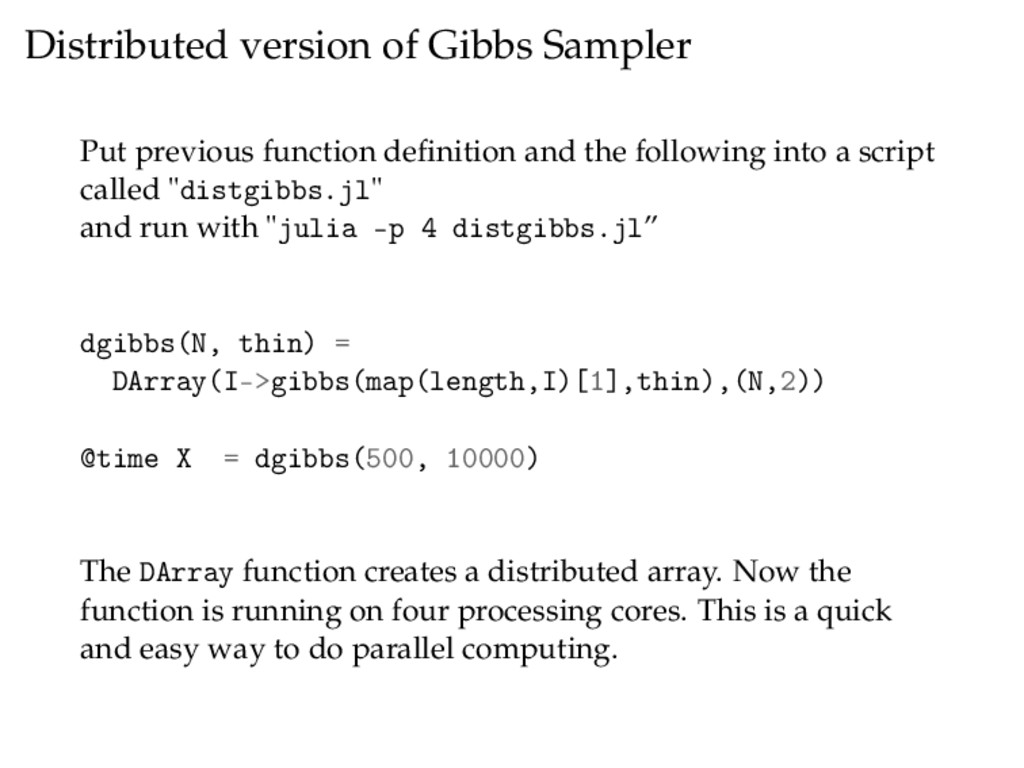
the following into a script called "distgibbs.jl" and run with "julia -p 4 distgibbs.jl” dgibbs(N, thin) = DArray(I->gibbs(map(length,I)[1],thin),(N,2)) @time X = dgibbs(500, 10000) The DArray function creates a distributed array. Now the function is running on four processing cores. This is a quick and easy way to do parallel computing.
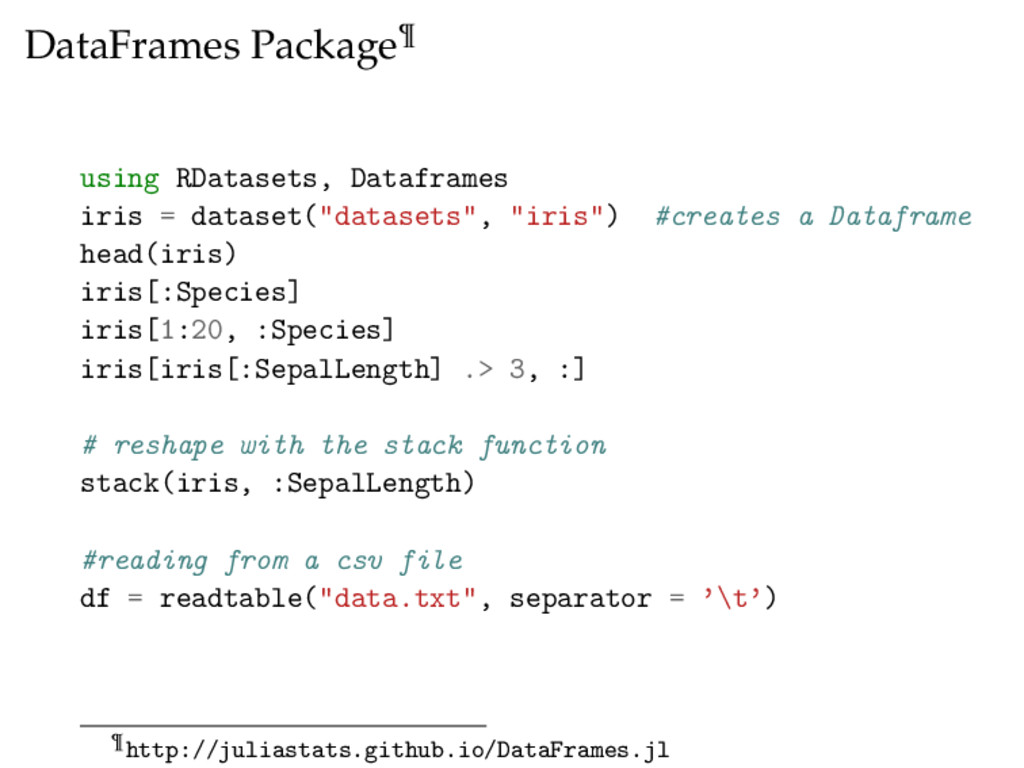
a Dataframe head(iris) iris[:Species] iris[1:20, :Species] iris[iris[:SepalLength] .> 3, :] # reshape with the stack function stack(iris, :SepalLength) #reading from a csv file df = readtable("data.txt", separator = ’\t’) ¶http://juliastats.github.io/DataFrames.jl
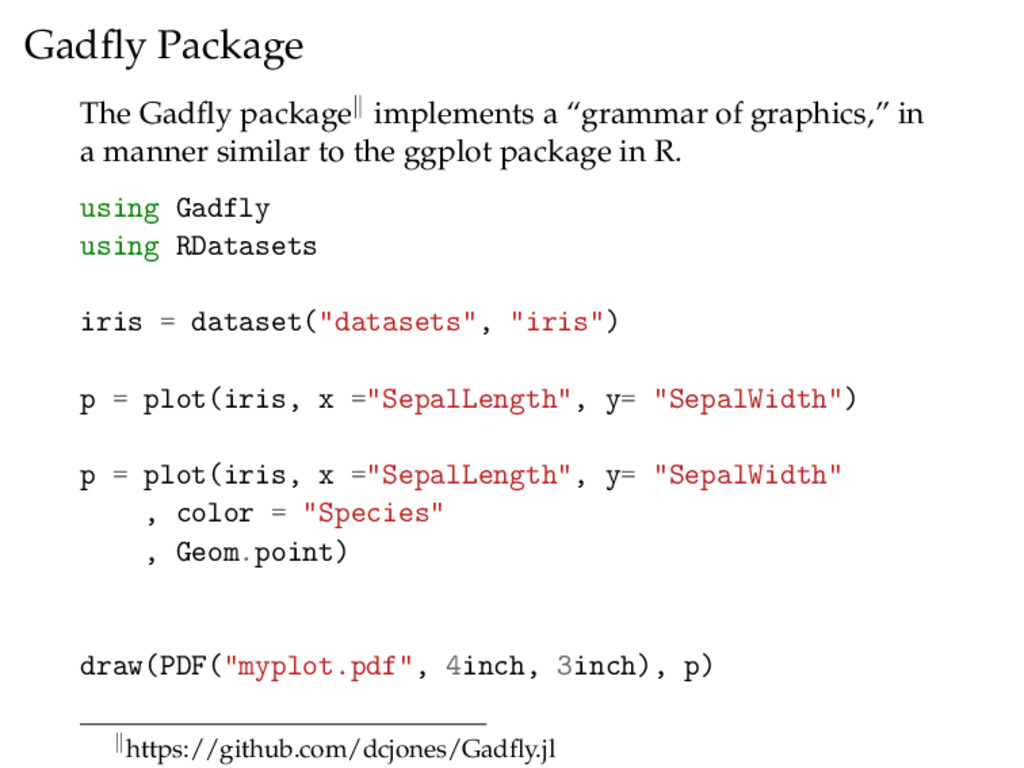
in a manner similar to the ggplot package in R. using Gadfly using RDatasets iris = dataset("datasets", "iris") p = plot(iris, x ="SepalLength", y= "SepalWidth") p = plot(iris, x ="SepalLength", y= "SepalWidth" , color = "Species" , Geom.point) draw(PDF("myplot.pdf", 4inch, 3inch), p) https://github.com/dcjones/Gadfly.jl


 neuecc
 utakaha
 a_matsuda
 o0h
 oku053
 gonta
 econanringo
 optim
 kishida
 kasacchiful
 sorah
 morizo_1984
 jakevdp
 iamctodd
 lara
 lfama
 akashhashmi
 geshan
 ryanjones
 marktimemedia
 khoart
 mlcsv
 tammyeverts
 aleyda