scientific problems ◉ Frameworks that helps in solving ◉ Think forward like a data scientists /ˈsīəntəst/ is a person who is studying or has expert knowledge of one or more of the natural or physical sciences. 2
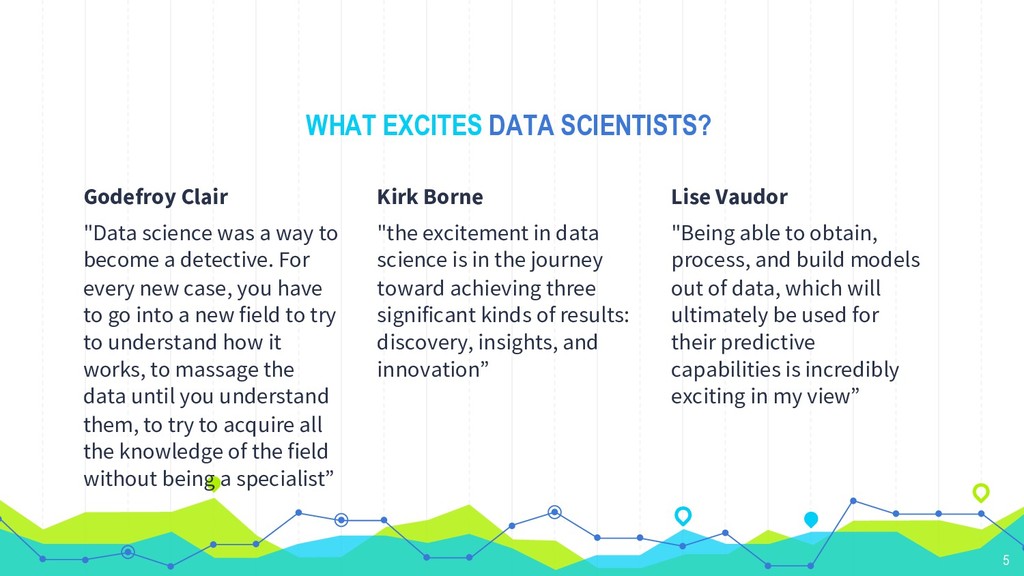
way to become a detective. For every new case, you have to go into a new field to try to understand how it works, to massage the data until you understand them, to try to acquire all the knowledge of the field without being a specialist” Kirk Borne "the excitement in data science is in the journey toward achieving three significant kinds of results: discovery, insights, and innovation” Lise Vaudor "Being able to obtain, process, and build models out of data, which will ultimately be used for their predictive capabilities is incredibly exciting in my view” 5
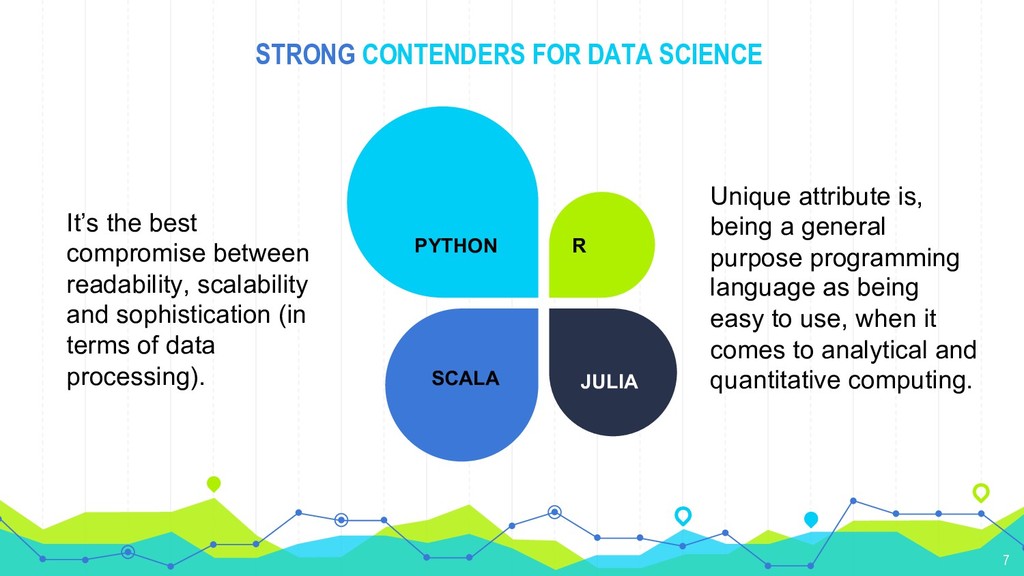
Unique attribute is, being a general purpose programming language as being easy to use, when it comes to analytical and quantitative computing. It’s the best compromise between readability, scalability and sophistication (in terms of data processing).
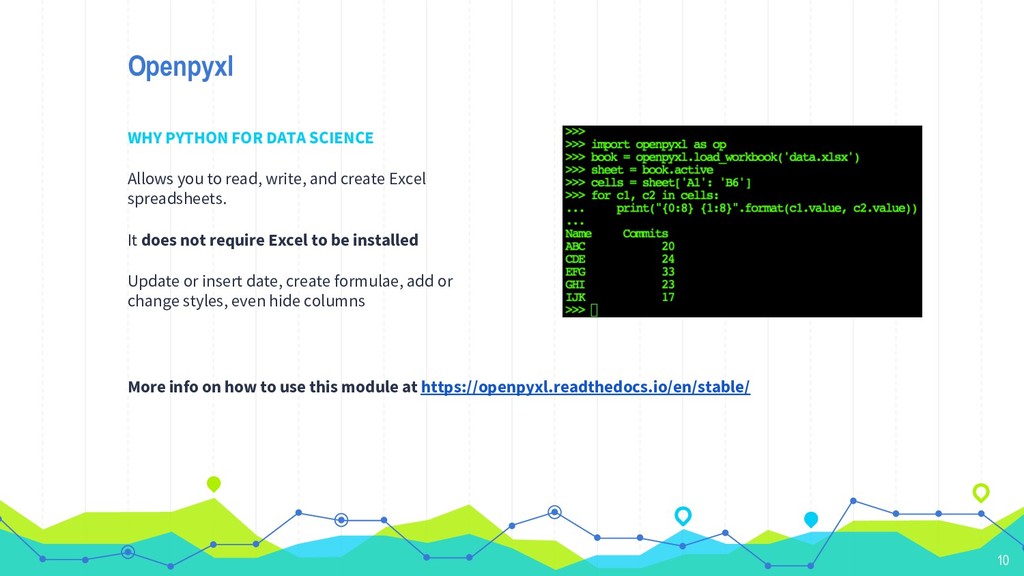
write, and create Excel spreadsheets. It does not require Excel to be installed Update or insert date, create formulae, add or change styles, even hide columns More info on how to use this module at https://openpyxl.readthedocs.io/en/stable/ 10
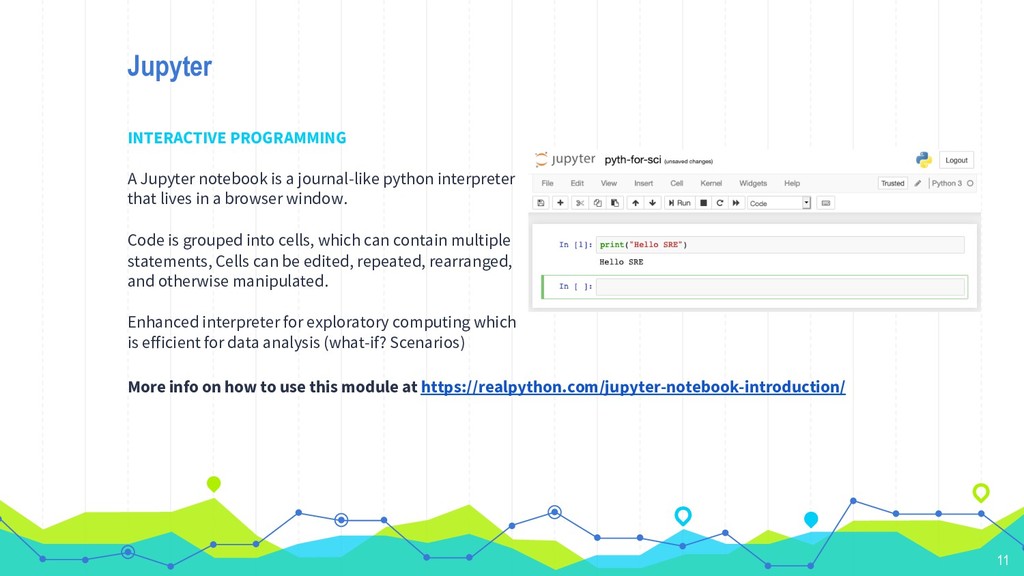
interpreter that lives in a browser window. Code is grouped into cells, which can contain multiple statements, Cells can be edited, repeated, rearranged, and otherwise manipulated. Enhanced interpreter for exploratory computing which is efficient for data analysis (what-if? Scenarios) More info on how to use this module at https://realpython.com/jupyter-notebook-introduction/ 11
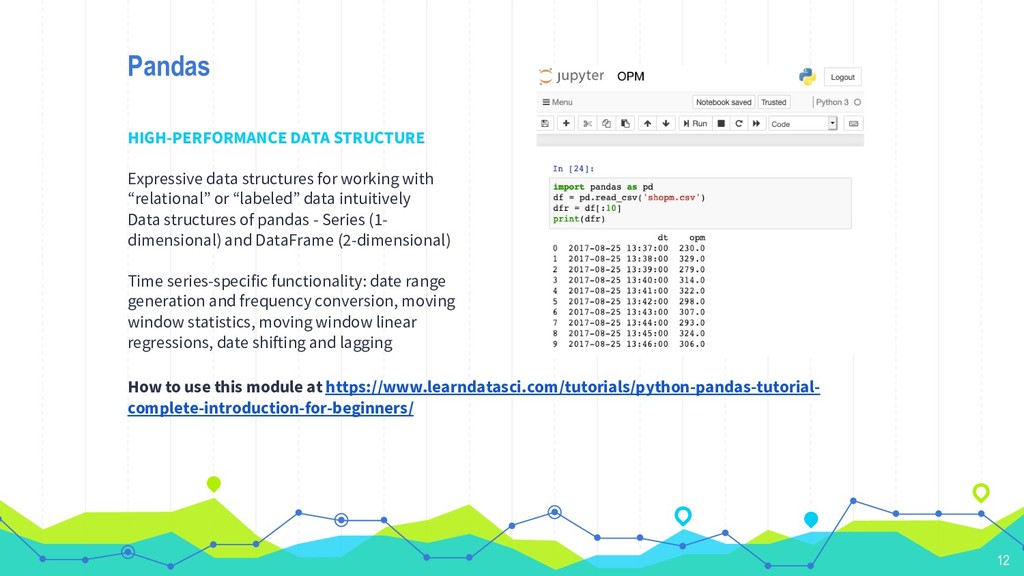
“relational” or “labeled” data intuitively Data structures of pandas - Series (1- dimensional) and DataFrame (2-dimensional) Time series-specific functionality: date range generation and frequency conversion, moving window statistics, moving window linear regressions, date shifting and lagging How to use this module at https://www.learndatasci.com/tutorials/python-pandas-tutorial- complete-introduction-for-beginners/ 12
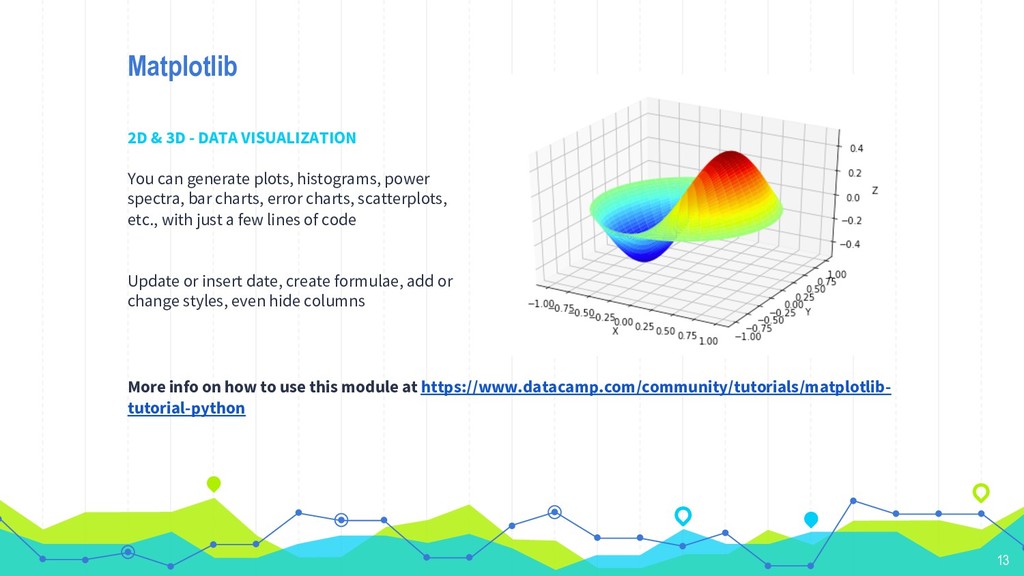
plots, histograms, power spectra, bar charts, error charts, scatterplots, etc., with just a few lines of code Update or insert date, create formulae, add or change styles, even hide columns More info on how to use this module at https://www.datacamp.com/community/tutorials/matplotlib- tutorial-python 13
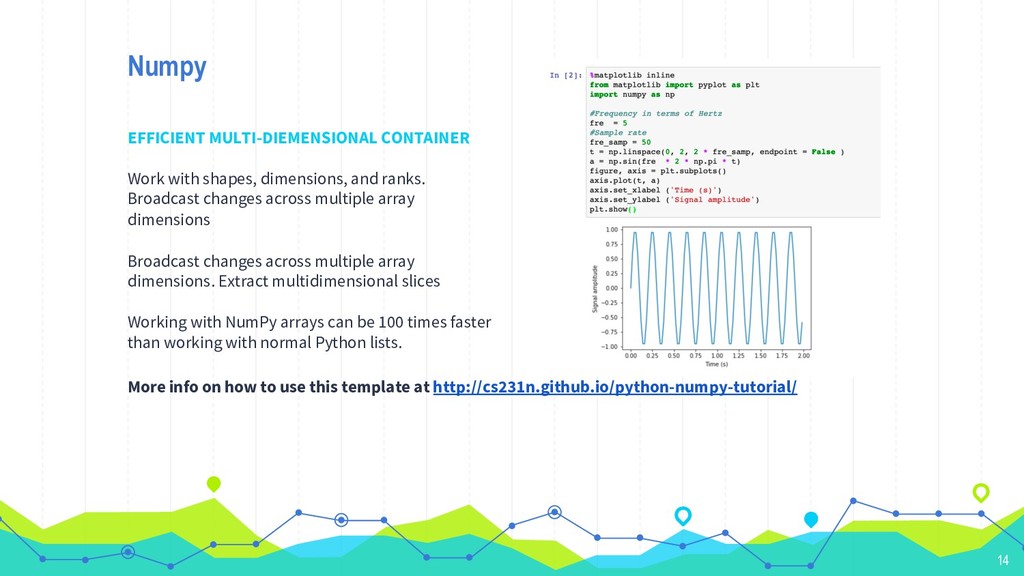
Broadcast changes across multiple array dimensions Broadcast changes across multiple array dimensions. Extract multidimensional slices Working with NumPy arrays can be 100 times faster than working with normal Python lists. More info on how to use this template at http://cs231n.github.io/python-numpy-tutorial/ 14
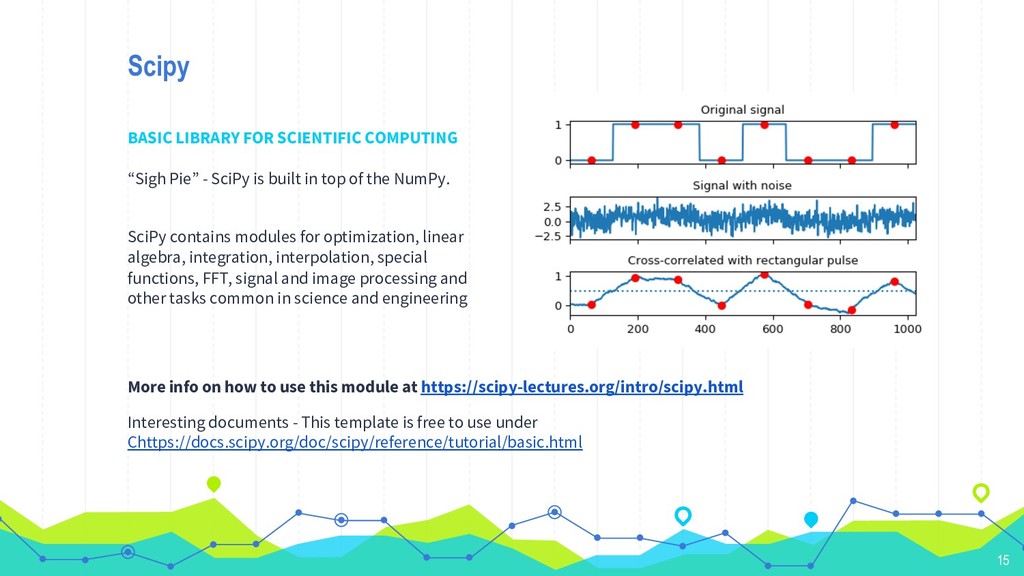
is built in top of the NumPy. SciPy contains modules for optimization, linear algebra, integration, interpolation, special functions, FFT, signal and image processing and other tasks common in science and engineering More info on how to use this module at https://scipy-lectures.org/intro/scipy.html Interesting documents - This template is free to use under Chttps://docs.scipy.org/doc/scipy/reference/tutorial/basic.html 15
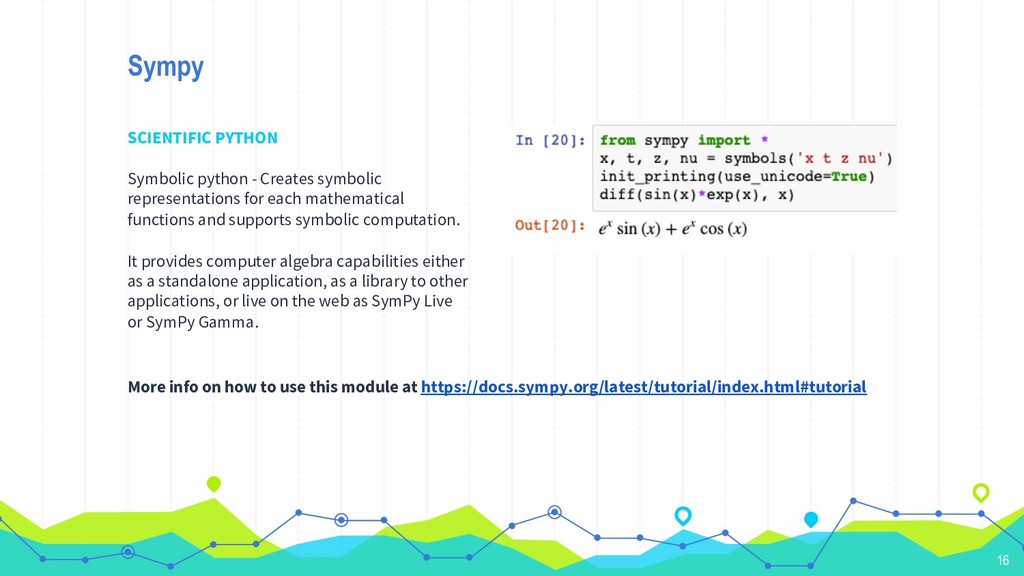
each mathematical functions and supports symbolic computation. It provides computer algebra capabilities either as a standalone application, as a library to other applications, or live on the web as SymPy Live or SymPy Gamma. More info on how to use this module at https://docs.sympy.org/latest/tutorial/index.html#tutorial 16
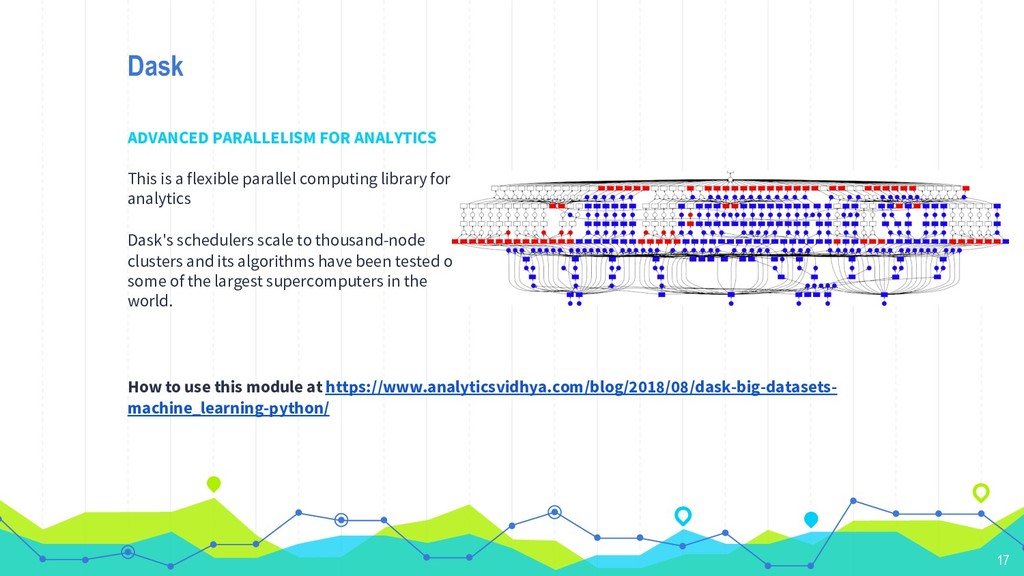
computing library for analytics Dask's schedulers scale to thousand-node clusters and its algorithms have been tested on some of the largest supercomputers in the world. How to use this module at https://www.analyticsvidhya.com/blog/2018/08/dask-big-datasets- machine_learning-python/ 17