Elastic Stack and the X-Pack • Secure your cluster • Leverage realtime alerting capability for daily IT operations 2 "Take full advantage of the Elastic Stack and the X-Pack to maximize your IT operational excellence."
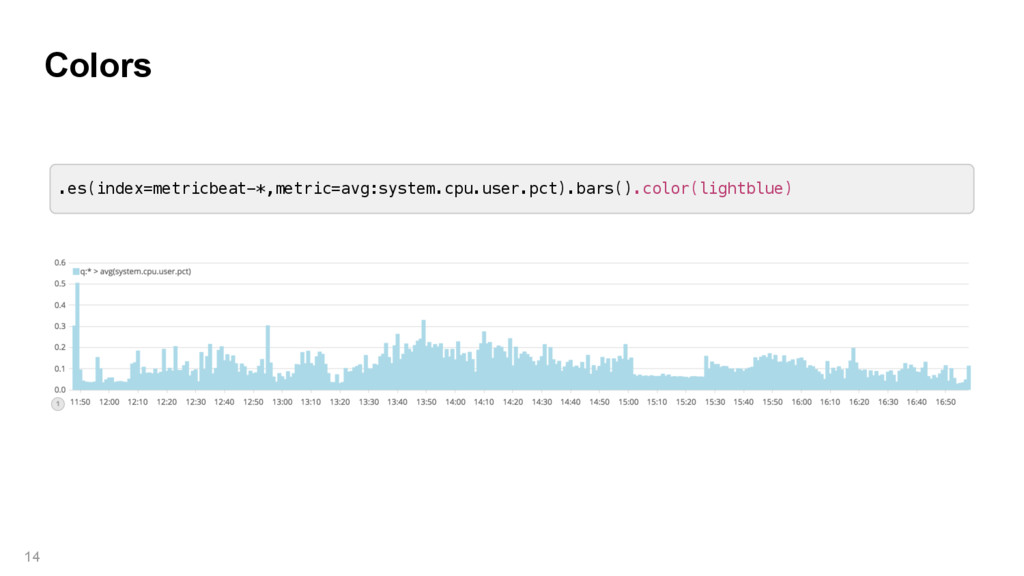
Plot aggregated values (avg, sum, min, max or cardinality) .es(index=metricbeat-*,metric=avg:system.cpu.user.pct).movingaverage(window=3) Moving Average Aggregation .static(1000) Draw statical line
System, Zookeeper Report on Error Enables you to monitor not only the metrics, but also any errors with full message string that occur during metrics monitoring. Retrieve Raw Data Doesn’t do aggregations. All raw data is available on the Elasticsearch host for drilling down into the details, and the data can be reprocessed at any time. Multiple Metrics in One Event Elasticsearch can directly store and query the metrics as a nested JSON document. A lightweight shipper that you can install on your servers to periodically collect metrics from the operating system and services running on the computer.
- cpu … output.elasticsearch: hosts: ["ES_HOST:9200"] protocol: "https" username: "elastic" password: "changeme" Modules $ metricbeat e —c metricbeat.yml Running from the command line
documents and fields. Native, LDAP, AD, PKI and custom realms are supported. Encrypting Communications Enable SSL/TLS against endpoints and cluster-internal communications. IP Filtering Deny/allow access from specific hosts and IP addresses. Auditing Security Events Record security events on index and log file.
the number of access/min is 120% greater than the moving average. Check it every minute. • Slack on #it-sec when the number of login failures/minute per ip is greater than 5. Check it every 5 seconds. • Generate a report from a dashboard as always. Check it 8am on Mondays. 27 Can be described in a natural language as: [Action] when [input] is [condition]. Check it [trigger].
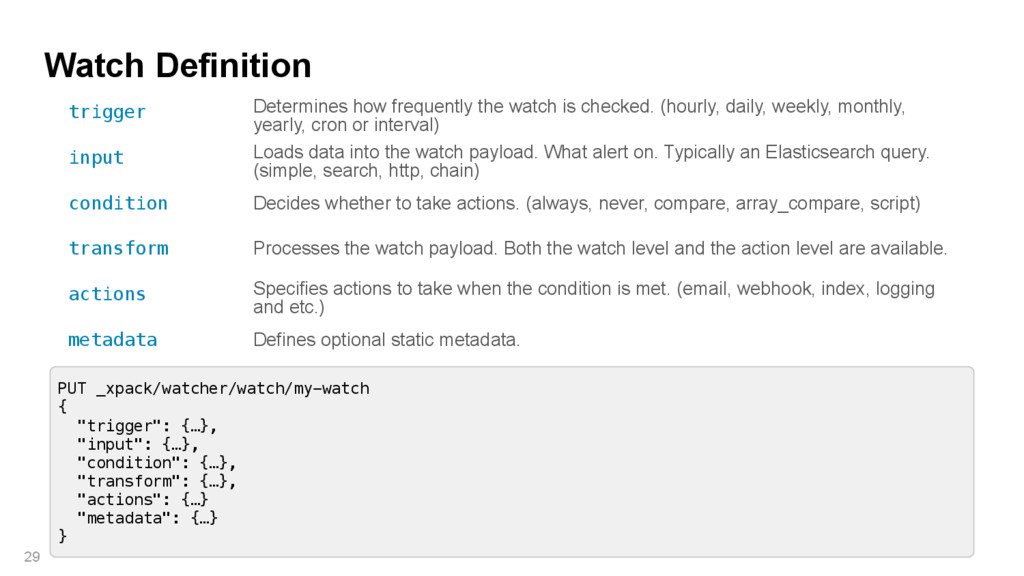
checked. (hourly, daily, weekly, monthly, yearly, cron or interval) input Loads data into the watch payload. What alert on. Typically an Elasticsearch query. (simple, search, http, chain) condition Decides whether to take actions. (always, never, compare, array_compare, script) transform Processes the watch payload. Both the watch level and the action level are available. actions Specifies actions to take when the condition is met. (email, webhook, index, logging and etc.) metadata Defines optional static metadata. PUT _xpack/watcher/watch/my-watch { "trigger": {…}, "input": {…}, "condition": {…}, "transform": {…}, "actions": {…} "metadata": {…} }
watch that was triggered. trigger_event How the watch was triggered (manual or schedule) and the watch’s scheduled time and actual trigger time. input The input type (http, search, or simple) and definition. condition The condition type (always, never, or script) and definition. state The state of the watch execution (execution_not_needed, executed, throttled). result The results of each phase of the watch execution. Shows the input payload, condition status, transform status (if defined), and actions status
is currently executing. ctx.execution_time The time execution of this watch started. ctx.trigger.triggered_time The time this watch was triggered. ctx.trigger.scheduled_time The time this watch was supposed to be triggered. ctx.metadata.* Any metadata associated with the watch. ctx.payload.* The payload data loaded by the watch’s input.
of documents of being hit. ctx.payload.hits.hits.0 The first document of the hits. ctx.payload.hits.hits.<index>.fields.<fieldname> A field value of a particular hit. ctx.payload.aggregations.<agg_name>.buckets.<buck et_num>.<agg_name>.value An aggregated value of a specific bucket.
: { "gte" : 5 } } } { "condition": { "always": {} } } { "condition": { "never": {} } } "always" forces the watch actions to be executed unless they are throttled. Never execute actions. Frequently used for comparing the value in the watch payload with a threshold. Available operators: eq, not_eq, gt, gte, lt and lte.
Notification", "body":"{{ctx.payload.hits.total}} error logs found", "attachments":{ "dashboard.pdf":{ "reporting":{ "url":"http://example.org:5601/api/reporting/generate/dashboard/Error-Monitoring" } } } } } } } The subject and the body can contain static text and the watch context as Mustache templates. http, data and reporting type attachments are supported.
: { "index" : { "index" : "my-index", "doc_type" : "my-type" , "execution_time_field": "@timestamp" } } Index ctx.payload into an Elasticsearch index as a single document.
: { "throttle_period": "15m", "email" : { … "throttle_period" : "15m", "actions" : { "email_administrator" : { "email" : { … "notify_pager" : { The watch level and action level throttling is available. The action will not be taken while throttled (default 5 sec).
"condition":{ "script":{ "lang":"painless", "inline":"return ctx.payload.aggregations.agg_day.buckets.29.agg_bytes.value > ctx.payload.aggregations.agg_day.buckets.29.agg_moving_avg.value * params.gap", "params":{ "gap":1.2 } } } } Strategy: Run moving_avg aggregation upon the target index. Compare the value on the last bucket with the actual value. This example runs upon 30 days with "interval": "day" setting thus, the 30 buckets will be returned.
"field":"session_id.keyword" }, "aggs":{ "agg_user":{ "terms":{ "field":"user.keyword" } }, "agg_start":{ "min":{ "field":"@timestamp" } }, "agg_end":{ "max":{"field":"@timestamp" } }, "agg_duration":{ "bucket_script":{ "buckets_path":{ "min":"agg_start", "max":"agg_end" }, "script":{ "lang":"painless", "inline":"return params.max - params.min" } } } Strategy: Run terms aggregation upon a field which specifies a time series event and calculate max - min timestamp.
the Elastic Cloud as the Email action is taken. So use of own SMTP server is not possible. • The default throttle period is not configurable. Specify a throttle period per watch/action, however.