Upgrade to Pro — share decks privately, control downloads, hide ads and more …

「Yahoo!検索」におけるWebパフォーマンス改善の取り組み / Efforts to Im...

「Yahoo!検索」におけるWebパフォーマンス改善の取り組み / Efforts to Improve Web Performance in "Yahoo! JAPAN Search"

Yahoo!検索のWebパフォーマンスの可視化の取り組み、および可視化したパフォーマンスを用いた改善の取り組みについてご紹介します。

Transcript

29 slides
  1. Efforts to Improve Performance Using Core Web Vitals in "Yahoo!

    JAPAN Search" LY Corporation Search Company, Search Headquarters, Development Headquarters Hatsue Okudaira
  2. • Yahoo! JAPAN Search • what are Web Vitals •

    3 metrics of Core Web Vitals • how to visualize Core Web Vitals • utilize our services • conclusion Agenda
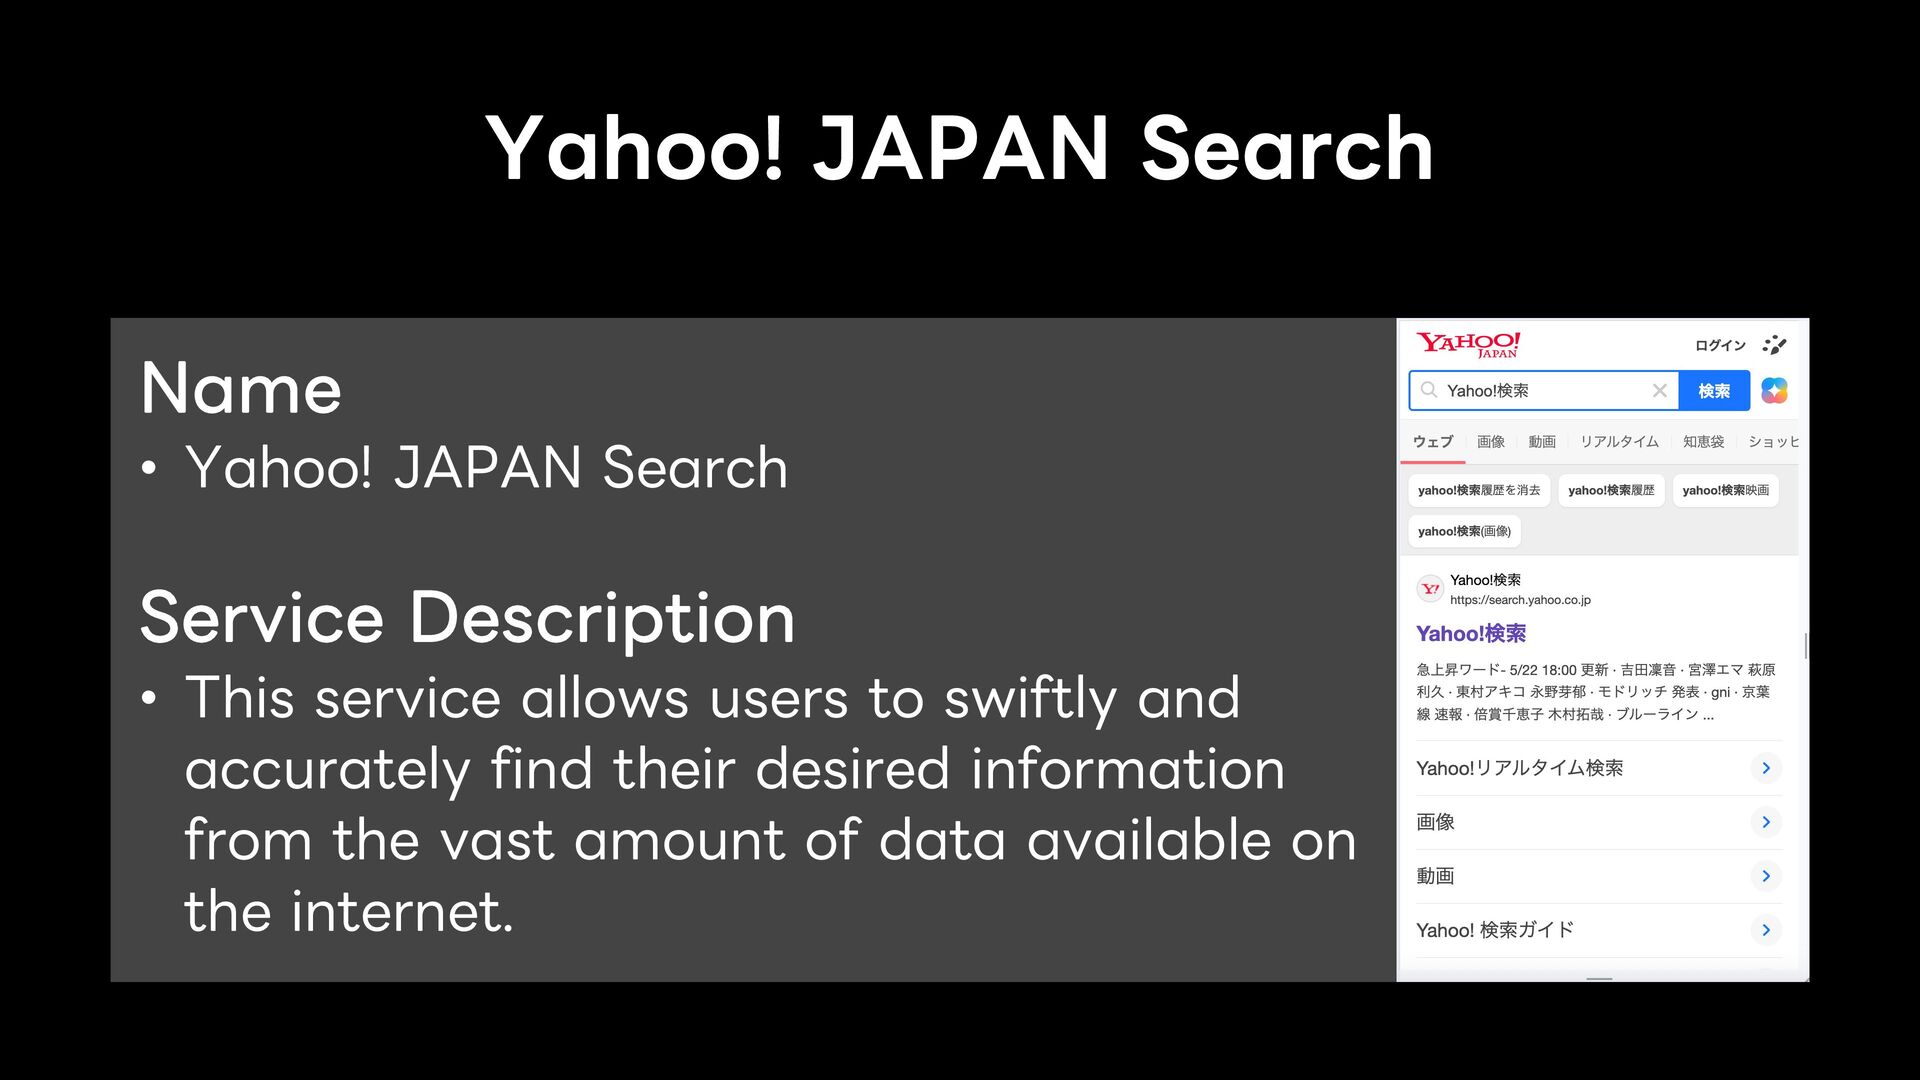
  3. Name • Yahoo! JAPAN Search Service Description • This service

    allows users to swiftly and accurately find their desired information from the vast amount of data available on the internet. Yahoo! JAPAN Search
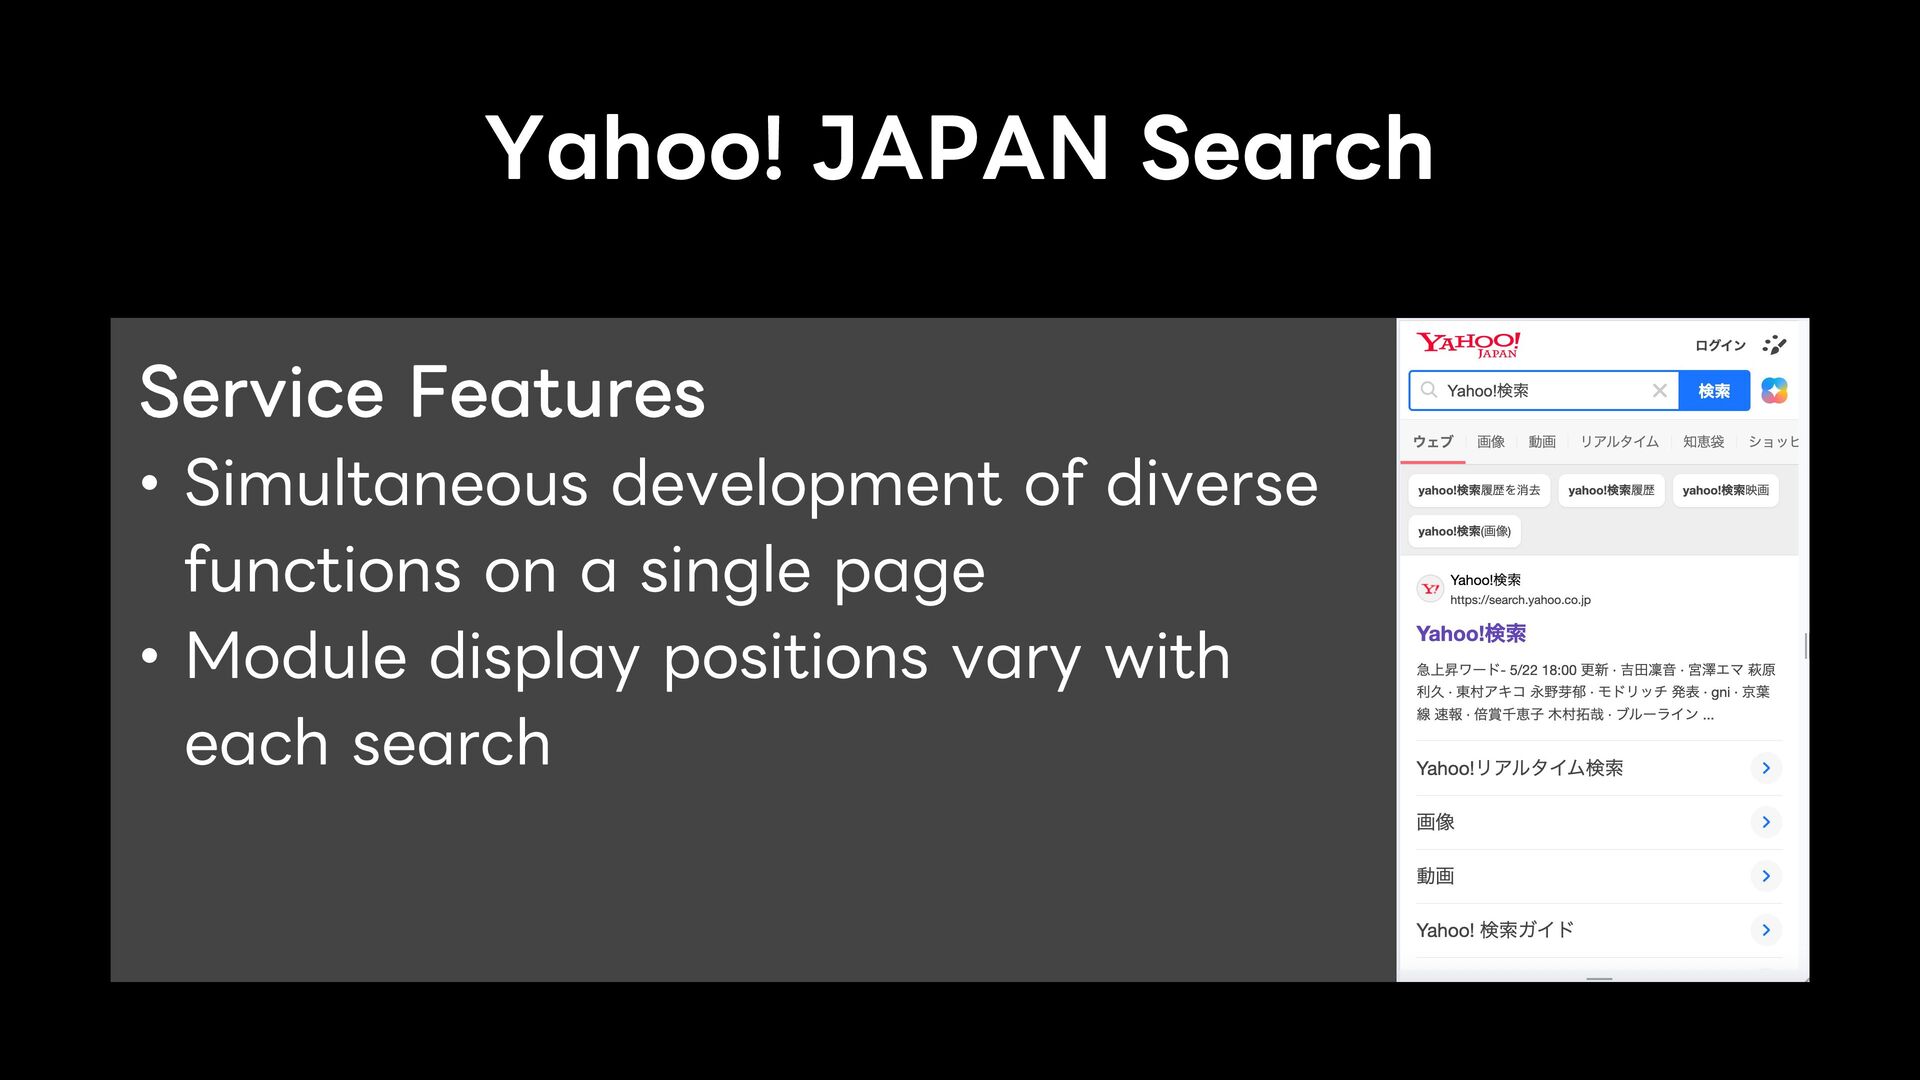
  4. Service Features • Simultaneous development of diverse functions on a

    single page • Module display positions vary with each search Yahoo! JAPAN Search
  5. Google's initiative to provide a unified guideline on quality signals

    considered important for delivering an excellent user experience on the web What are Web Vitals?
  6. • Core Web Vitals are a set of metrics that

    measure real user experience in terms of page loading performance, interactivity, and visual stability. • Improving Core Web Vitals can enhance search rankings and provide an overall better user experience. • Core Web Vitals impact UX and SEO. What are Core Web Vitals?
  7. • Largest Contentful Paint(LCP) • Interaction to Next Paint (INP)

    • Cumulative Layout Shift(CLS) 3 metrics of Core Web Vitals
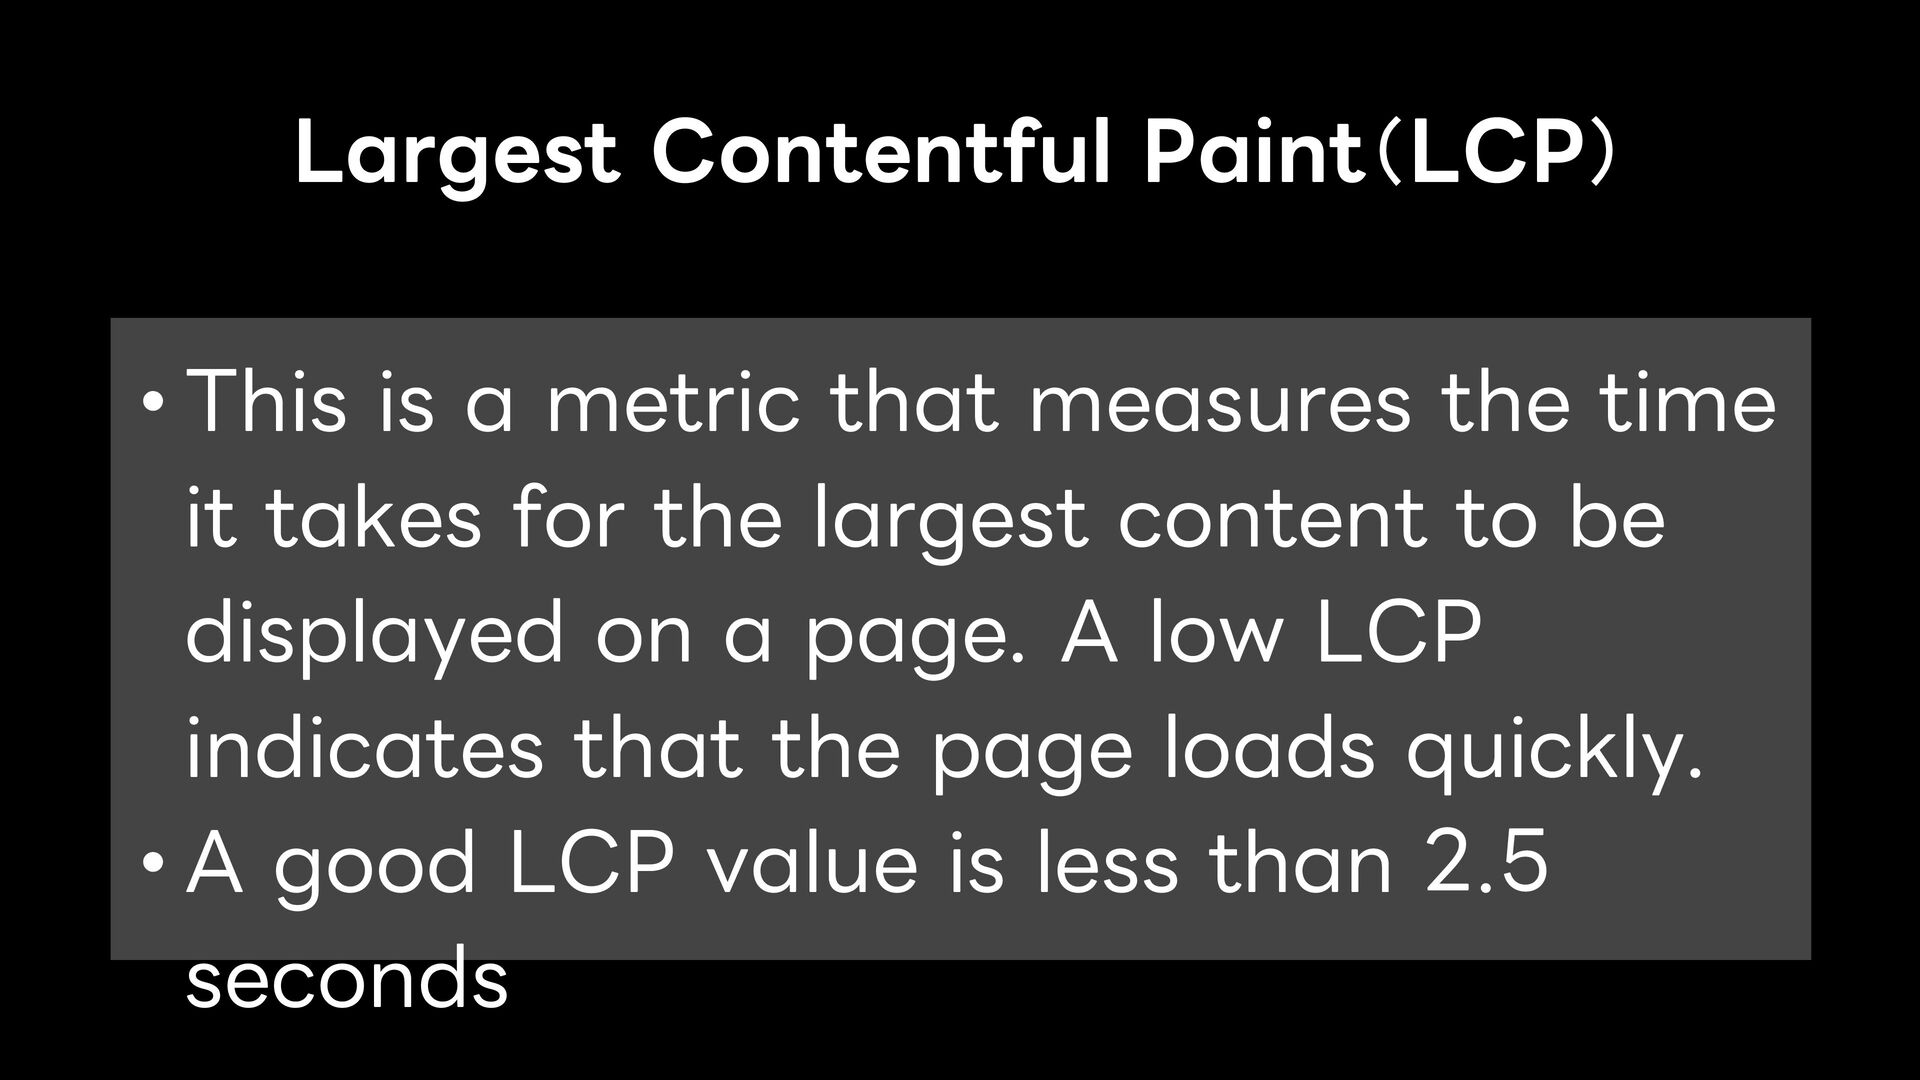
  8. • This is a metric that measures the time it

    takes for the largest content to be displayed on a page. A low LCP indicates that the page loads quickly. • A good LCP value is less than 2.5 seconds. Largest Contentful Paint(LCP)
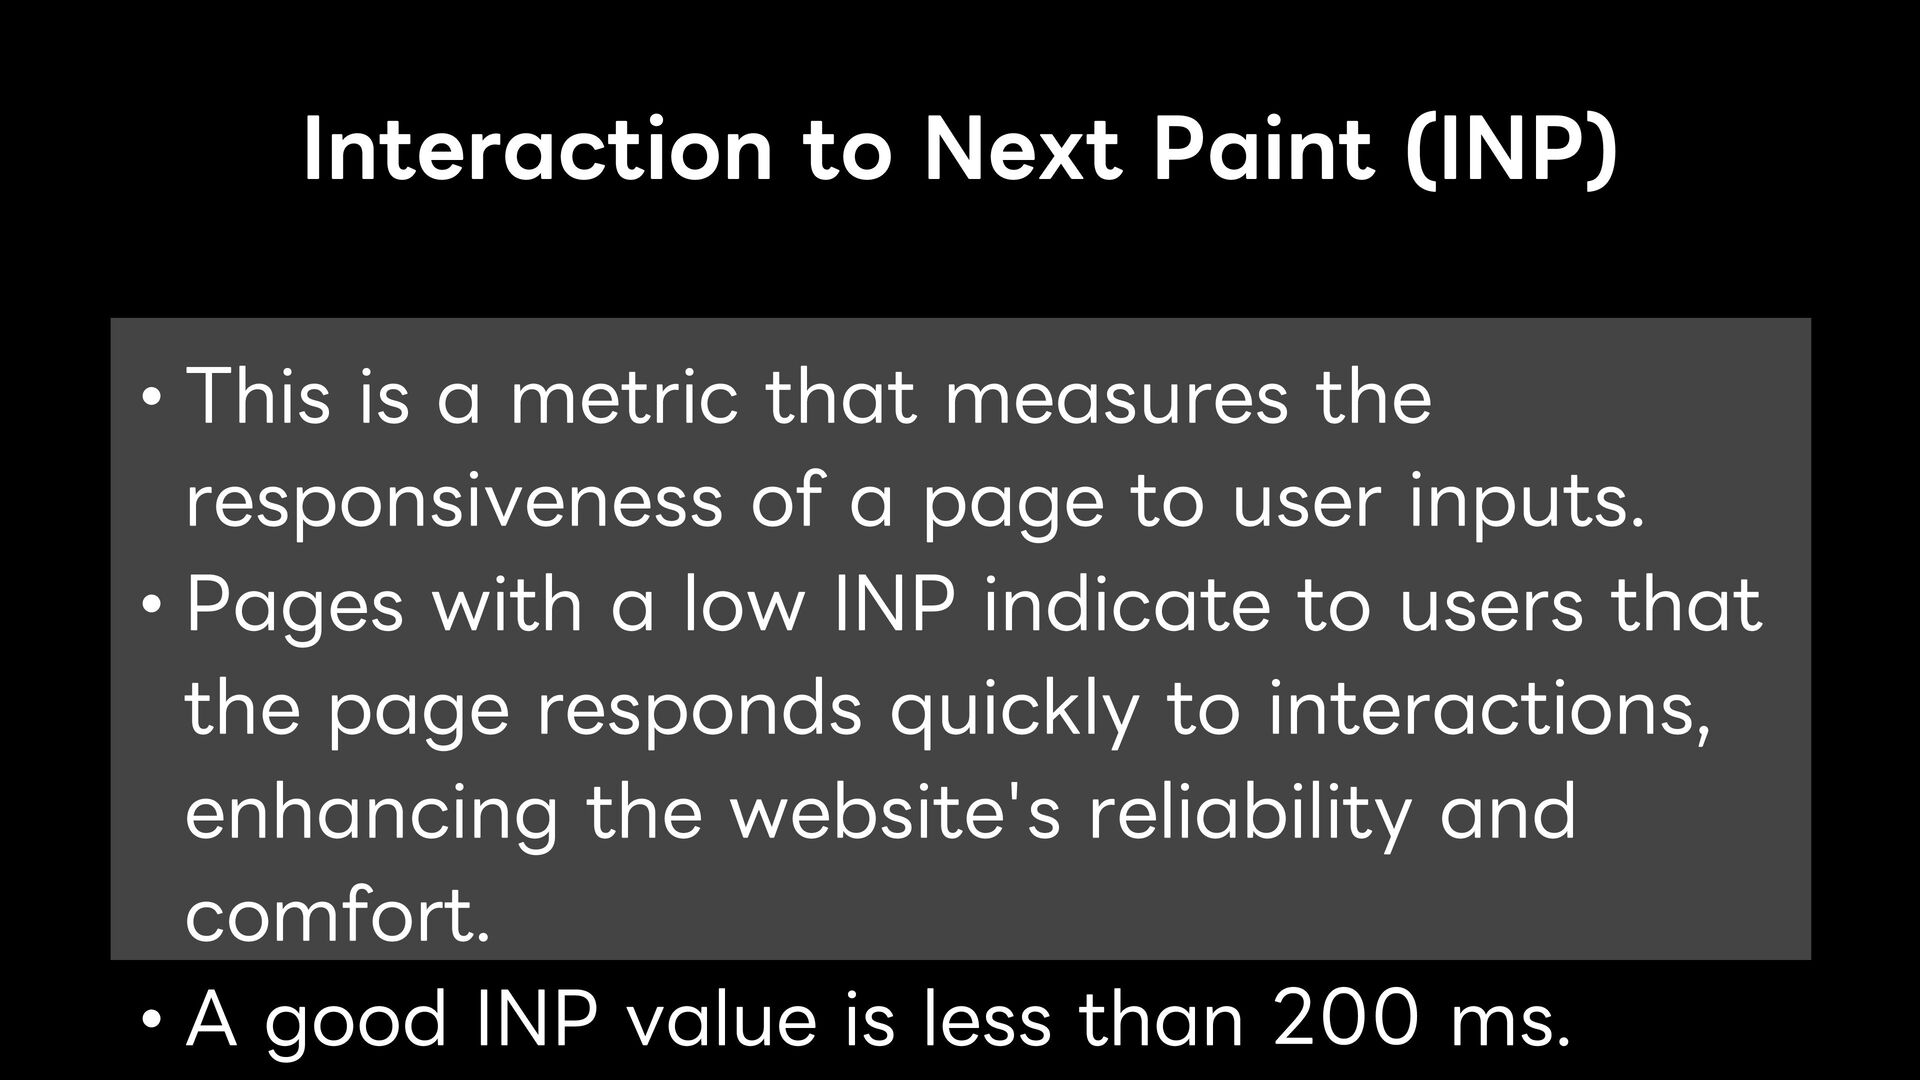
  9. • This is a metric that measures the responsiveness of

    a page to user inputs. • Pages with a low INP indicate to users that the page responds quickly to interactions, enhancing the website's reliability and comfort. • A good INP value is less than 200 ms. Interaction to Next Paint (INP)
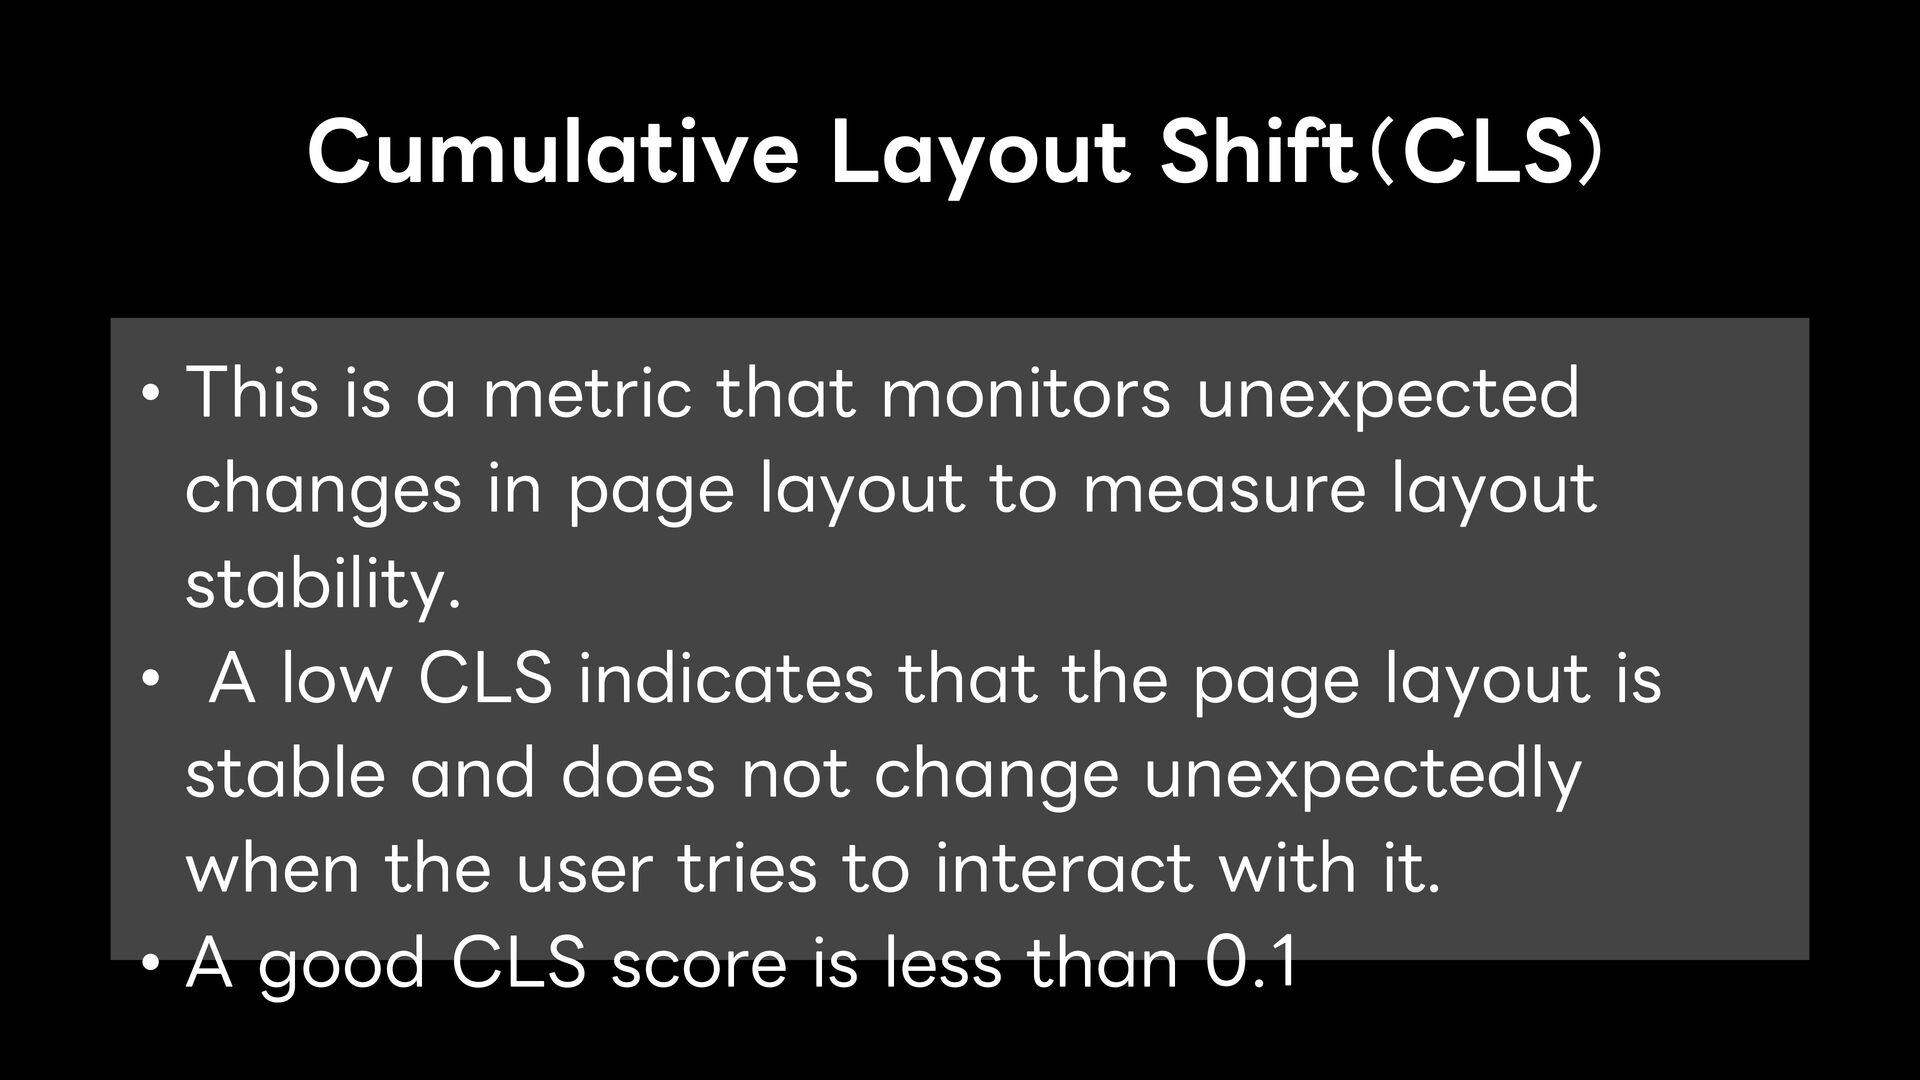
  10. • This is a metric that monitors unexpected changes in

    page layout to measure layout stability. • A low CLS indicates that the page layout is stable and does not change unexpectedly when the user tries to interact with it. • A good CLS score is less than 0.1. Cumulative Layout Shift(CLS)
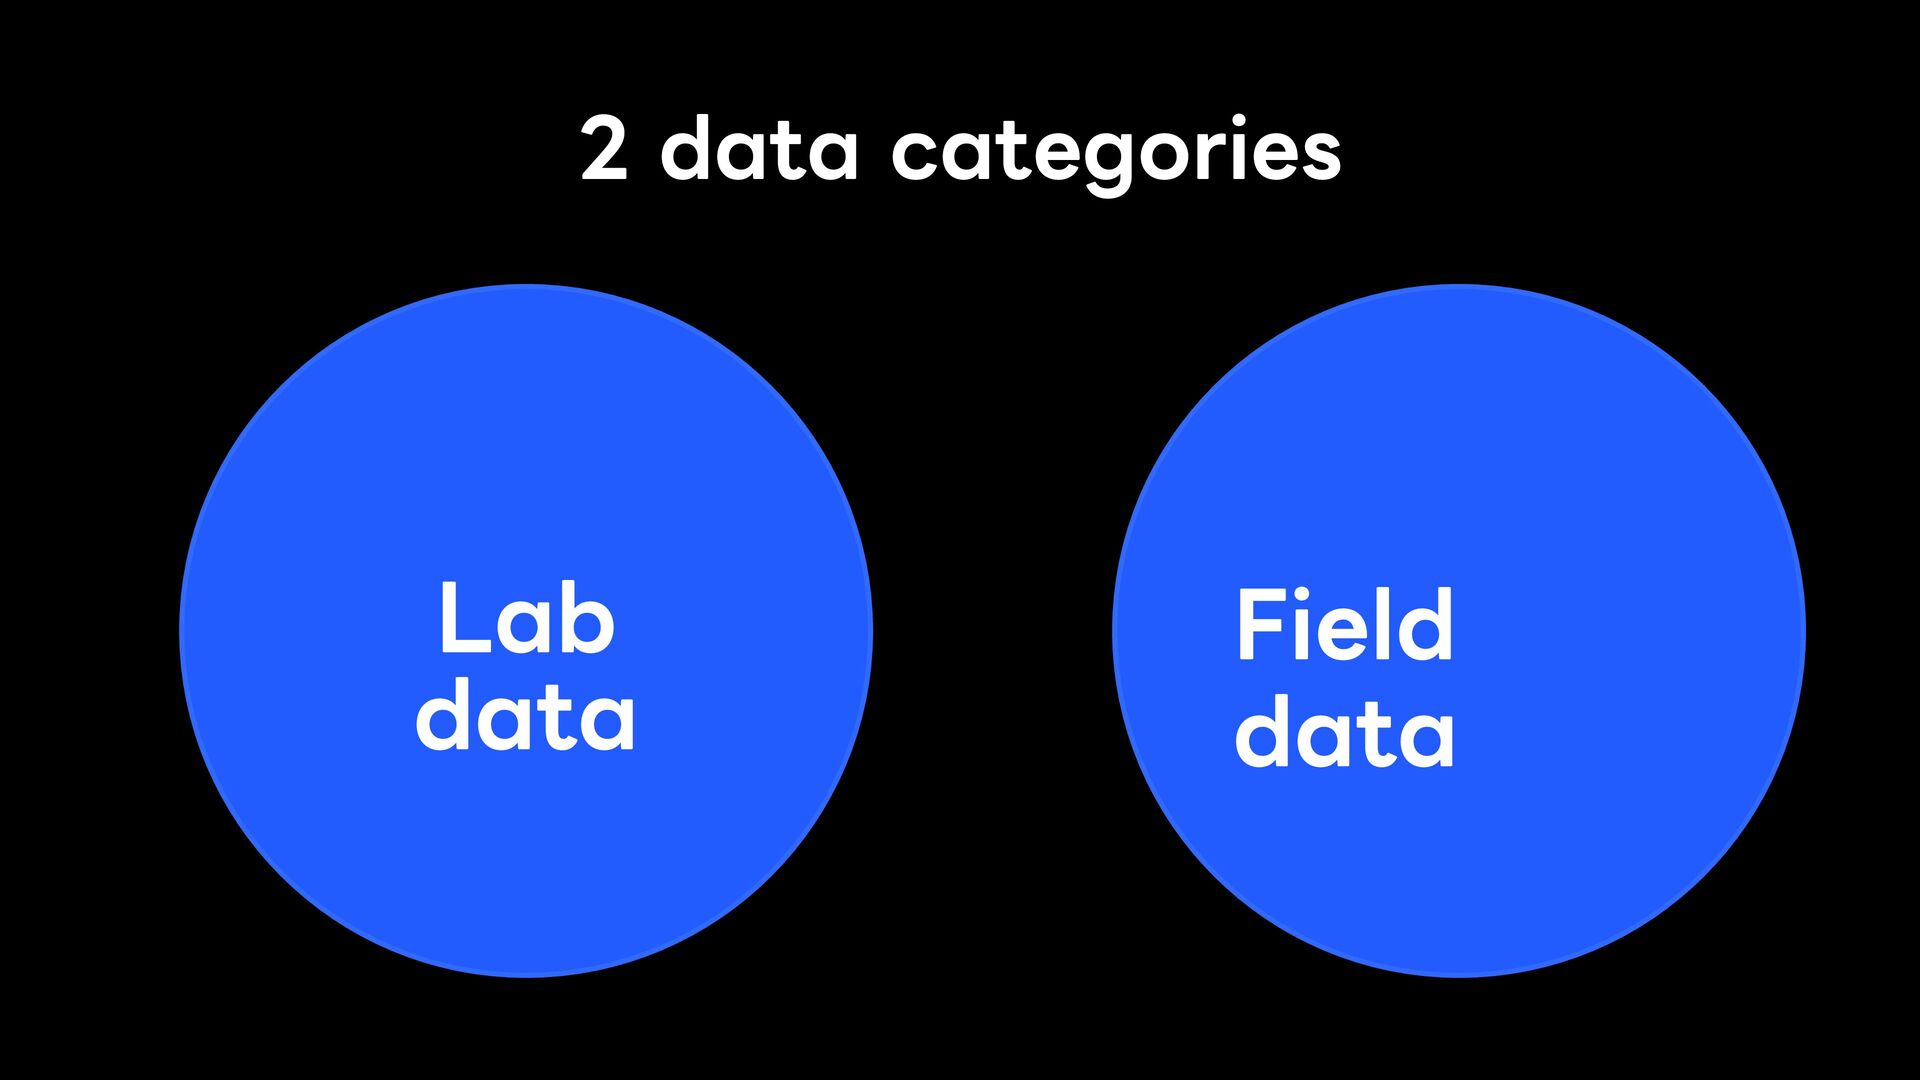
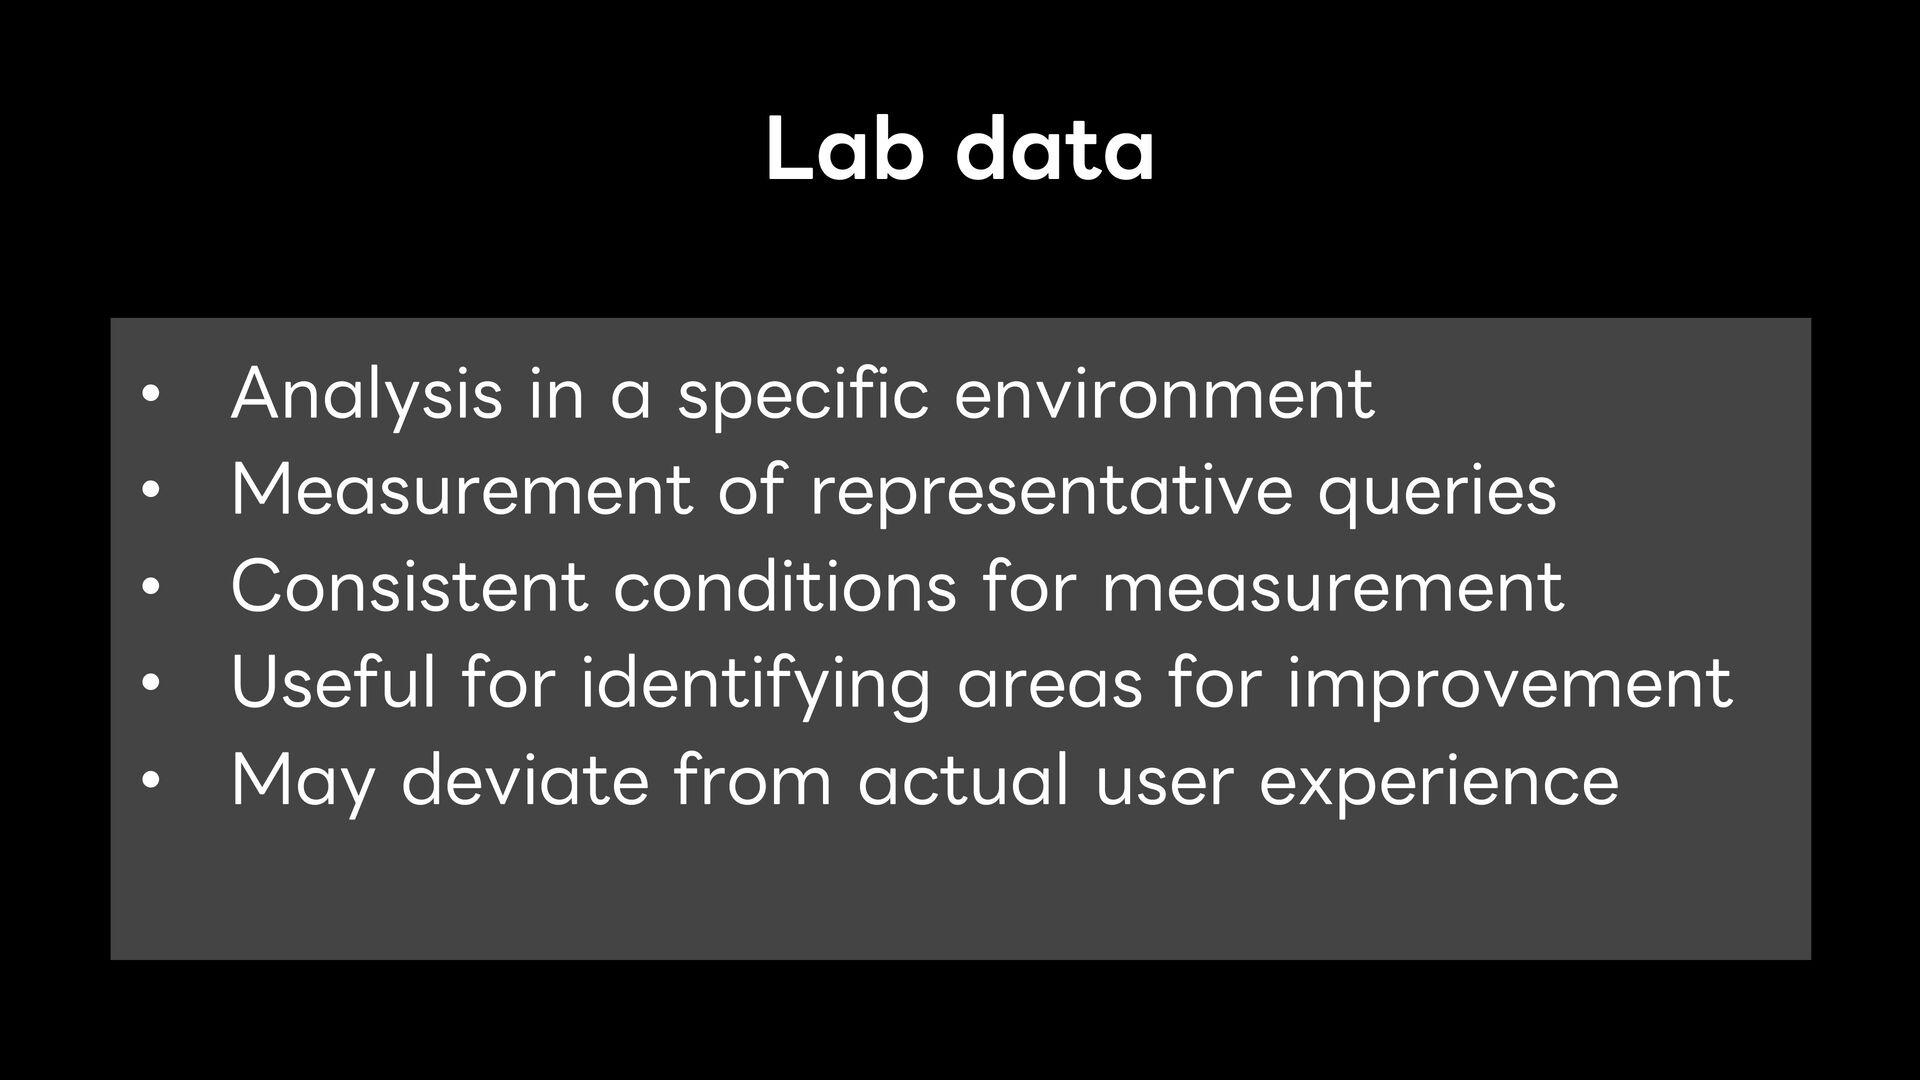
  11. • Analysis in a specific environment • Measurement of representative

    queries • Consistent conditions for measurement • Useful for identifying areas for improvement • May deviate from actual user experience Lab data
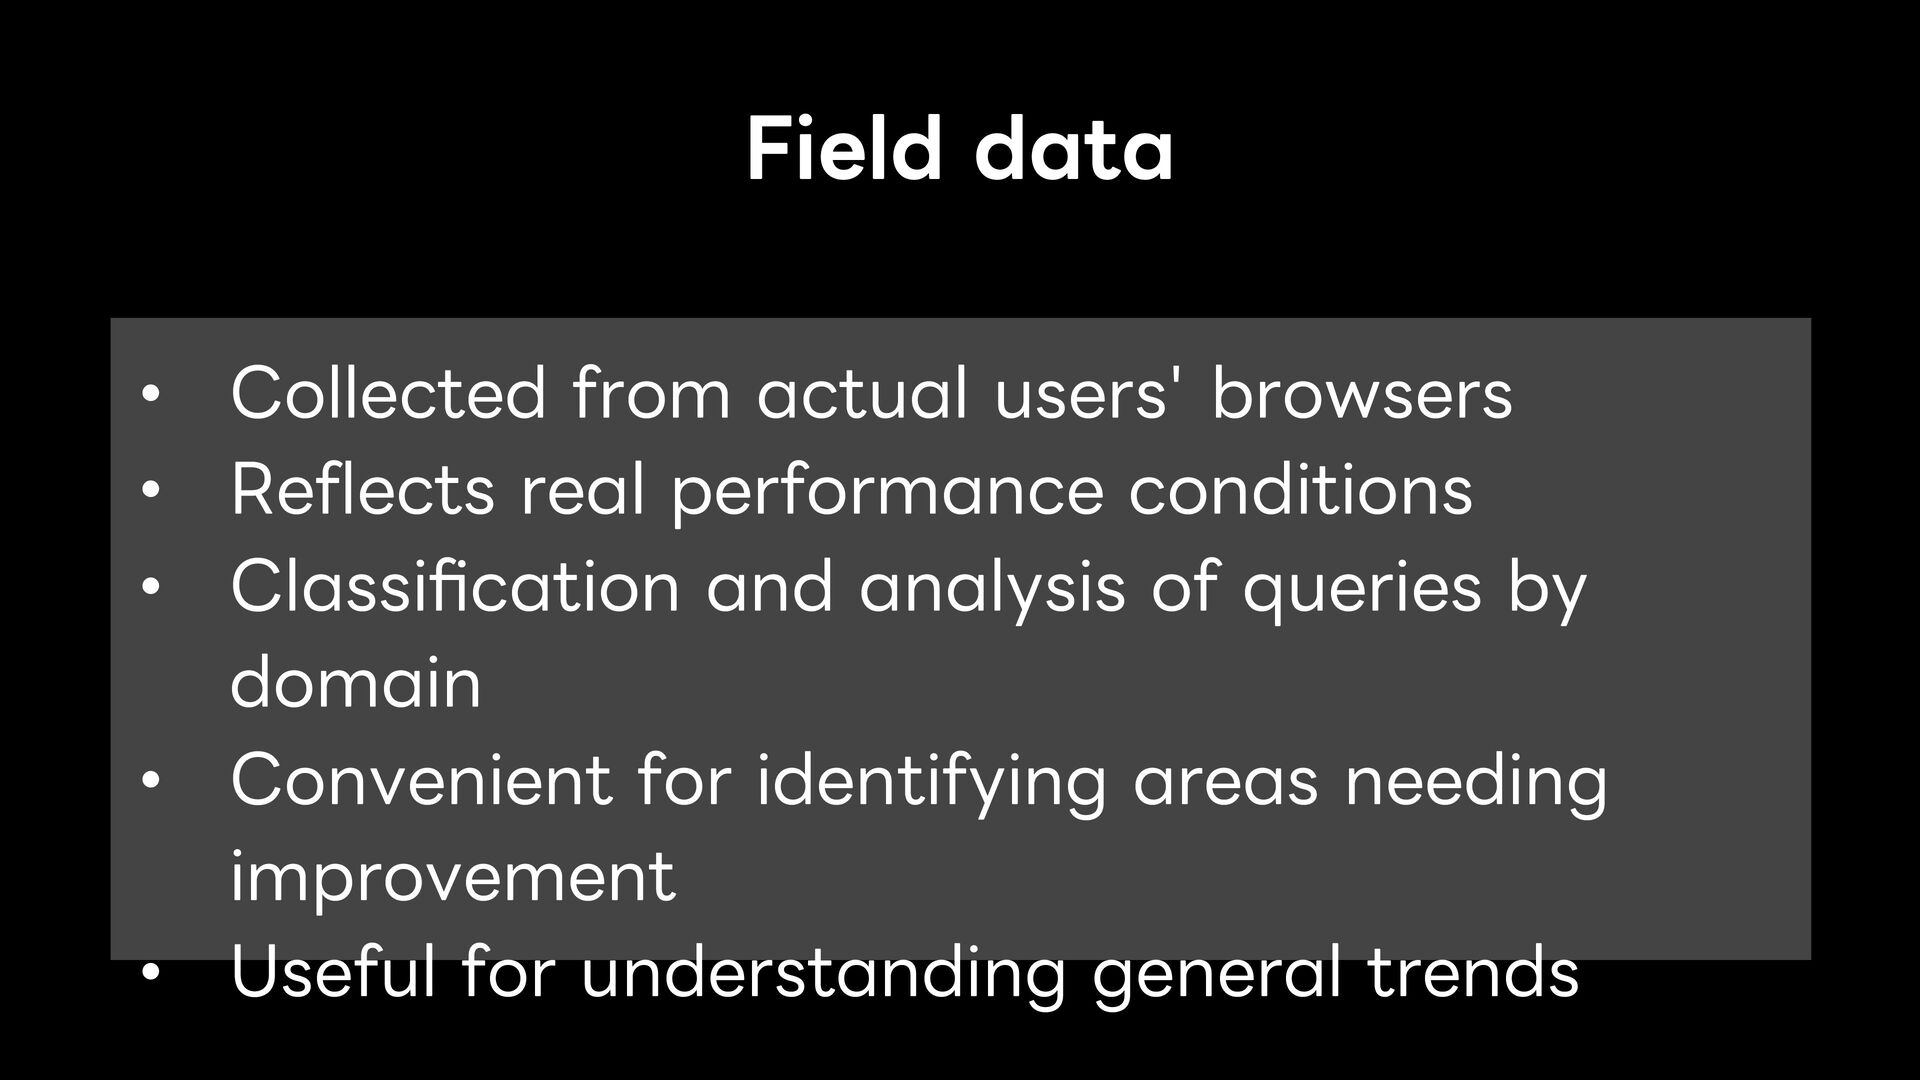
  12. • Collected from actual users' browsers • Reflects real performance

    conditions • Classification and analysis of queries by domain • Convenient for identifying areas needing improvement • Useful for understanding general trends Field data
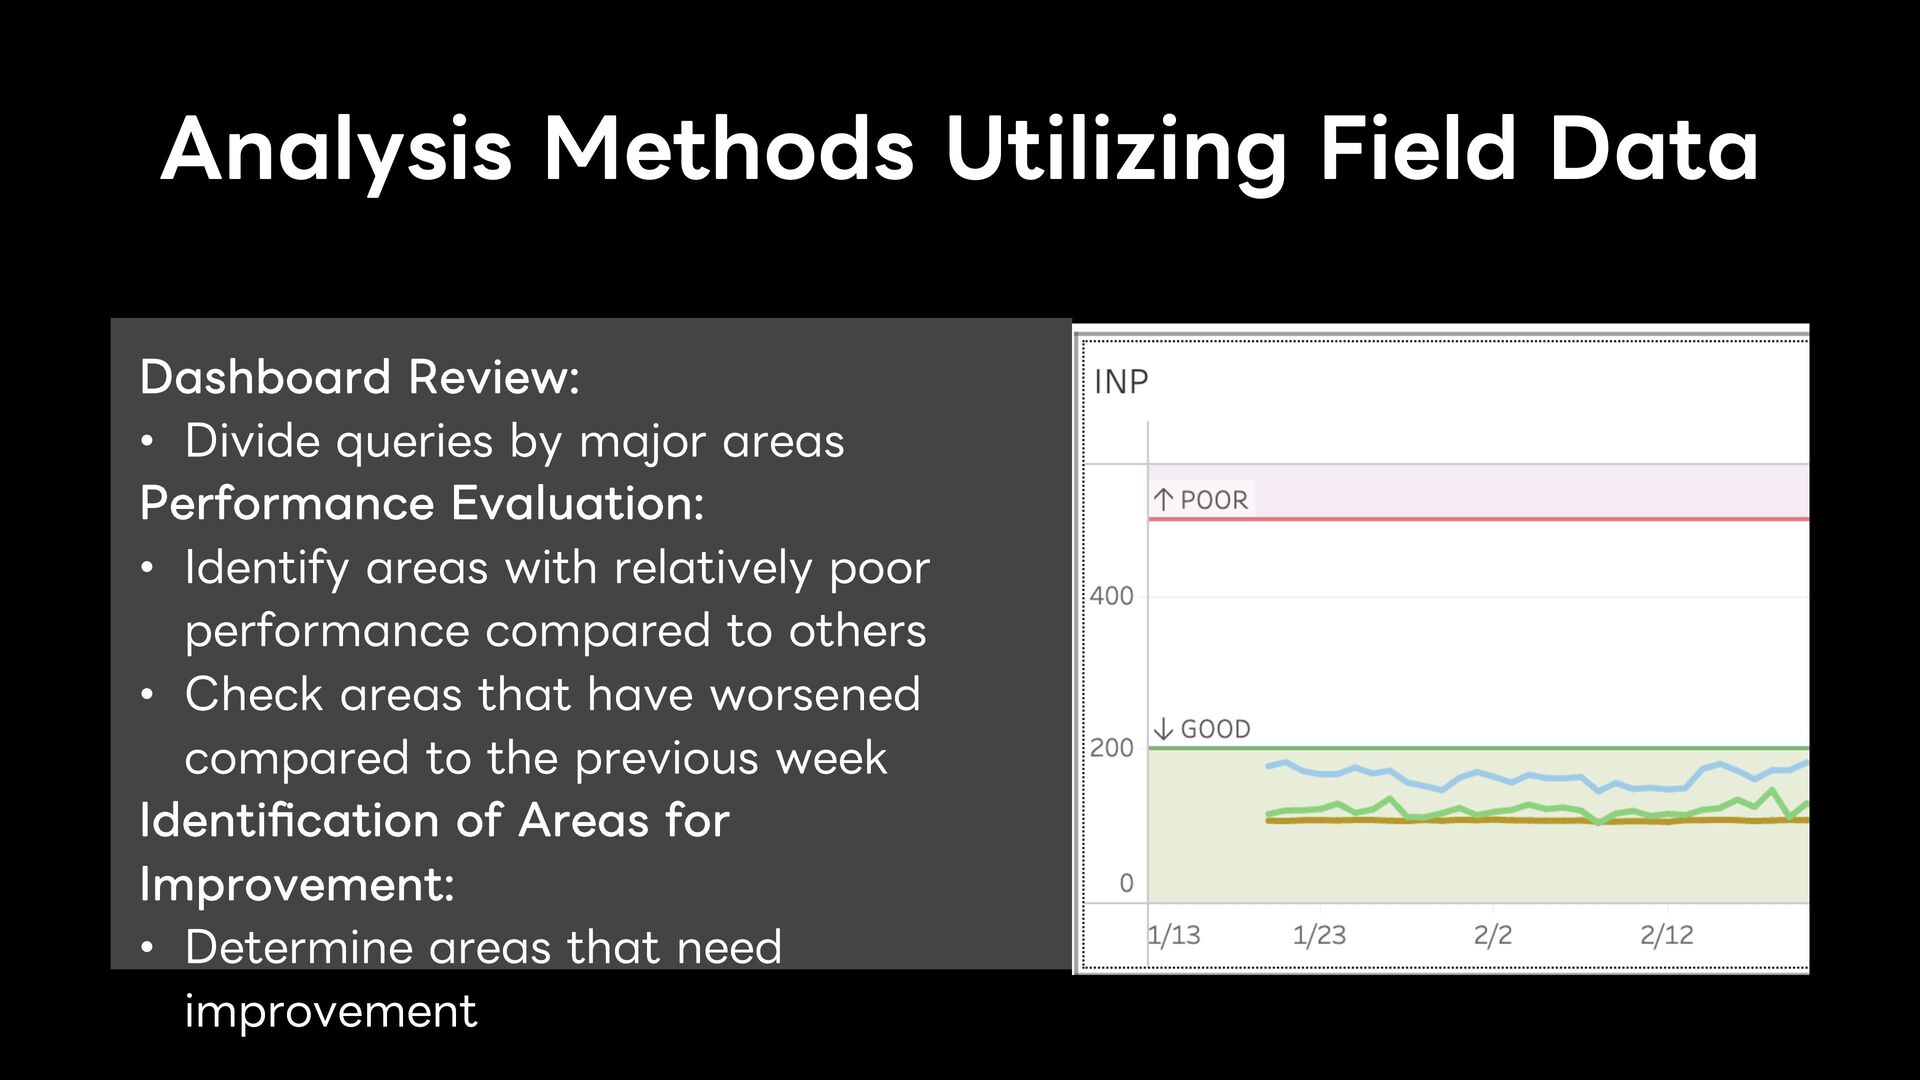
  13. Dashboard Review: • Divide queries by major areas Performance Evaluation:

    • Identify areas with relatively poor performance compared to others • Check areas that have worsened compared to the previous week Identification of Areas for Improvement: • Determine areas that need improvement Analysis Methods Utilizing Field Data
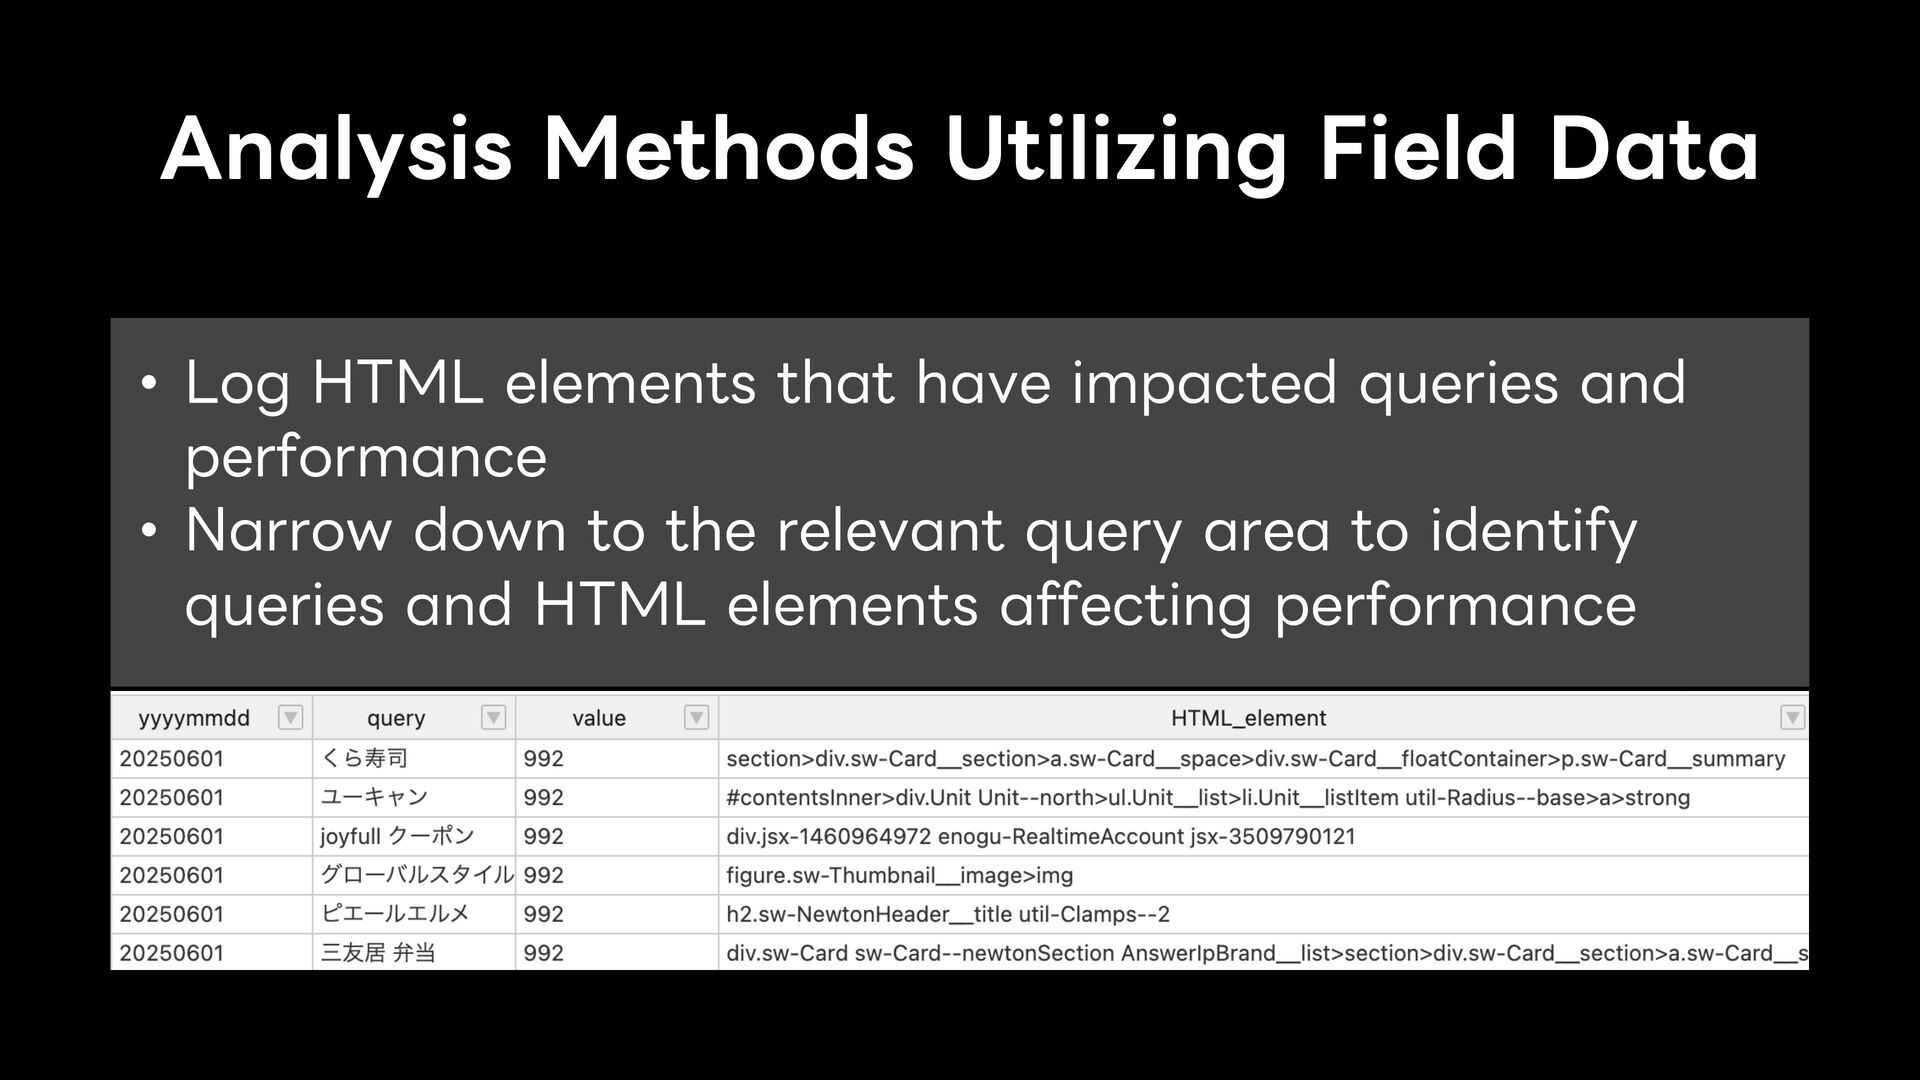
  14. • Log HTML elements that have impacted queries and performance

    • Narrow down to the relevant query area to identify queries and HTML elements affecting performance Analysis Methods Utilizing Field Data
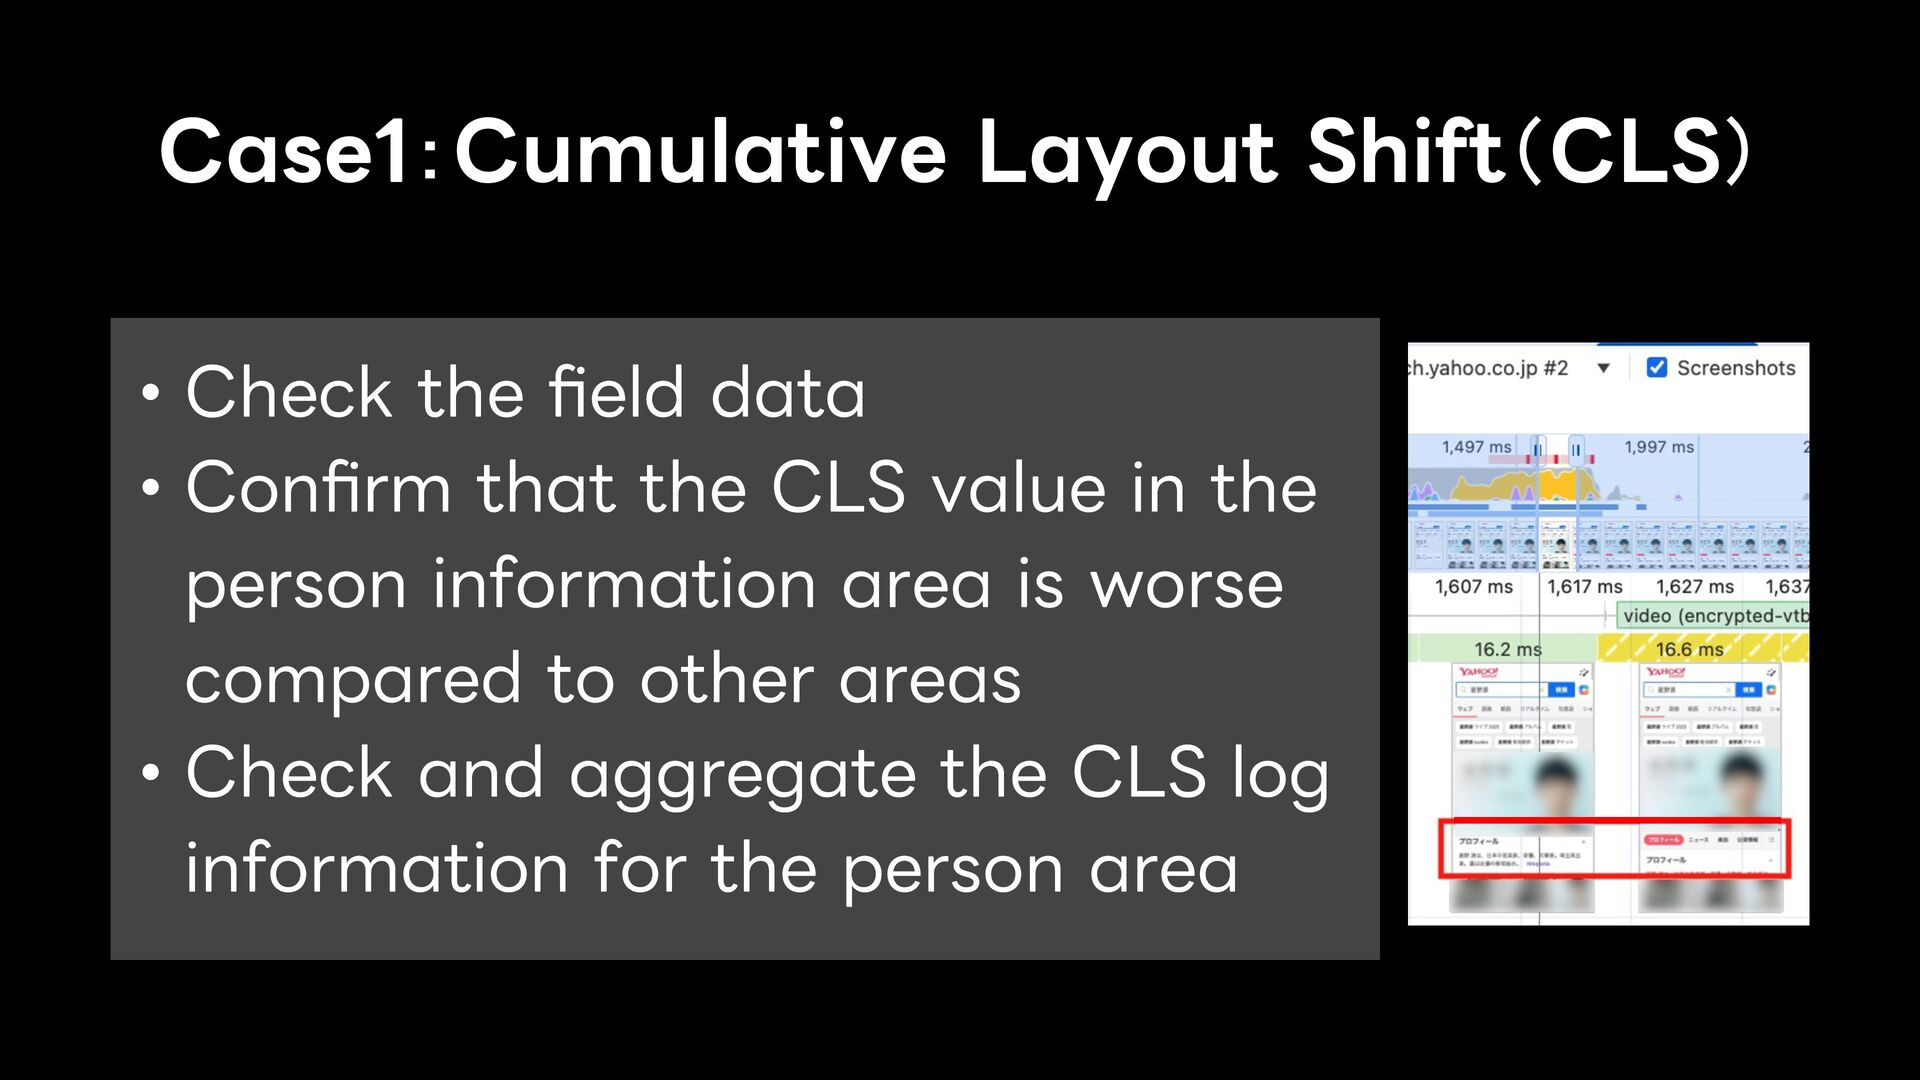
  15. • Check the field data • Confirm that the CLS

    value in the person information area is worse compared to other areas • Check and aggregate the CLS log information for the person area Case1:Cumulative Layout Shift(CLS)
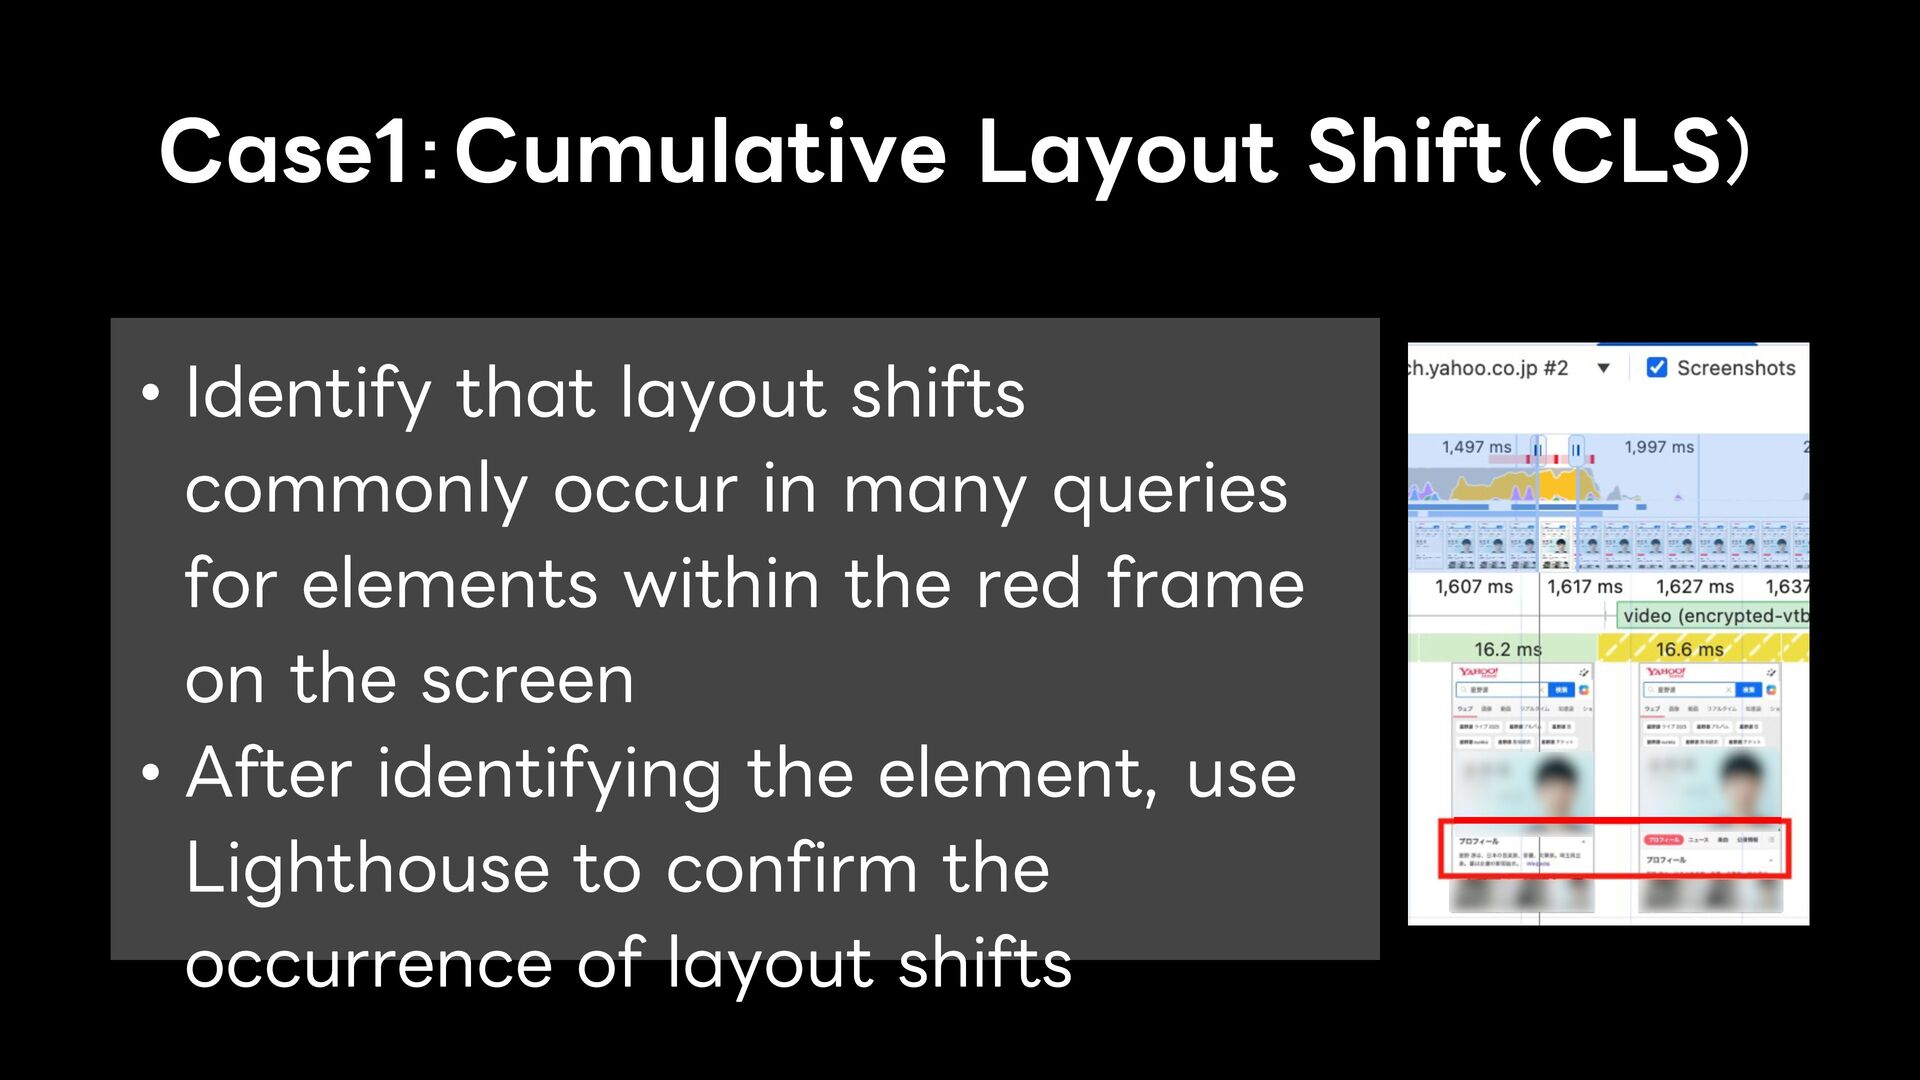
  16. • Identify that layout shifts commonly occur in many queries

    for elements within the red frame on the screen • After identifying the element, use Lighthouse to confirm the occurrence of layout shifts Case1:Cumulative Layout Shift(CLS)
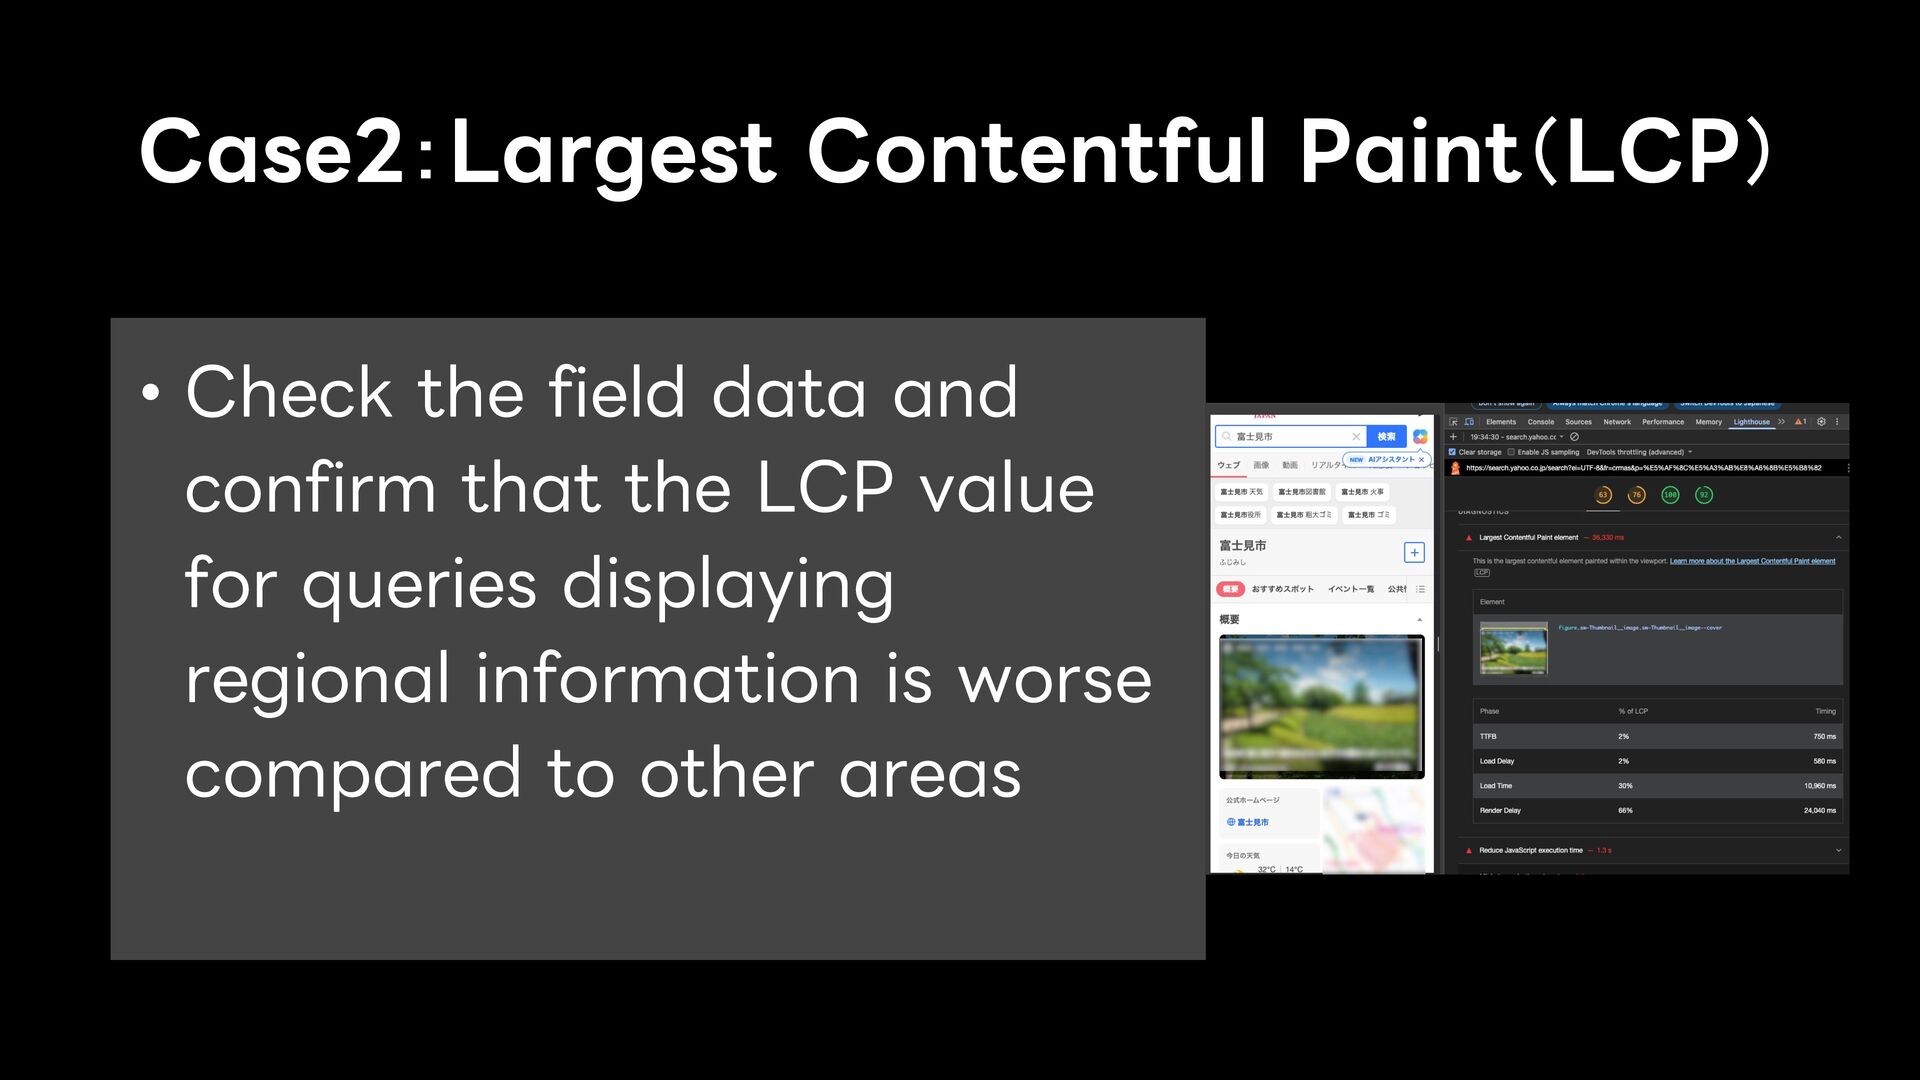
  17. • Check the field data and confirm that the LCP

    value for queries displaying regional information is worse compared to other areas Case2:Largest Contentful Paint(LCP)
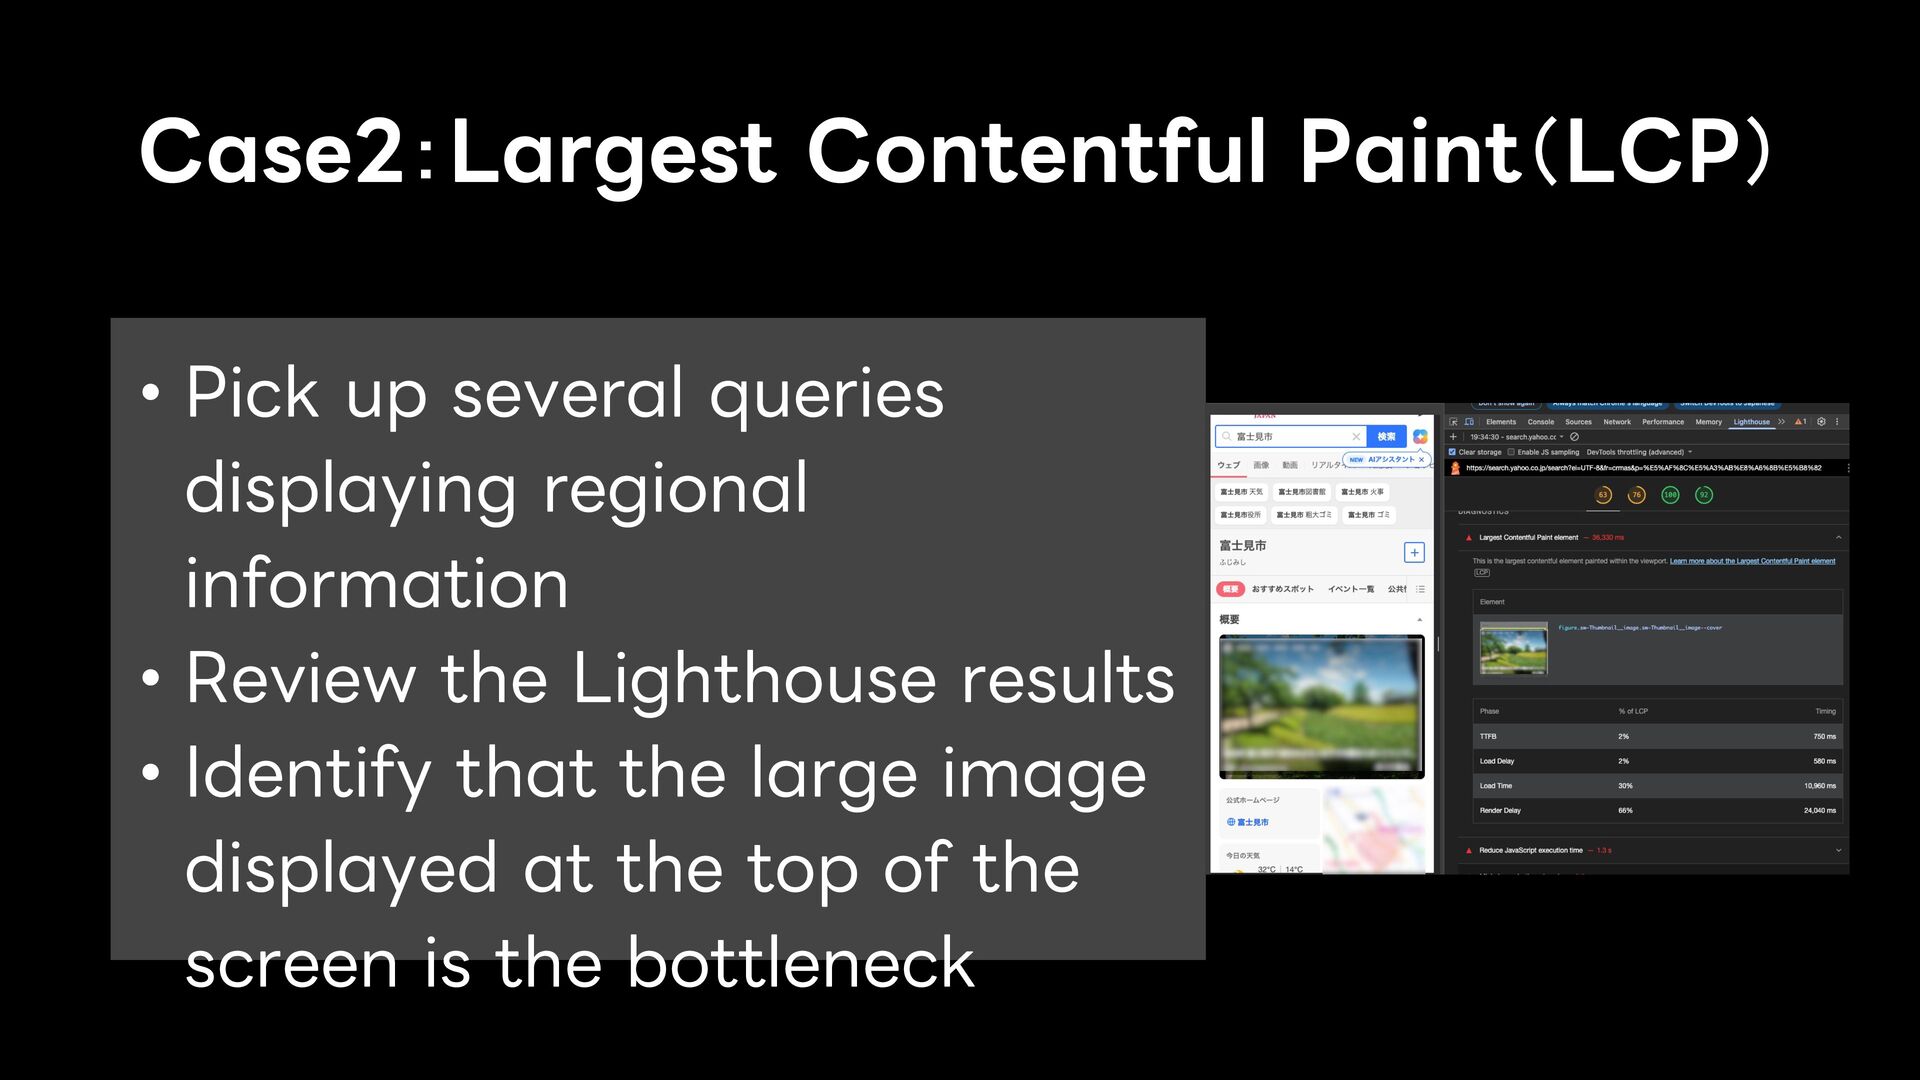
  18. • Pick up several queries displaying regional information • Review

    the Lighthouse results • Identify that the large image displayed at the top of the screen is the bottleneck Case2:Largest Contentful Paint(LCP)
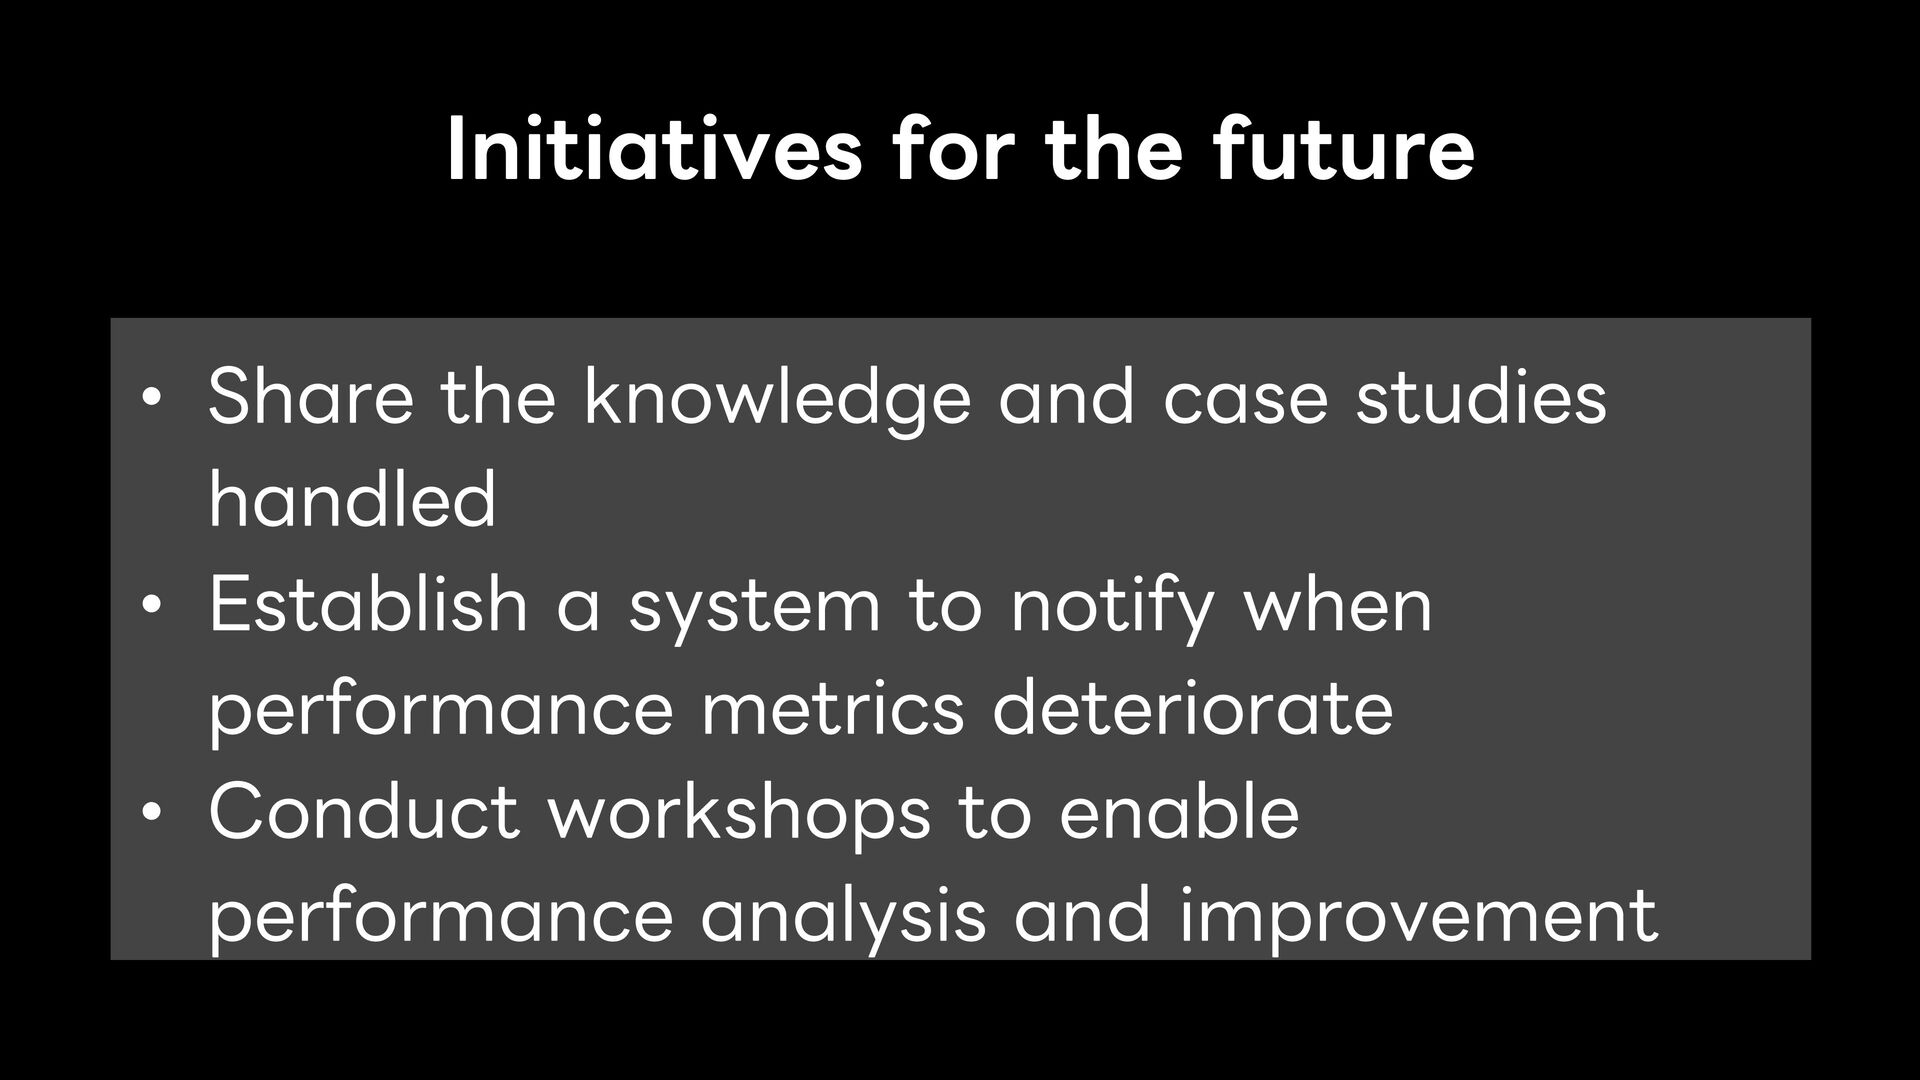
  19. • Share the knowledge and case studies handled • Establish

    a system to notify when performance metrics deteriorate • Conduct workshops to enable performance analysis and improvement Initiatives for the future

More Decks by LINEヤフーTech (LY Corporation Tech)