Upgrade to Pro — share decks privately, control downloads, hide ads and more …

Powerful Ad hoc, Real-time Analytics on Large D...

Avatar for Mike Mike
November 18, 2019

Powerful Ad hoc, Real-time Analytics on Large Datasets using Apache Druida

High Level Outline
Apache Druid Overview
Architecture and Real World Use Cases Discussion

Abstract
Providing users with self-service analytics on real-time data in large, multi-petabyte datasets is difficult. In an ideal world, you would give users access to the entire database with every dimension at their fingertips. However, this is often not technically feasible or leads to performance that is far too slow to be useful.

Enter Apache Druid. Druid is an open source analytics database powering real-time, ad hoc analytics. It is used for clickstream analytics, network telemetry, fraud detection, application monitoring and more by companies like Apple, Netflix, Twitter, and AirBnb. It can ingest millions of records per second and deliver sub-second response times to OLAP-style slice and dice queries performed on extremely large datasets.

In this presentation, we will start with the fundamentals of Druid before taking a deep dive into its inner workings while discussing several real world company use cases.

Avatar for Mike

Mike

November 18, 2019

Other Decks in Technology

Transcript

  1. Powerful Ad hoc, Real-time Analytics on Large Datasets using Apache

    Druid Mike McLaughlin Senior Field Engineer Imply
  2. Raise your hand ... How many … • are familiar

    with or heard of Apache Druid? • have used or are currently using Apache Druid? • currently have Druid in production?
  3. Introduction What are we doing here? • Introduction to Apache

    Druid with an emphasis on large, streaming datasets ◦ Overview ◦ Architecture ◦ Real world use cases Who am I? • Mike McLaughlin ([email protected]) • Senior Field Engineer with Imply • Work with users of Apache Druid throughout Central US Who is Imply? • Imply was created in 2015 by the founders of Apache Druid • Offer products and services for Apache Druid
  4. Quick Survey - Fill out for chance at $50 Amazon

    Gift Card! Fill out a short survey at the end of this talk
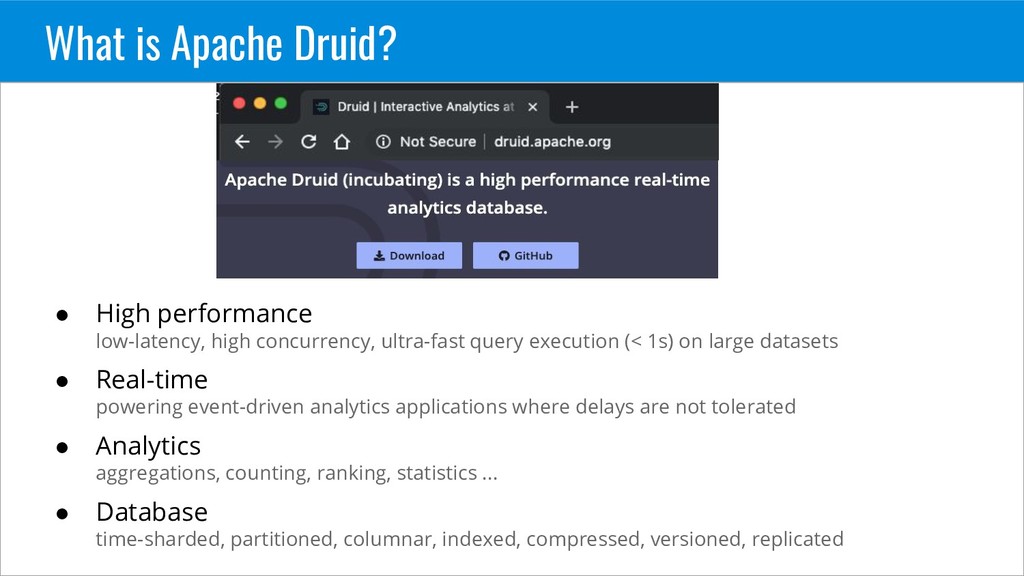
  5. What is Apache Druid? • High performance low-latency, high concurrency,

    ultra-fast query execution (< 1s) on large datasets • Real-time powering event-driven analytics applications where delays are not tolerated • Analytics aggregations, counting, ranking, statistics ... • Database time-sharded, partitioned, columnar, indexed, compressed, versioned, replicated
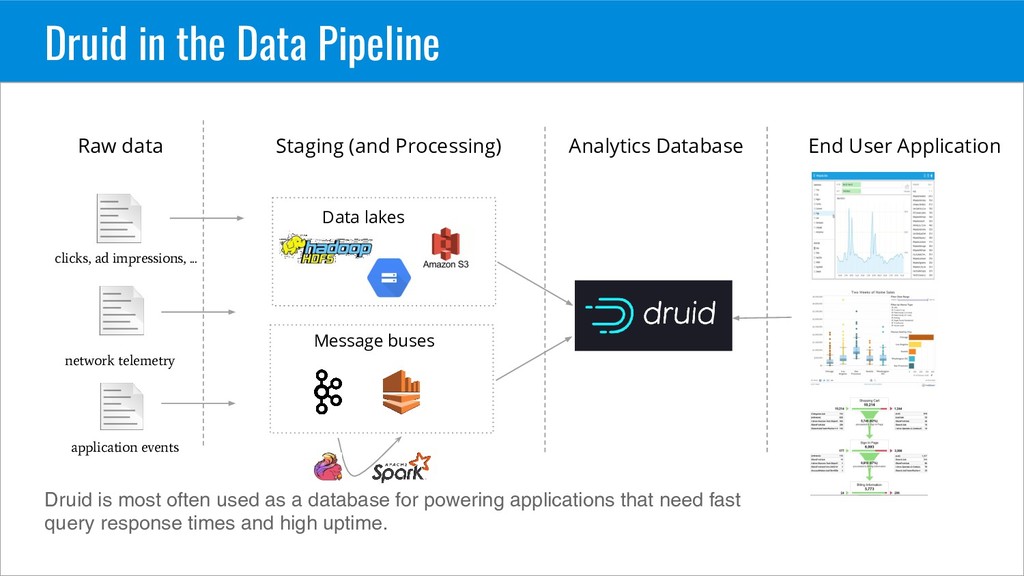
  6. Druid in the Data Pipeline Data lakes Message buses Raw

    data Staging (and Processing) Analytics Database End User Application Druid is most often used as a database for powering applications that need fast query response times and high uptime. clicks, ad impressions, ... network telemetry application events
  7. Open Source Community • Open Source in 2012 • Apache

    (incubating) Project ◦ Expected to be out of incubation late 2019 • 30+ committers from 15 organizations • 150+ contributors from 100+ organizations • 1000+ companies using Apache Druid
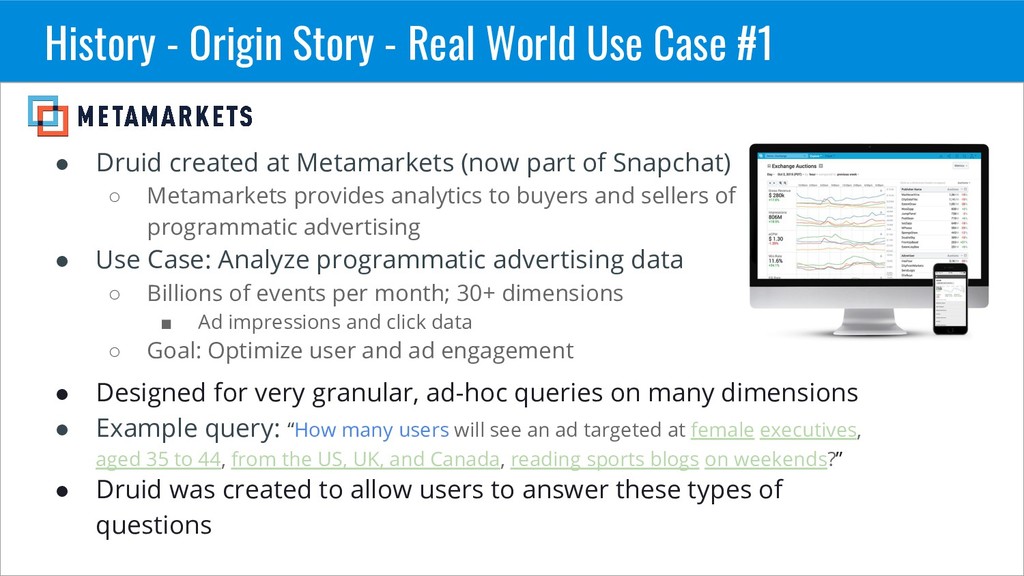
  8. History - Origin Story - Real World Use Case #1

    • Druid created at Metamarkets (now part of Snapchat) ◦ Metamarkets provides analytics to buyers and sellers of programmatic advertising • Use Case: Analyze programmatic advertising data ◦ Billions of events per month; 30+ dimensions ▪ Ad impressions and click data ◦ Goal: Optimize user and ad engagement • Designed for very granular, ad-hoc queries on many dimensions • Example query: “How many users will see an ad targeted at female executives, aged 35 to 44, from the US, UK, and Canada, reading sports blogs on weekends?” • Druid was created to allow users to answer these types of questions
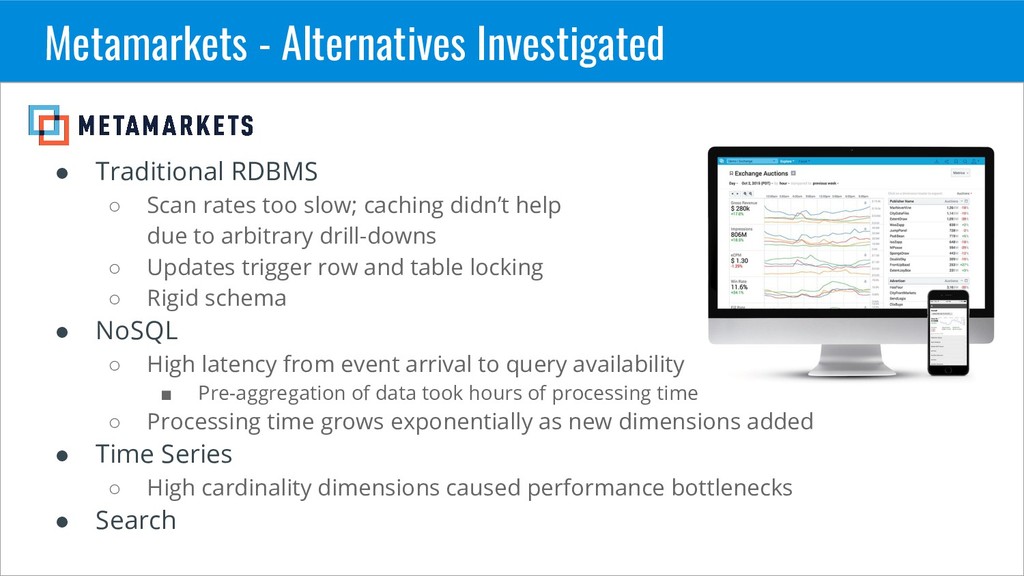
  9. Metamarkets - Alternatives Investigated • Traditional RDBMS ◦ Scan rates

    too slow; caching didn’t help due to arbitrary drill-downs ◦ Updates trigger row and table locking ◦ Rigid schema • NoSQL ◦ High latency from event arrival to query availability ▪ Pre-aggregation of data took hours of processing time ◦ Processing time grows exponentially as new dimensions added • Time Series ◦ High cardinality dimensions caused performance bottlenecks • Search
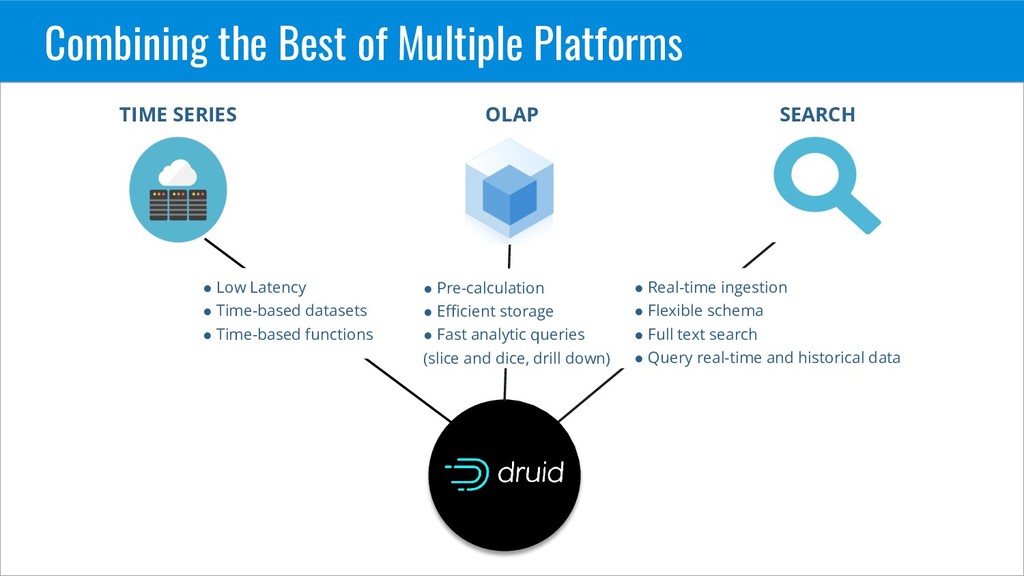
  10. Combining the Best of Multiple Platforms OLAP SEARCH TIME SERIES

    • Real-time ingestion • Flexible schema • Full text search • Query real-time and historical data • Low Latency • Time-based datasets • Time-based functions • Pre-calculation • Efficient storage • Fast analytic queries (slice and dice, drill down)
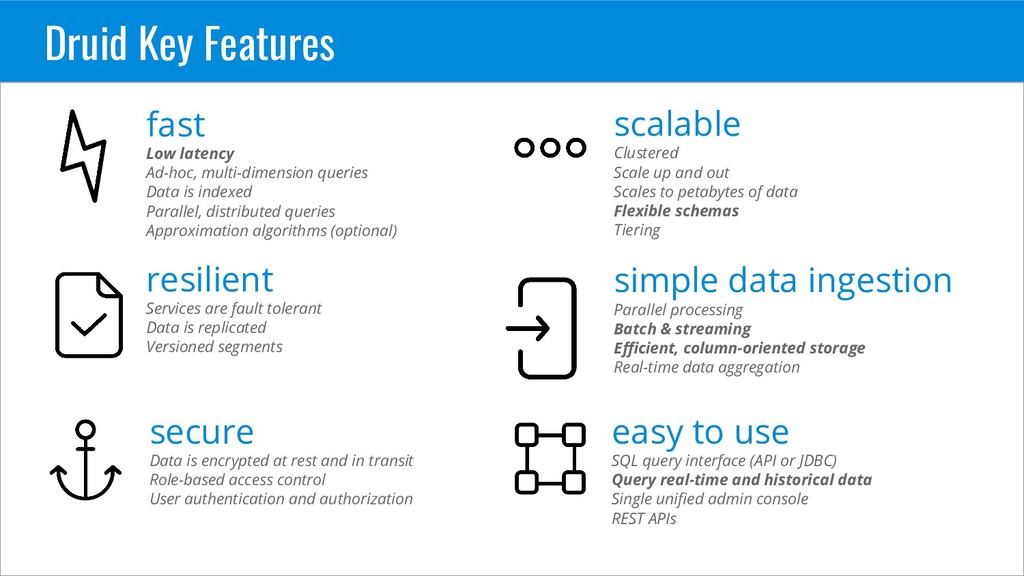
  11. Druid Key Features fast Low latency Ad-hoc, multi-dimension queries Data

    is indexed Parallel, distributed queries Approximation algorithms (optional) simple data ingestion Parallel processing Batch & streaming Efficient, column-oriented storage Real-time data aggregation resilient Services are fault tolerant Data is replicated Versioned segments scalable Clustered Scale up and out Scales to petabytes of data Flexible schemas Tiering secure Data is encrypted at rest and in transit Role-based access control User authentication and authorization easy to use SQL query interface (API or JDBC) Query real-time and historical data Single unified admin console REST APIs
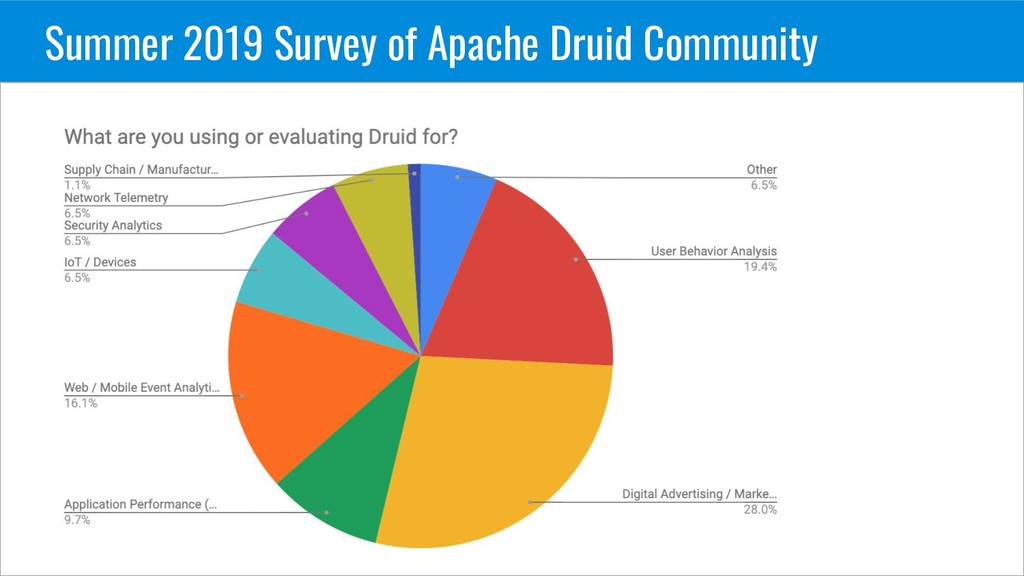
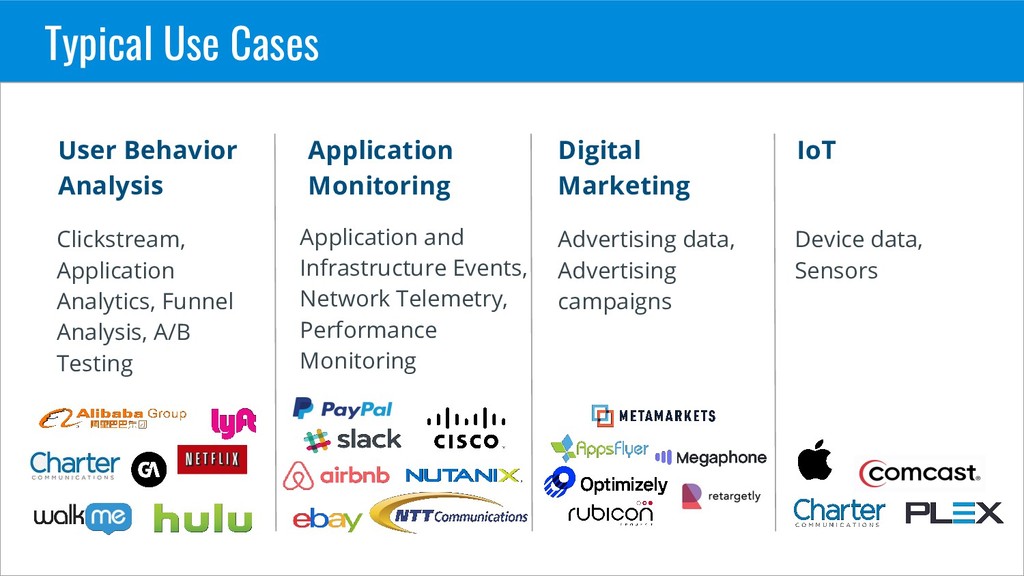
  12. Typical Use Cases Application Monitoring Application and Infrastructure Events, Network

    Telemetry, Performance Monitoring User Behavior Analysis Digital Marketing Advertising data, Advertising campaigns IoT Clickstream, Application Analytics, Funnel Analysis, A/B Testing Device data, Sensors
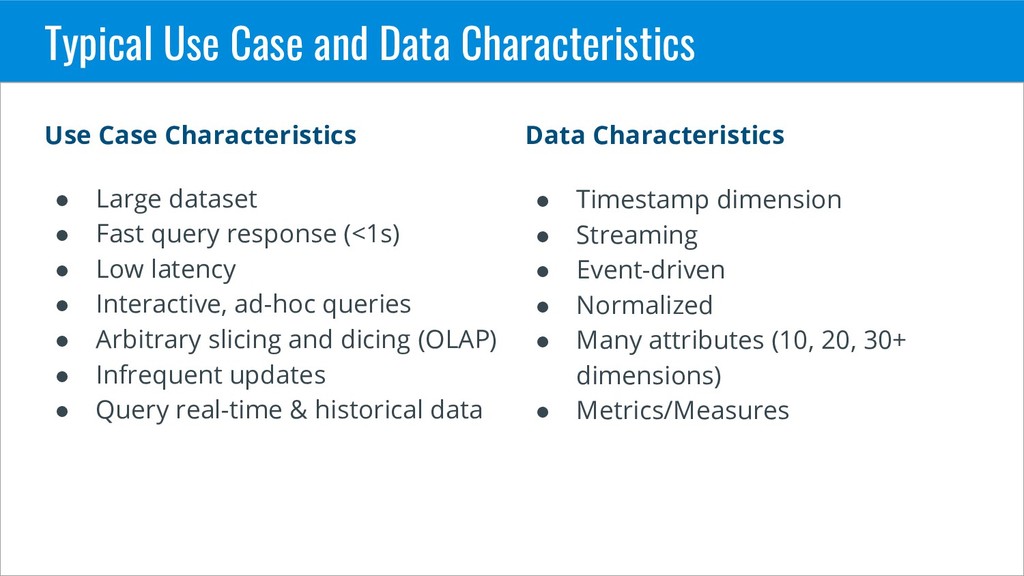
  13. Typical Use Case and Data Characteristics • Timestamp dimension •

    Streaming • Event-driven • Normalized • Many attributes (10, 20, 30+ dimensions) • Metrics/Measures Data Characteristics • Large dataset • Fast query response (<1s) • Low latency • Interactive, ad-hoc queries • Arbitrary slicing and dicing (OLAP) • Infrequent updates • Query real-time & historical data Use Case Characteristics
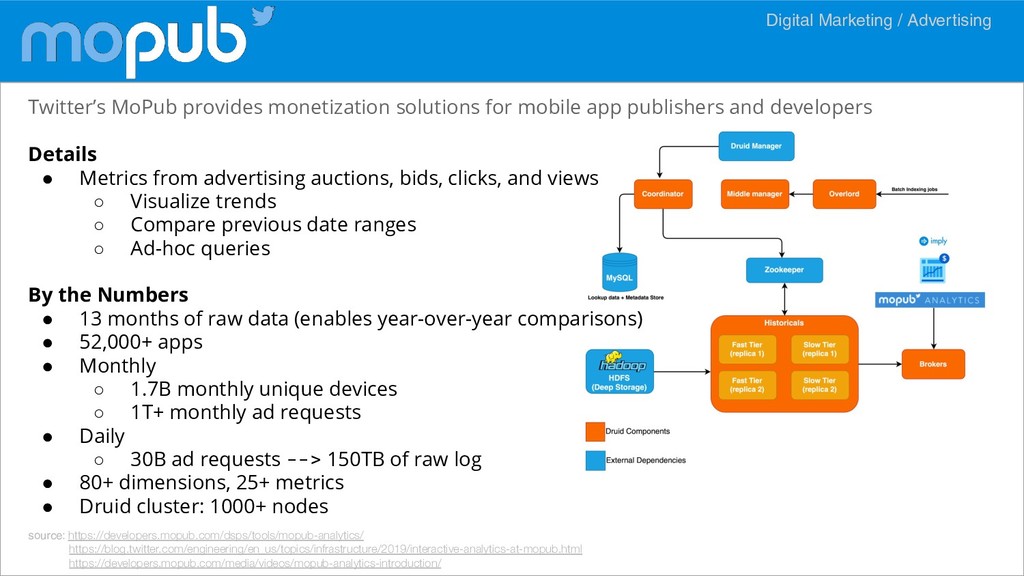
  14. source: https://developers.mopub.com/dsps/tools/mopub-analytics/ https://blog.twitter.com/engineering/en_us/topics/infrastructure/2019/interactive-analytics-at-mopub.html https://developers.mopub.com/media/videos/mopub-analytics-introduction/ Digital Marketing / Advertising Twitter’s MoPub

    provides monetization solutions for mobile app publishers and developers Details • Metrics from advertising auctions, bids, clicks, and views ◦ Visualize trends ◦ Compare previous date ranges ◦ Ad-hoc queries By the Numbers • 13 months of raw data (enables year-over-year comparisons) • 52,000+ apps • Monthly ◦ 1.7B monthly unique devices ◦ 1T+ monthly ad requests • Daily ◦ 30B ad requests --> 150TB of raw log • 80+ dimensions, 25+ metrics • Druid cluster: 1000+ nodes
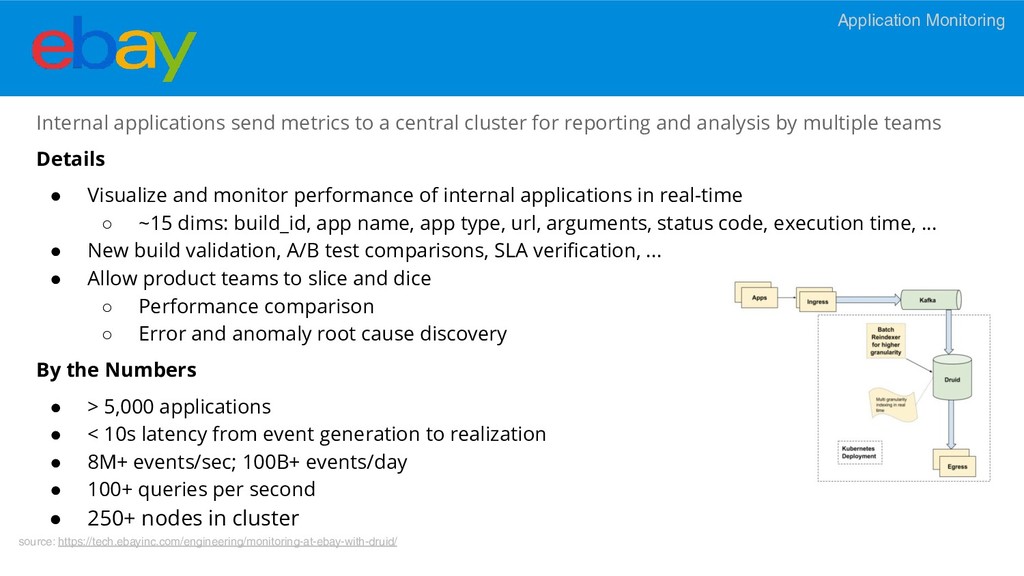
  15. Internal applications send metrics to a central cluster for reporting

    and analysis by multiple teams Details • Visualize and monitor performance of internal applications in real-time ◦ ~15 dims: build_id, app name, app type, url, arguments, status code, execution time, ... • New build validation, A/B test comparisons, SLA verification, ... • Allow product teams to slice and dice ◦ Performance comparison ◦ Error and anomaly root cause discovery By the Numbers • > 5,000 applications • < 10s latency from event generation to realization • 8M+ events/sec; 100B+ events/day • 100+ queries per second • 250+ nodes in cluster source: https://tech.ebayinc.com/engineering/monitoring-at-ebay-with-druid/ Application Monitoring
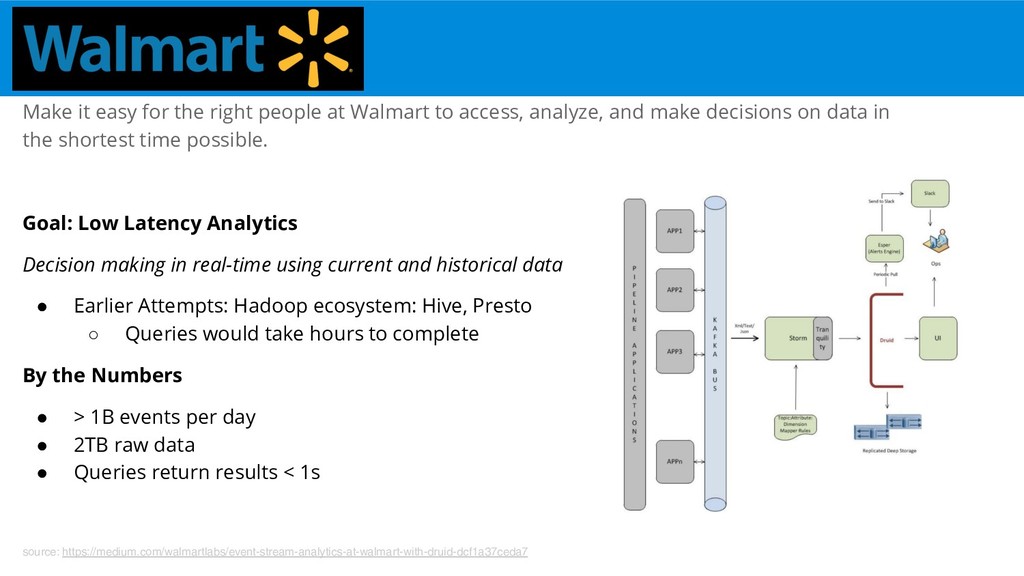
  16. Make it easy for the right people at Walmart to

    access, analyze, and make decisions on data in the shortest time possible. Goal: Low Latency Analytics Decision making in real-time using current and historical data • Earlier Attempts: Hadoop ecosystem: Hive, Presto ◦ Queries would take hours to complete By the Numbers • > 1B events per day • 2TB raw data • Queries return results < 1s source: https://medium.com/walmartlabs/event-stream-analytics-at-walmart-with-druid-dcf1a37ceda7
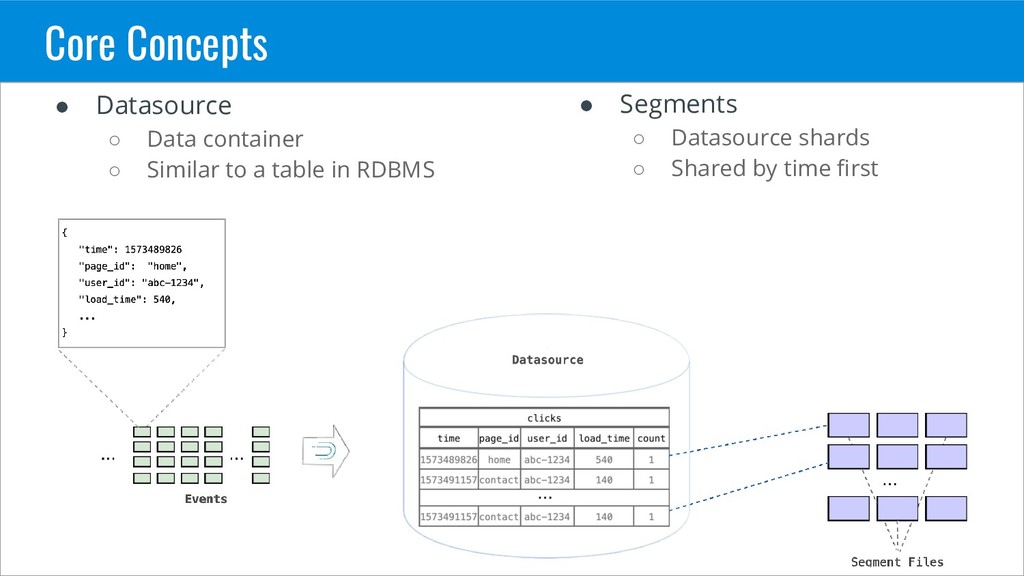
  17. Core Concepts • Datasource ◦ Data container ◦ Similar to

    a table in RDBMS • Segments ◦ Datasource shards ◦ Shared by time first
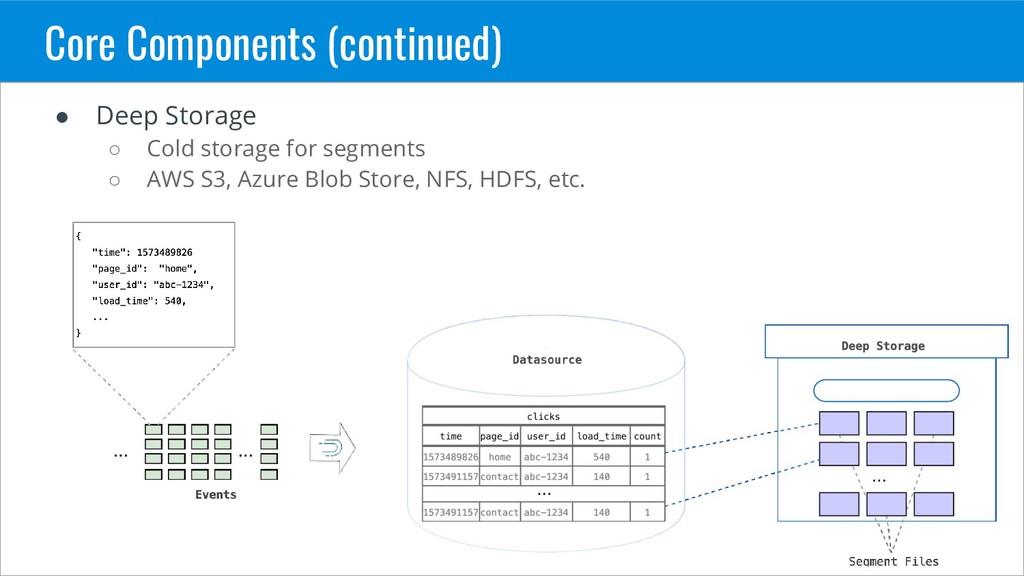
  18. Core Components (continued) • Deep Storage ◦ Cold storage for

    segments ◦ AWS S3, Azure Blob Store, NFS, HDFS, etc.
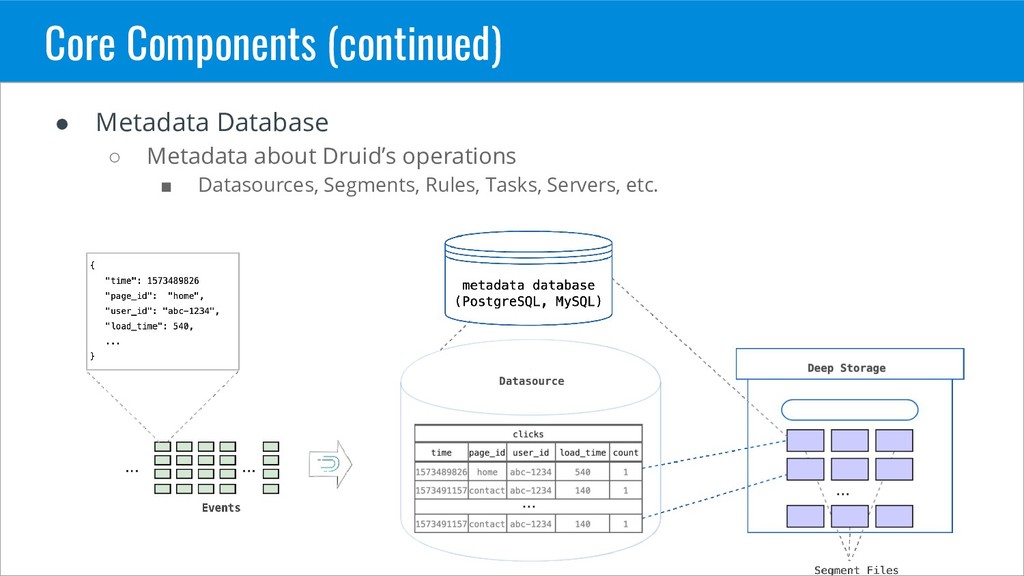
  19. Core Components (continued) • Metadata Database ◦ Metadata about Druid’s

    operations ▪ Datasources, Segments, Rules, Tasks, Servers, etc.
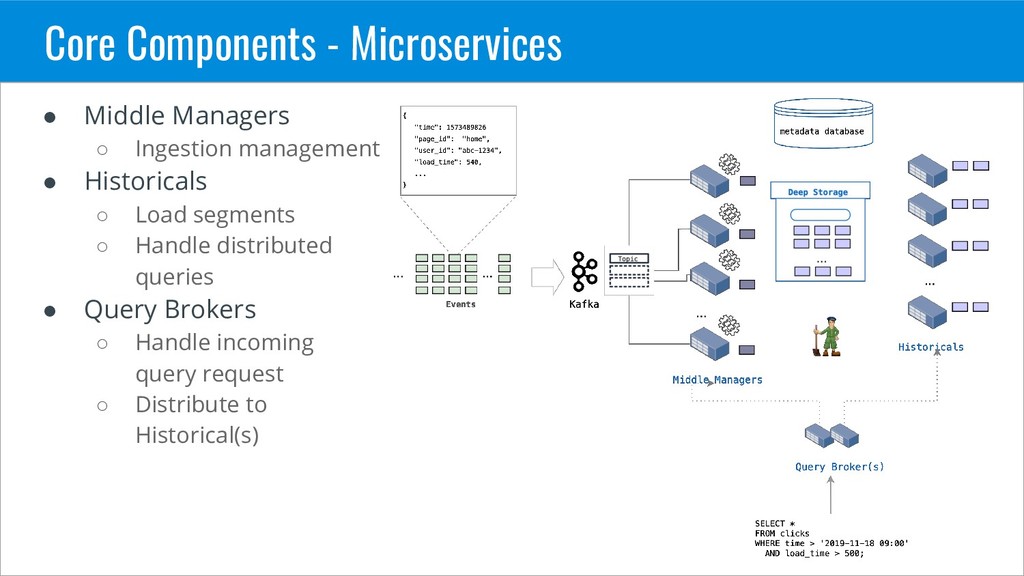
  20. Core Components - Microservices • Middle Managers ◦ Ingestion management

    • Historicals ◦ Load segments ◦ Handle distributed queries • Query Brokers ◦ Handle incoming query request ◦ Distribute to Historical(s)
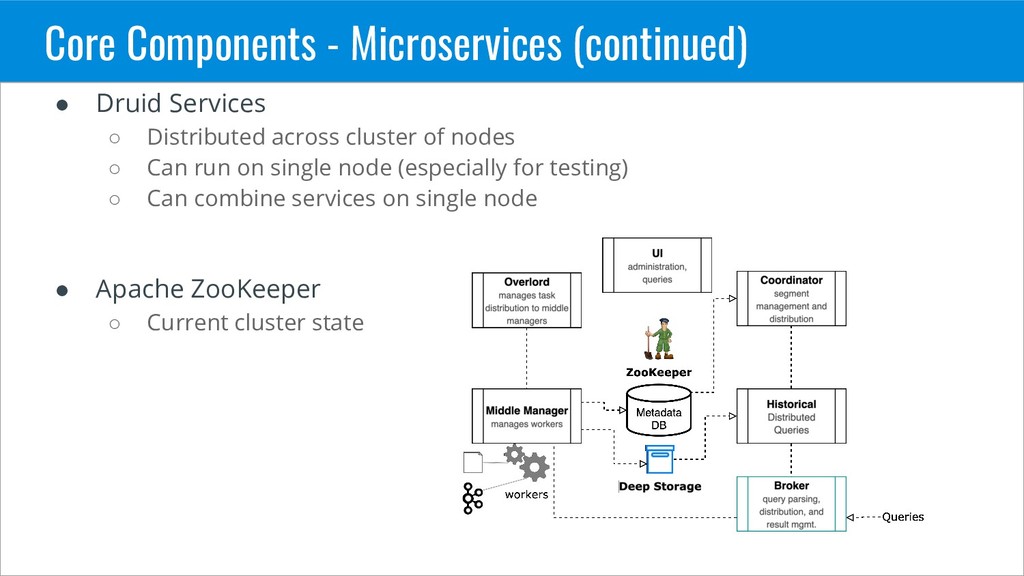
  21. Core Components - Microservices (continued) • Druid Services ◦ Distributed

    across cluster of nodes ◦ Can run on single node (especially for testing) ◦ Can combine services on single node • Apache ZooKeeper ◦ Current cluster state
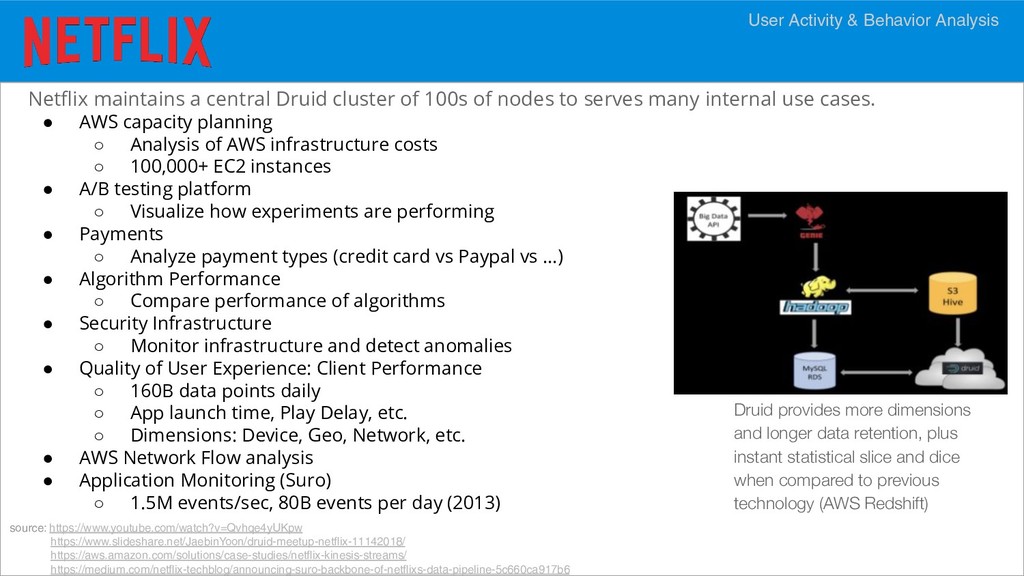
  22. Druid provides more dimensions and longer data retention, plus instant

    statistical slice and dice when compared to previous technology (AWS Redshift) source: https://www.youtube.com/watch?v=Qvhqe4yUKpw https://www.slideshare.net/JaebinYoon/druid-meetup-netflix-11142018/ https://aws.amazon.com/solutions/case-studies/netflix-kinesis-streams/ https://medium.com/netflix-techblog/announcing-suro-backbone-of-netflixs-data-pipeline-5c660ca917b6 Netflix maintains a central Druid cluster of 100s of nodes to serves many internal use cases. • AWS capacity planning ◦ Analysis of AWS infrastructure costs ◦ 100,000+ EC2 instances • A/B testing platform ◦ Visualize how experiments are performing • Payments ◦ Analyze payment types (credit card vs Paypal vs …) • Algorithm Performance ◦ Compare performance of algorithms • Security Infrastructure ◦ Monitor infrastructure and detect anomalies • Quality of User Experience: Client Performance ◦ 160B data points daily ◦ App launch time, Play Delay, etc. ◦ Dimensions: Device, Geo, Network, etc. • AWS Network Flow analysis • Application Monitoring (Suro) ◦ 1.5M events/sec, 80B events per day (2013) User Activity & Behavior Analysis
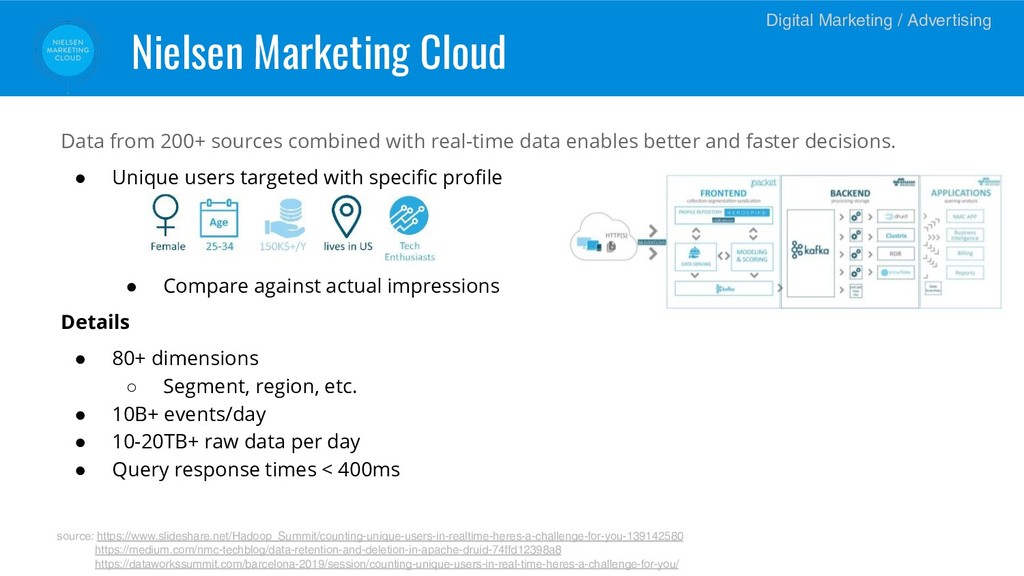
  23. Data from 200+ sources combined with real-time data enables better

    and faster decisions. • Unique users targeted with specific profile • Compare against actual impressions Details • 80+ dimensions ◦ Segment, region, etc. • 10B+ events/day • 10-20TB+ raw data per day • Query response times < 400ms source: https://www.slideshare.net/Hadoop_Summit/counting-unique-users-in-realtime-heres-a-challenge-for-you-139142580 https://medium.com/nmc-techblog/data-retention-and-deletion-in-apache-druid-74ffd12398a8 https://dataworkssummit.com/barcelona-2019/session/counting-unique-users-in-real-time-heres-a-challenge-for-you/ Nielsen Marketing Cloud Digital Marketing / Advertising
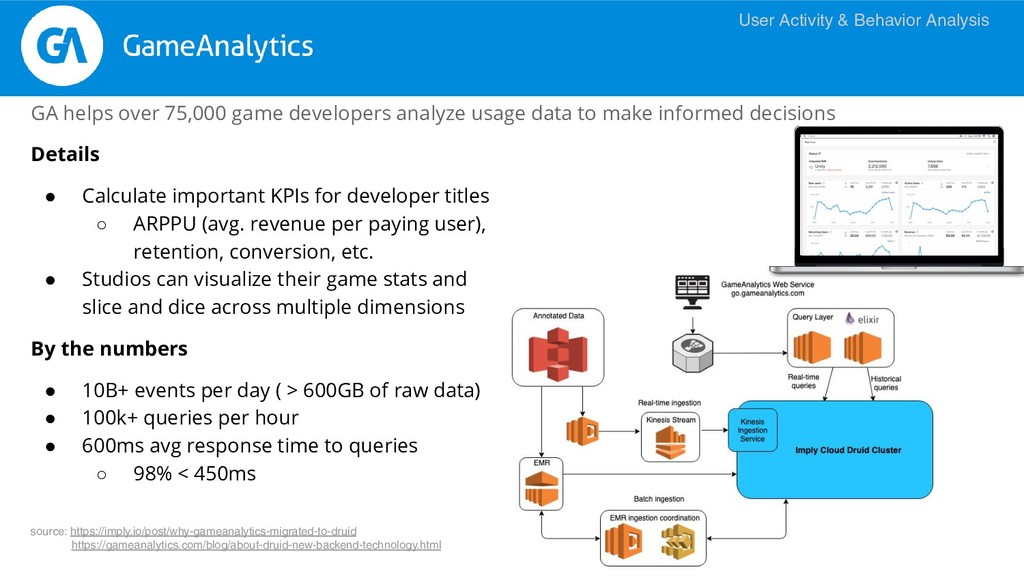
  24. GA helps over 75,000 game developers analyze usage data to

    make informed decisions Details • Calculate important KPIs for developer titles ◦ ARPPU (avg. revenue per paying user), retention, conversion, etc. • Studios can visualize their game stats and slice and dice across multiple dimensions By the numbers • 10B+ events per day ( > 600GB of raw data) • 100k+ queries per hour • 600ms avg response time to queries ◦ 98% < 450ms User Activity & Behavior Analysis source: https://imply.io/post/why-gameanalytics-migrated-to-druid https://gameanalytics.com/blog/about-druid-new-backend-technology.html
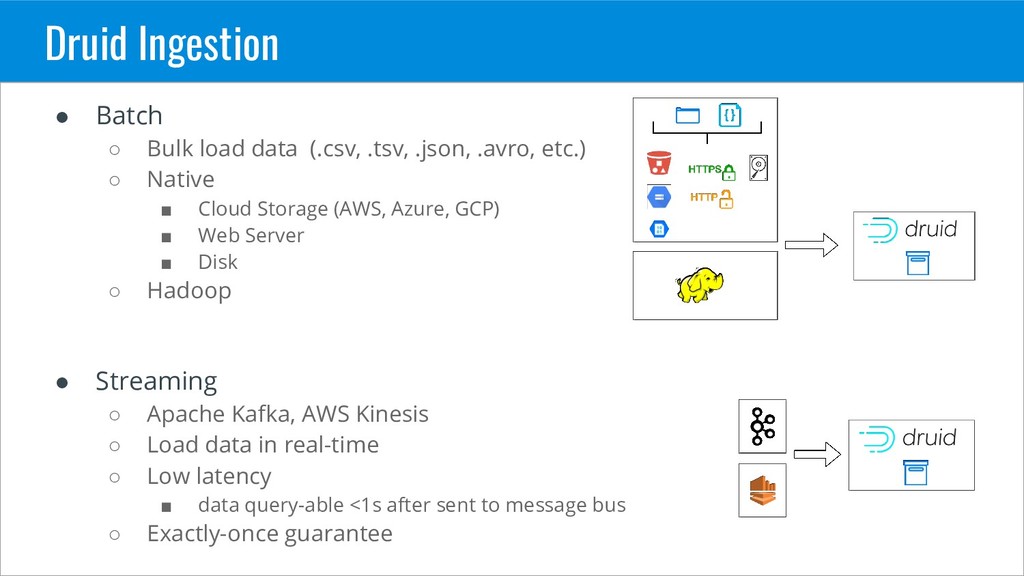
  25. Druid Ingestion • Batch ◦ Bulk load data (.csv, .tsv,

    .json, .avro, etc.) ◦ Native ▪ Cloud Storage (AWS, Azure, GCP) ▪ Web Server ▪ Disk ◦ Hadoop • Streaming ◦ Apache Kafka, AWS Kinesis ◦ Load data in real-time ◦ Low latency ▪ data query-able <1s after sent to message bus ◦ Exactly-once guarantee
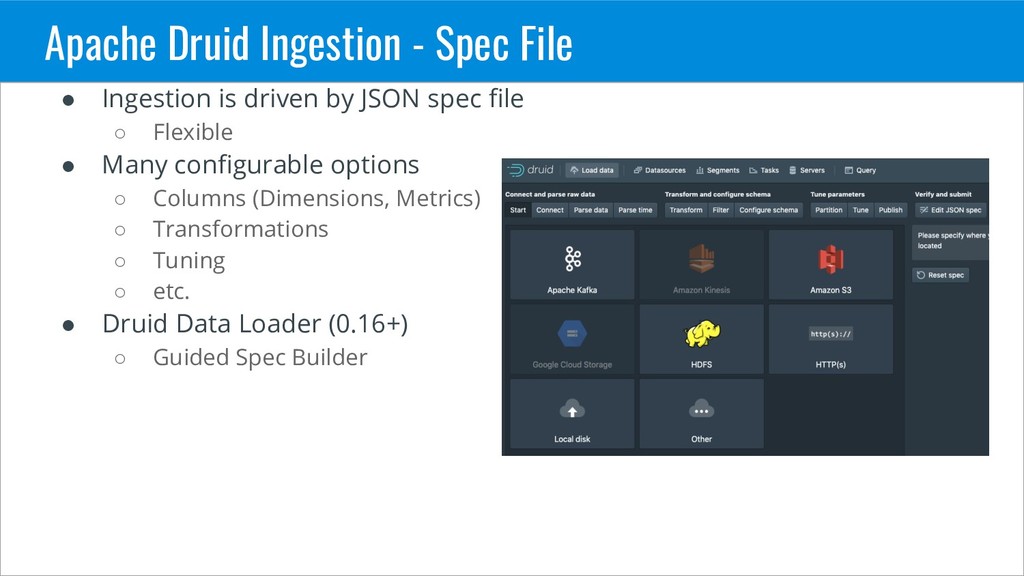
  26. Apache Druid Ingestion - Spec File • Ingestion is driven

    by JSON spec file ◦ Flexible • Many configurable options ◦ Columns (Dimensions, Metrics) ◦ Transformations ◦ Tuning ◦ etc. • Druid Data Loader (0.16+) ◦ Guided Spec Builder
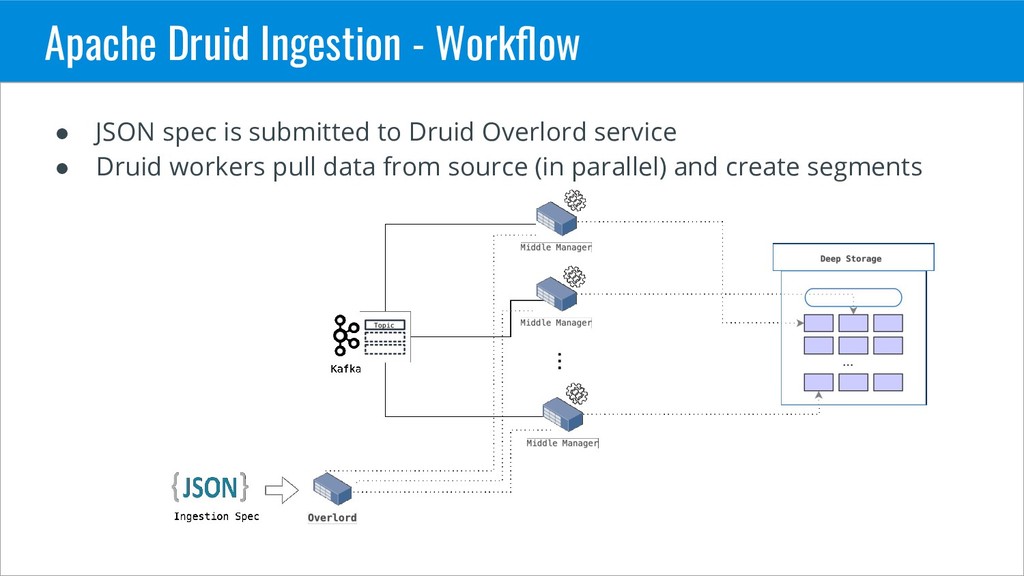
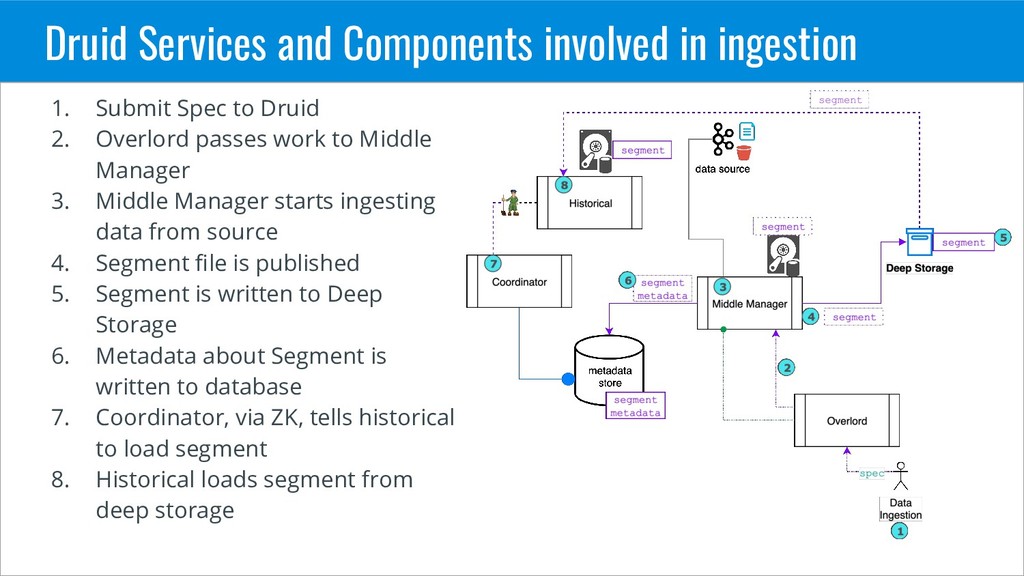
  27. Apache Druid Ingestion - Workflow • JSON spec is submitted

    to Druid Overlord service • Druid workers pull data from source (in parallel) and create segments
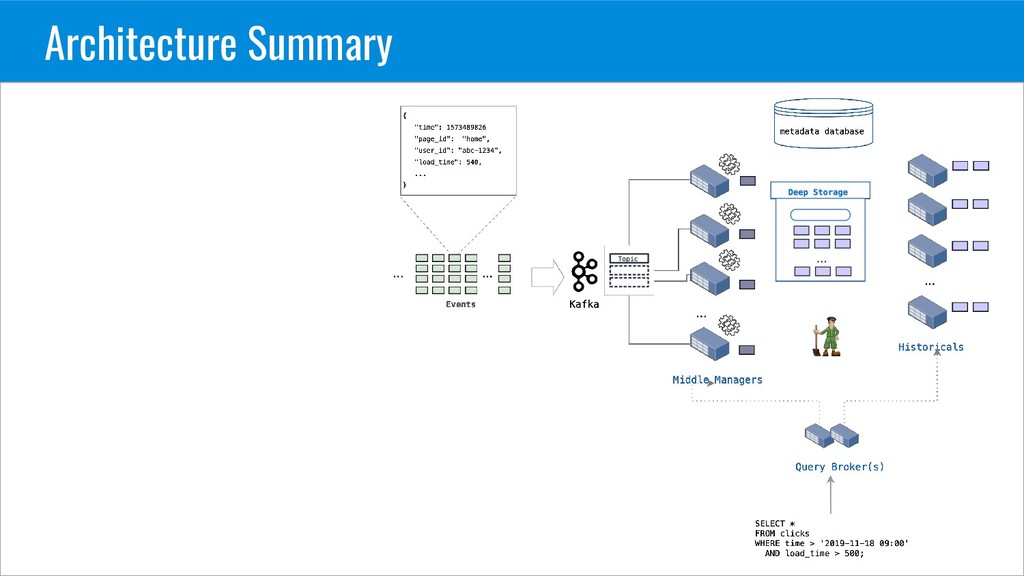
  28. Druid Services and Components involved in ingestion 1. Submit Spec

    to Druid 2. Overlord passes work to Middle Manager 3. Middle Manager starts ingesting data from source 4. Segment file is published 5. Segment is written to Deep Storage 6. Metadata about Segment is written to database 7. Coordinator, via ZK, tells historical to load segment 8. Historical loads segment from deep storage
  29. Rollup - Overview • Aggregation at ingestion time • Conserve

    disk space • Better compression • Query performance boost
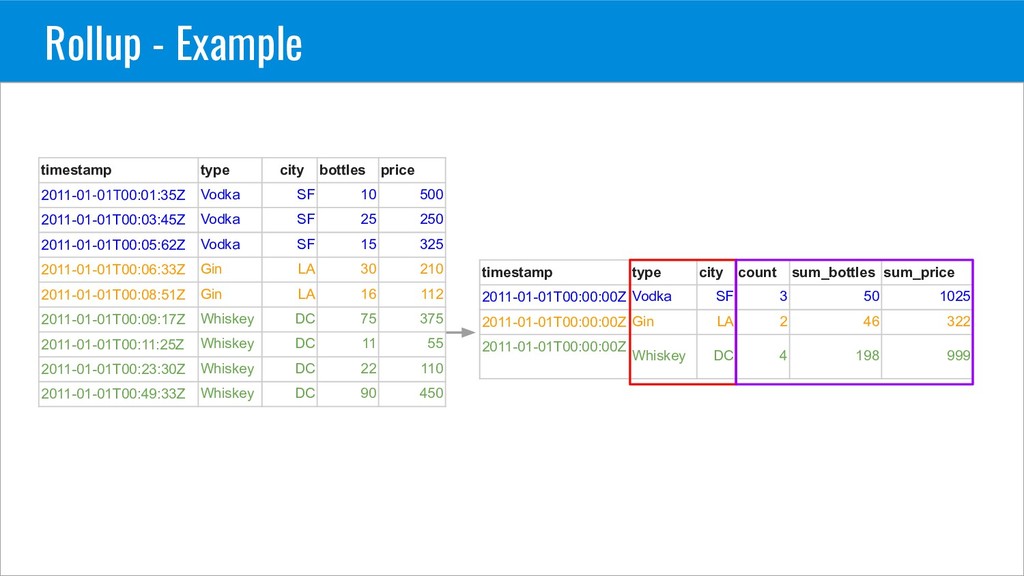
  30. Rollup - Example timestamp type city count sum_bottles sum_price 2011-01-01T00:00:00Z

    Vodka SF 3 50 1025 2011-01-01T00:00:00Z Gin LA 2 46 322 2011-01-01T00:00:00Z Whiskey DC 4 198 999 timestamp type city bottles price 2011-01-01T00:01:35Z Vodka SF 10 500 2011-01-01T00:03:45Z Vodka SF 25 250 2011-01-01T00:05:62Z Vodka SF 15 325 2011-01-01T00:06:33Z Gin LA 30 210 2011-01-01T00:08:51Z Gin LA 16 112 2011-01-01T00:09:17Z Whiskey DC 75 375 2011-01-01T00:11:25Z Whiskey DC 11 55 2011-01-01T00:23:30Z Whiskey DC 22 110 2011-01-01T00:49:33Z Whiskey DC 90 450
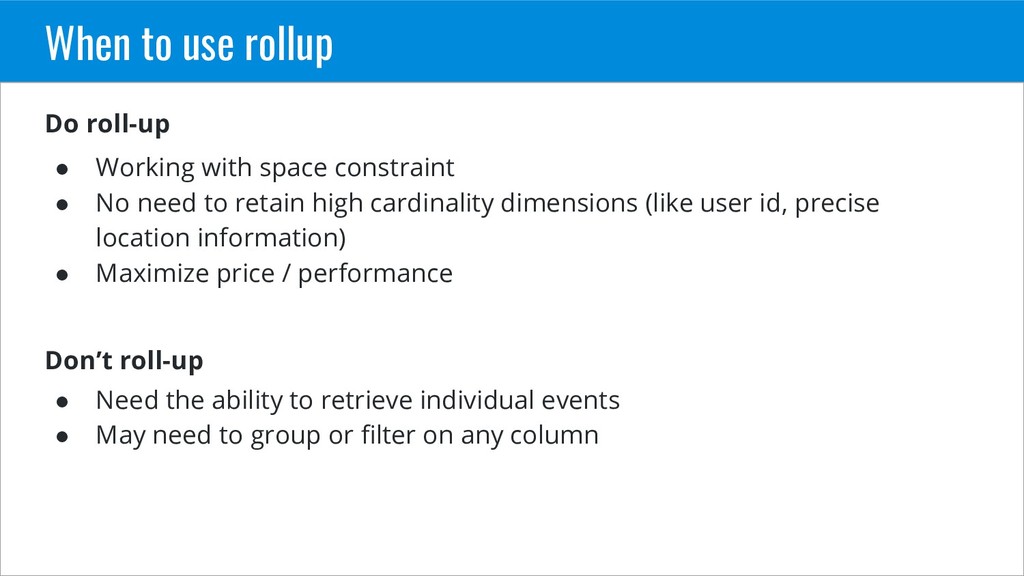
  31. When to use rollup Do roll-up • Working with space

    constraint • No need to retain high cardinality dimensions (like user id, precise location information) • Maximize price / performance Don’t roll-up • Need the ability to retrieve individual events • May need to group or filter on any column

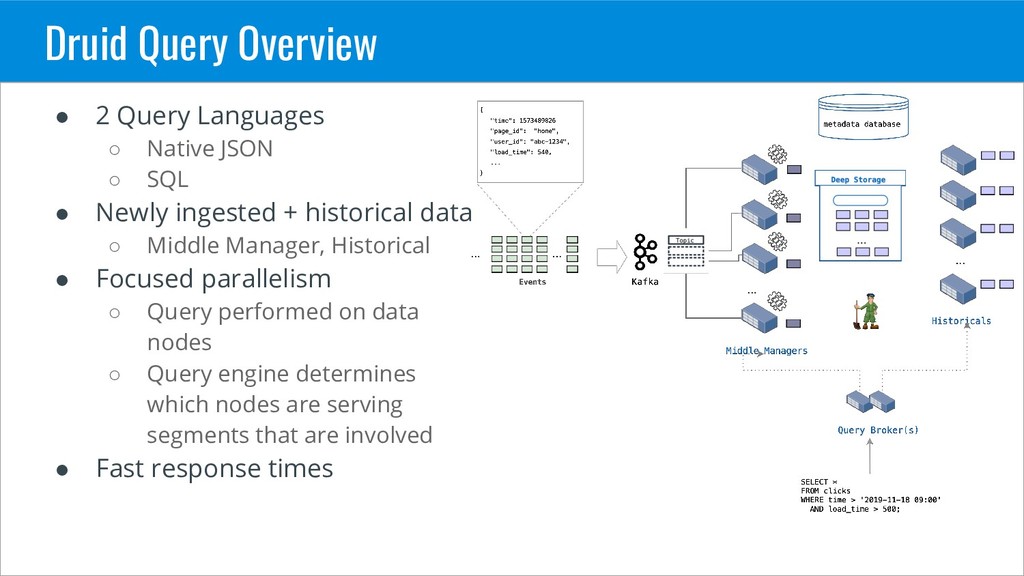
  32. Druid Query Overview • 2 Query Languages ◦ Native JSON

    ◦ SQL • Newly ingested + historical data ◦ Middle Manager, Historical • Focused parallelism ◦ Query performed on data nodes ◦ Query engine determines which nodes are serving segments that are involved • Fast response times
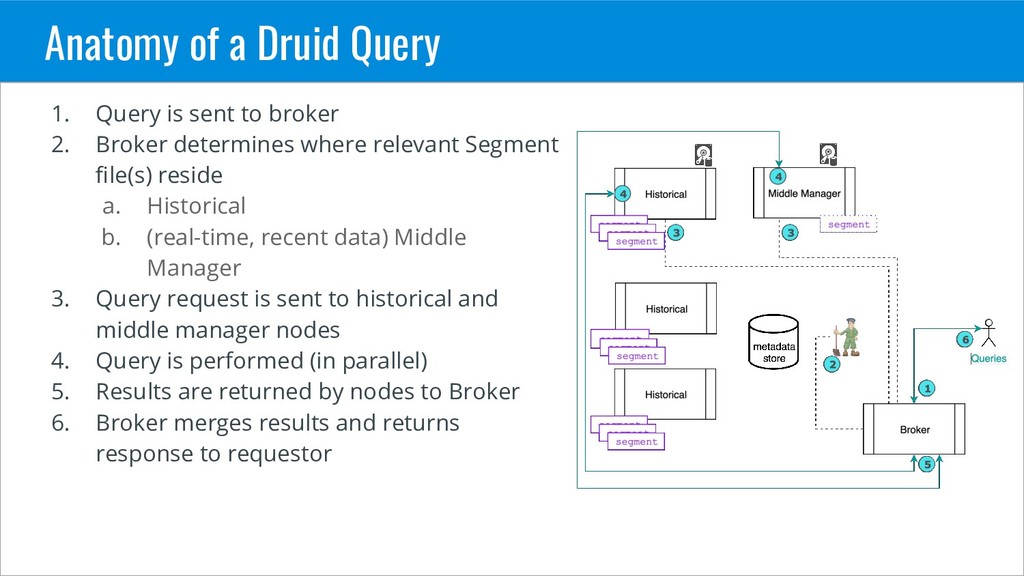
  33. Anatomy of a Druid Query 1. Query is sent to

    broker 2. Broker determines where relevant Segment file(s) reside a. Historical b. (real-time, recent data) Middle Manager 3. Query request is sent to historical and middle manager nodes 4. Query is performed (in parallel) 5. Results are returned by nodes to Broker 6. Broker merges results and returns response to requestor
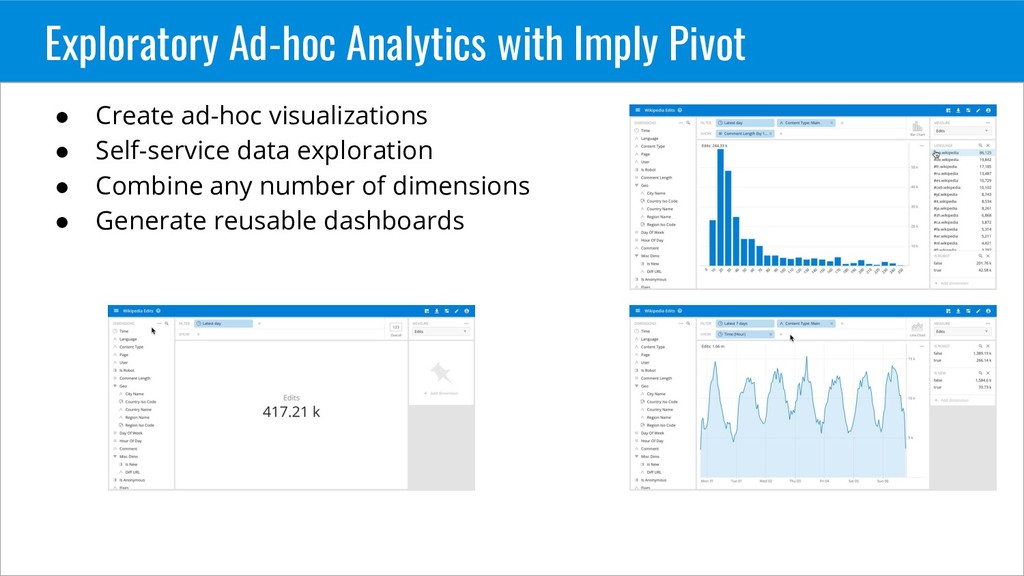
  34. Exploratory Ad-hoc Analytics with Imply Pivot • Create ad-hoc visualizations

    • Self-service data exploration • Combine any number of dimensions • Generate reusable dashboards
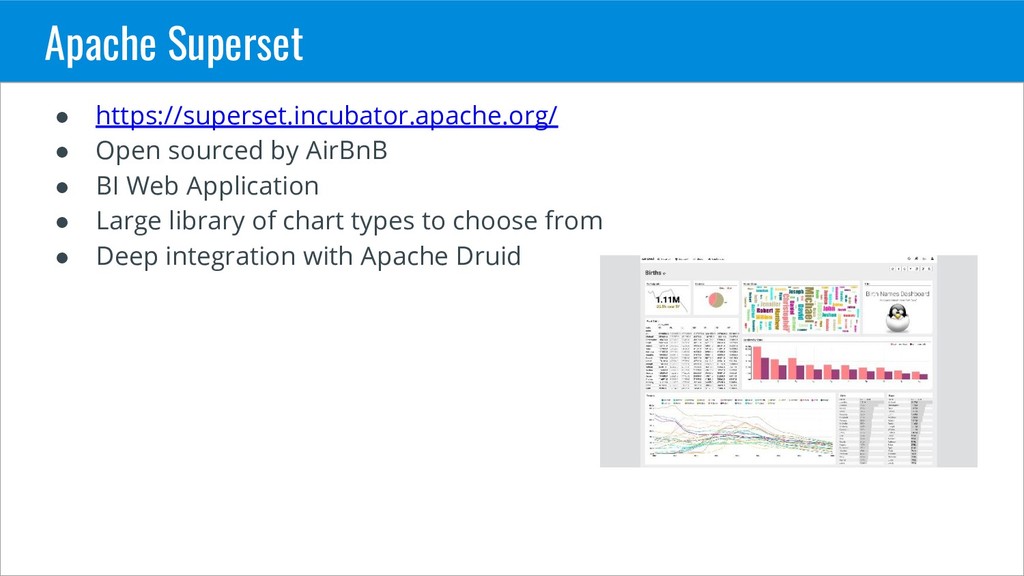
  35. Apache Superset • https://superset.incubator.apache.org/ • Open sourced by AirBnB •

    BI Web Application • Large library of chart types to choose from • Deep integration with Apache Druid
  36. Other BI Tools: Tableau, Looker, Qlik, etc. • Native Integrations

    (e.g., Looker) • JDBC integration (e.g., Tableau, Qlik)
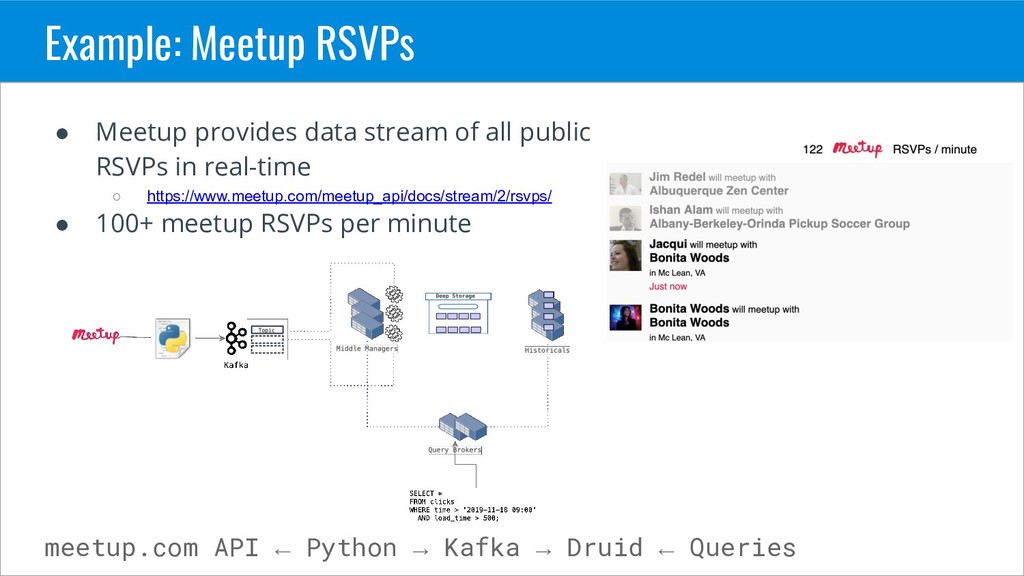
  37. Example: Meetup RSVPs • Meetup provides data stream of all

    public RSVPs in real-time ◦ https://www.meetup.com/meetup_api/docs/stream/2/rsvps/ • 100+ meetup RSVPs per minute meetup.com API ← Python → Kafka → Druid ← Queries
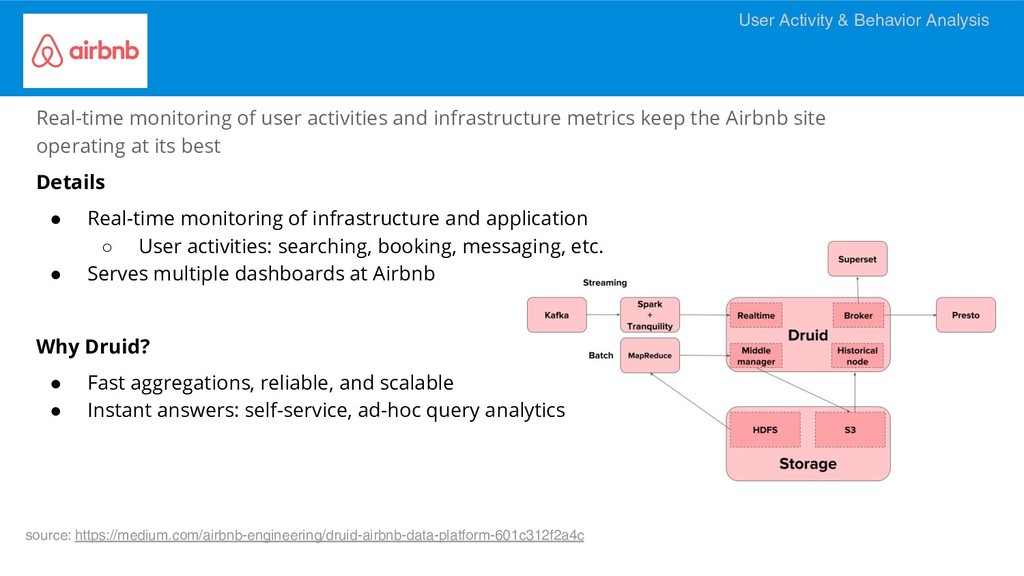
  38. Real-time monitoring of user activities and infrastructure metrics keep the

    Airbnb site operating at its best Details • Real-time monitoring of infrastructure and application ◦ User activities: searching, booking, messaging, etc. • Serves multiple dashboards at Airbnb Why Druid? • Fast aggregations, reliable, and scalable • Instant answers: self-service, ad-hoc query analytics User Activity & Behavior Analysis source: https://medium.com/airbnb-engineering/druid-airbnb-data-platform-601c312f2a4c
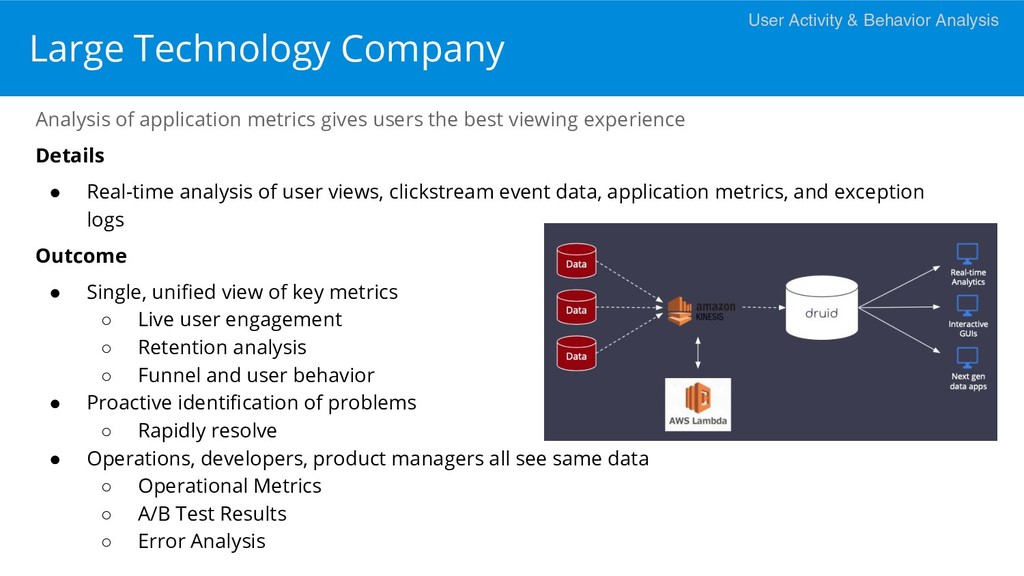
  39. Large Technology Company Analysis of application metrics gives users the

    best viewing experience Details • Real-time analysis of user views, clickstream event data, application metrics, and exception logs Outcome • Single, unified view of key metrics ◦ Live user engagement ◦ Retention analysis ◦ Funnel and user behavior • Proactive identification of problems ◦ Rapidly resolve • Operations, developers, product managers all see same data ◦ Operational Metrics ◦ A/B Test Results ◦ Error Analysis User Activity & Behavior Analysis
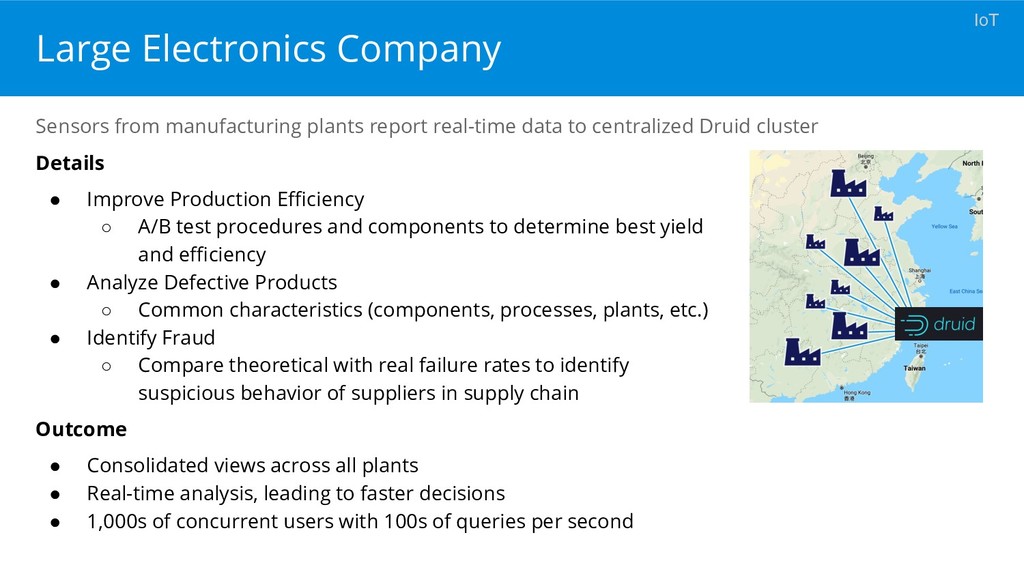
  40. Large Electronics Company Sensors from manufacturing plants report real-time data

    to centralized Druid cluster Details • Improve Production Efficiency ◦ A/B test procedures and components to determine best yield and efficiency • Analyze Defective Products ◦ Common characteristics (components, processes, plants, etc.) • Identify Fraud ◦ Compare theoretical with real failure rates to identify suspicious behavior of suppliers in supply chain Outcome • Consolidated views across all plants • Real-time analysis, leading to faster decisions • 1,000s of concurrent users with 100s of queries per second IoT
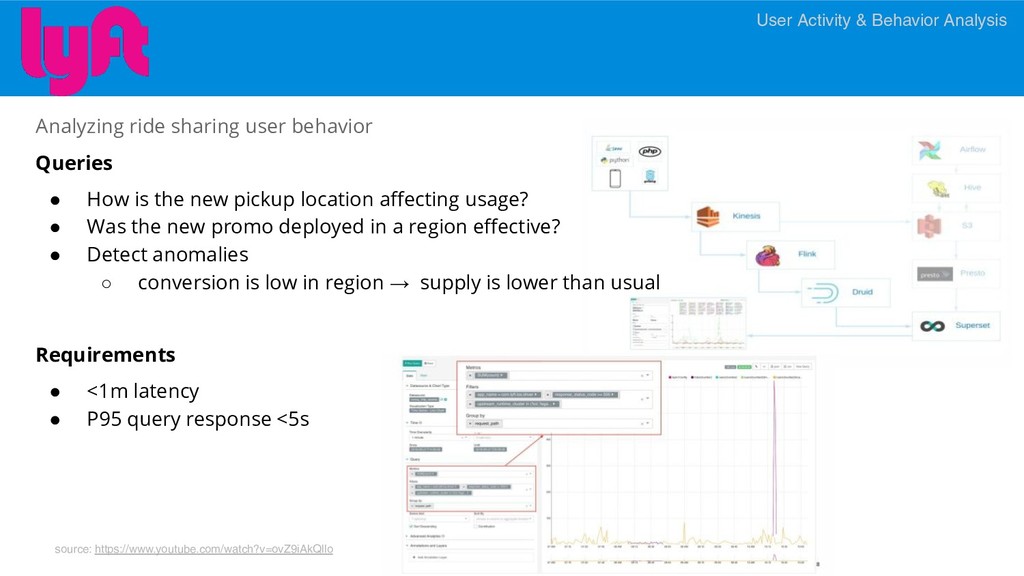
  41. Analyzing ride sharing user behavior Queries • How is the

    new pickup location affecting usage? • Was the new promo deployed in a region effective? • Detect anomalies ◦ conversion is low in region → supply is lower than usual Requirements • <1m latency • P95 query response <5s User Activity & Behavior Analysis source: https://www.youtube.com/watch?v=ovZ9iAkQllo
  42. Getting Started • Download Imply distribution from https://imply.io/get-started ◦ 30

    day free trial of Imply Manager, Alert Manager, and Pivot • Download open source distribution from https://druid.apache.org
  43. Quick Survey - $50 Amazon Gift Card! Fill out this

    quick survey to enter a drawing for a $50 Amazon gift card. https://bit.ly/2NpqtXG