$30 off During Our Annual Pro Sale. View Details »

R - Python ID Meetup, Feb 2015

R - Python ID Meetup, Feb 2015

Okiriza Wibisono

February 21, 2015
Tweet

Other Decks in Programming

Transcript

  1. R
    Data Mining 101
    Python ID Meetup, February 2015
    @aliakbars / @okiriza

    View Slide

  2. R: What Is It?
    A statistical programming language
    • Free 
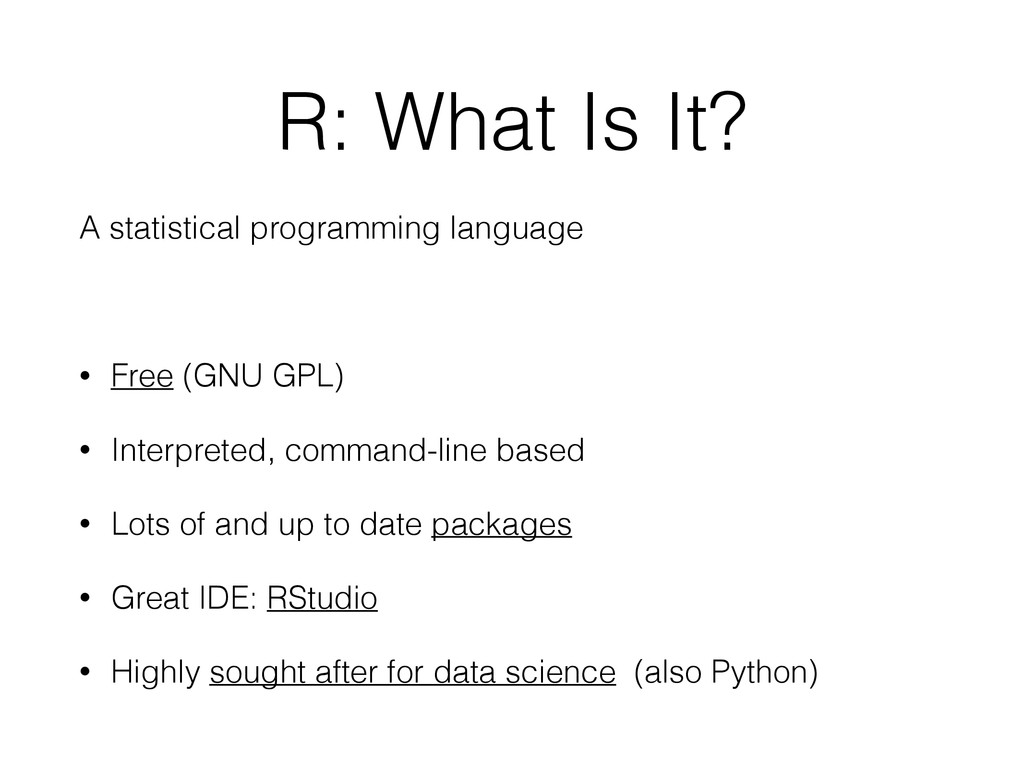
(GNU GPL)
    • Interpreted, command-line based
    • Lots of and up to date packages
    • Great IDE: RStudio
    • Highly sought after for data science (also Python)

    View Slide

  3. First Look

    View Slide

  4. Slight Catch:
    Vectorised Operations
    Python
    A = range(1, 6)
    B 
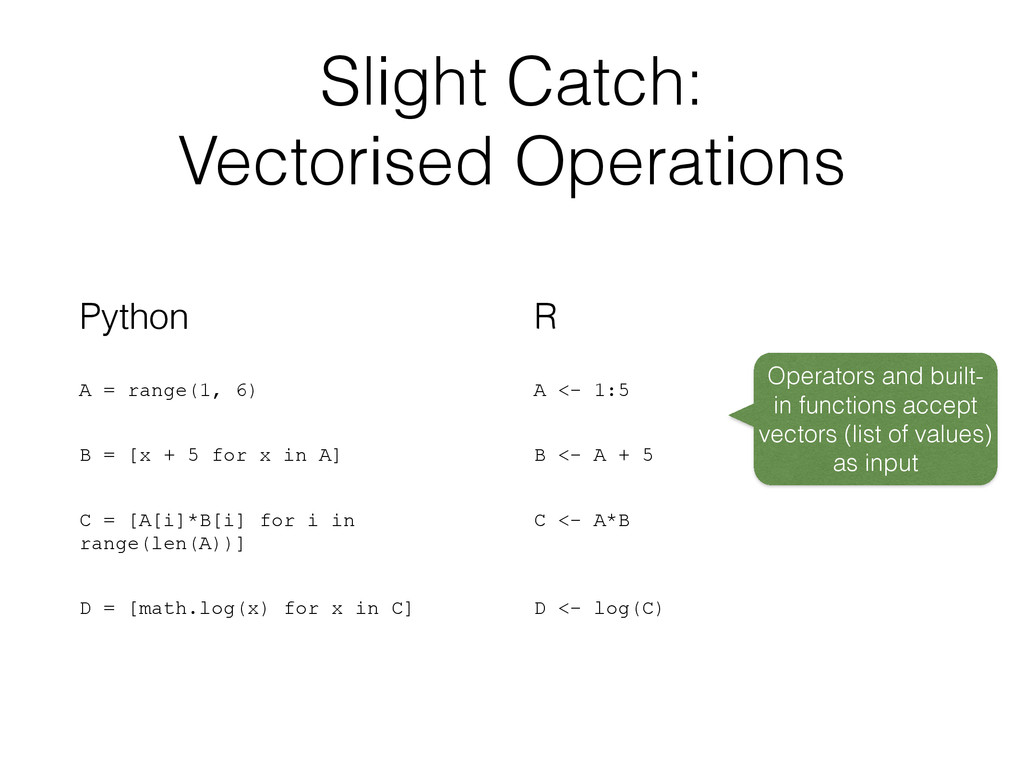
= [x + 5 for x in A]
    C = [A[i]*B[i] for i in
    range(len(A))]
    D = [math.log(x) for x in C]
    R
    A <- 1:5
    B <- A + 5
    C <- A*B

    D <- log(C)
    Operators and built-
    in functions accept
    vectors (list of values)
    as input

    View Slide

  5. Our Data Set
    • 13k + 4k rows (records) of 
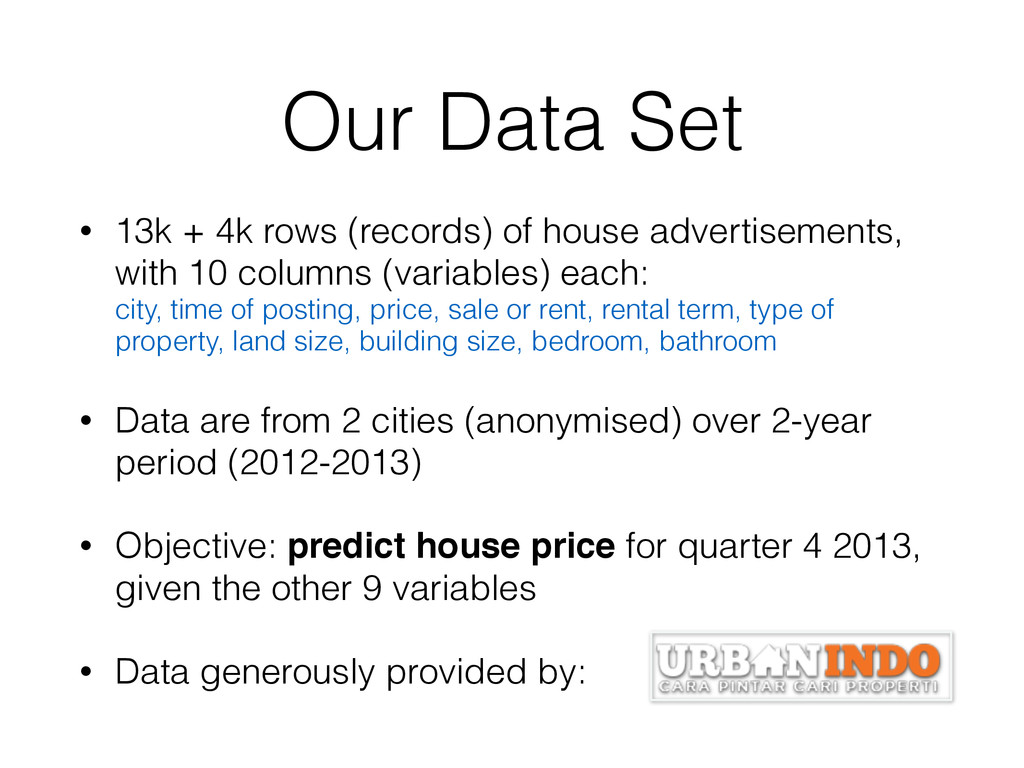
house advertisements,
    with 10 columns (variables) each:

    city, time of posting, price, sale or rent, rental term, type of
    property, land size, building size, bedroom, bathroom
    • Data are from 2 cities (anonymised) over 2-year
    period (2012-2013)
    • Objective: predict house price for quarter 4 2013,
    given the other 9 variables
    • Data generously provided by:

    View Slide

  6. Data Understanding:
    Summary Statistics
    Perhaps
    too detail?
    Need to
    cleanup
    price
    -1 bedroom
    (and bathroom)?
    Are we going to
    analyse rent?

    View Slide

  7. Data Understanding:
    Plots
    Sometimes
    need to clean data
    for exploration
    Extremely skewed
    histogram, obvious
    sign of outliers
    More than 1 trillion
    rupiahs for a house?

    View Slide

  8. Data Preparation:
    Removing Rows and Columns
    Retain only sale
    properties (not rent)
    Remove
    irrelevant columns

    View Slide

  9. Data Preparation:
    Feature Engineering
    Introduce
    month column
    Introduce
    quarter column
    Introduce
    year column
    Set them as
    categories
    (not numeric)

    View Slide

  10. Data Preparation:
    Handling Outliers
    Remove the outliers
    CAUTION: In practice
    outliers may actually
    be valid data, so
    need to handle /
    remove them with
    great care.
    600 rows removed

    View Slide

  11. Data Cleaning:
    Data Splitting
    Define data splitting
    and split the data

    View Slide

  12. Modeling:
    Simple Linear Regression
    Define model formula
    and build model
    Overall model fit e.g.
    coefficient, p-value,
    model diagnostics
    Evaluate on
    validation set

    View Slide

  13. Modeling:
    Multiple Regression
    RMSE smaller by
    >60 million rupiahs
    New model with year
    and quarter variables

    View Slide

  14. Before Tapping into Test Data
    • Need to explore and 
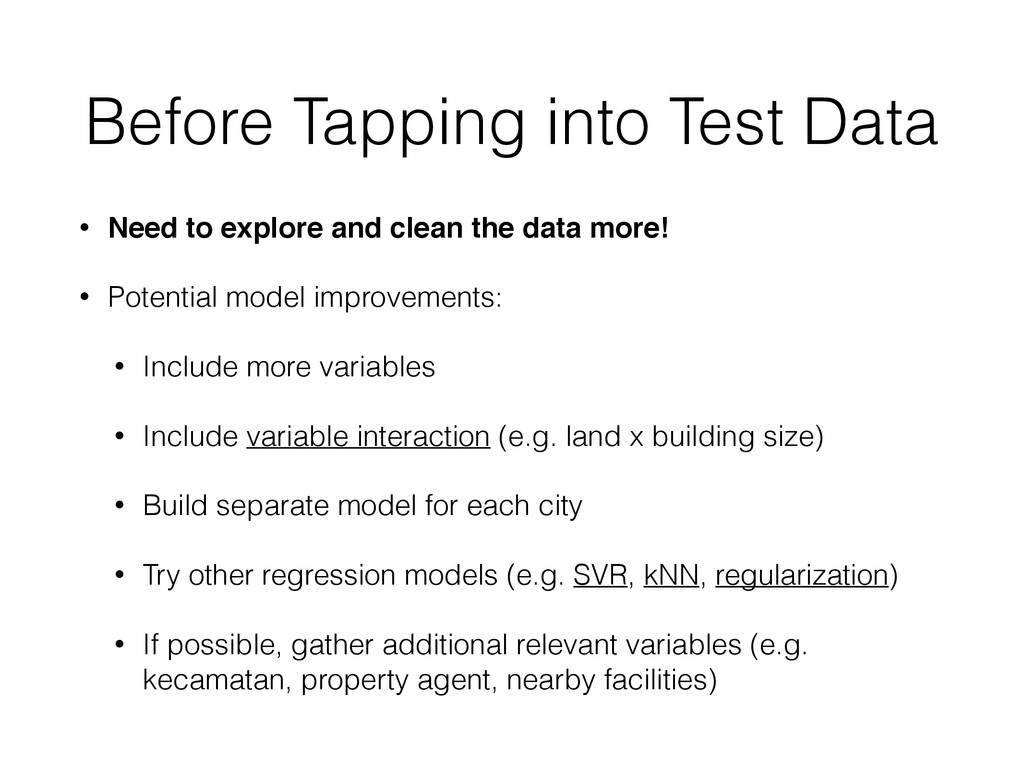
clean the data more!
    • Potential model improvements:
    • Include more variables
    • Include variable interaction (e.g. land x building size)
    • Build separate model for each city
    • Try other regression models (e.g. SVR, kNN, regularization)
    • If possible, gather additional relevant variables (e.g.
    kecamatan, property agent, nearby facilities)

    View Slide

  15. No Turning Back:
    Evaluation
    Predict on test data
    Fit final model with
    all training data

    View Slide

  16. What We Did:
    Aligning with CRISP DM
    1. No data 
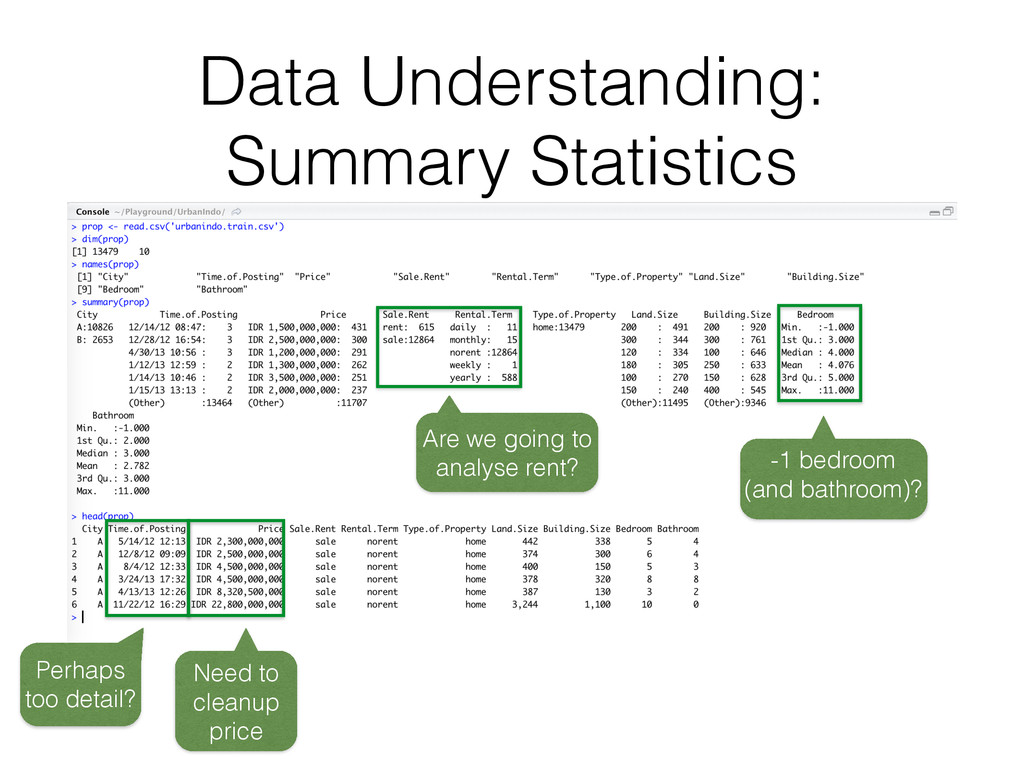
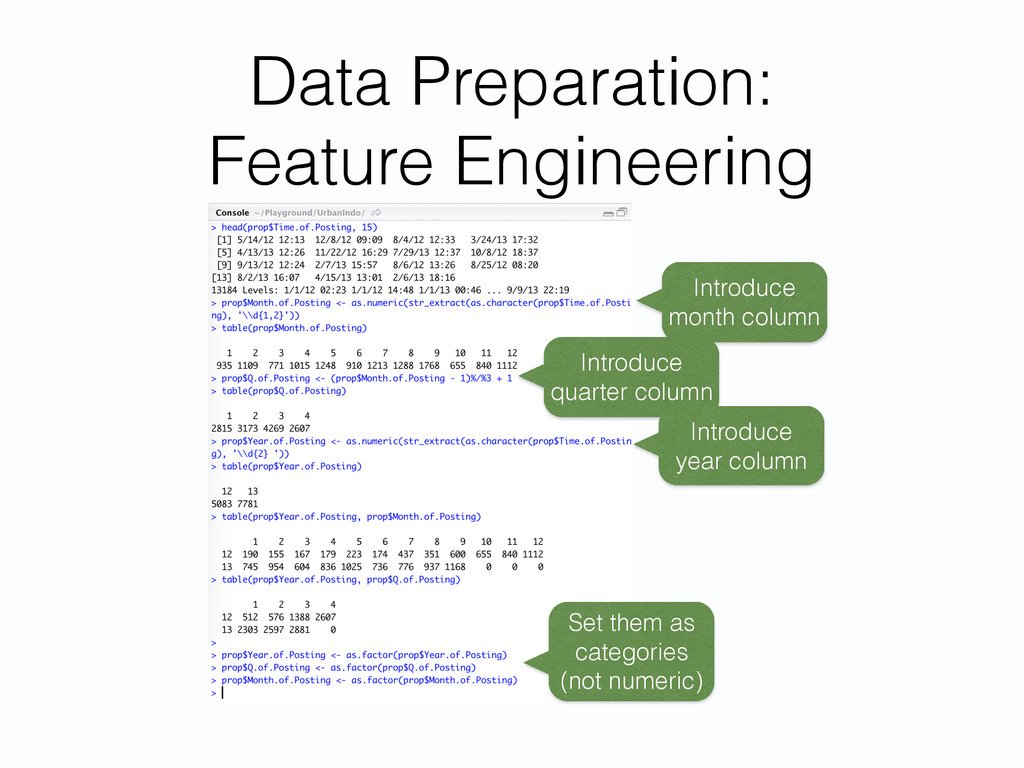
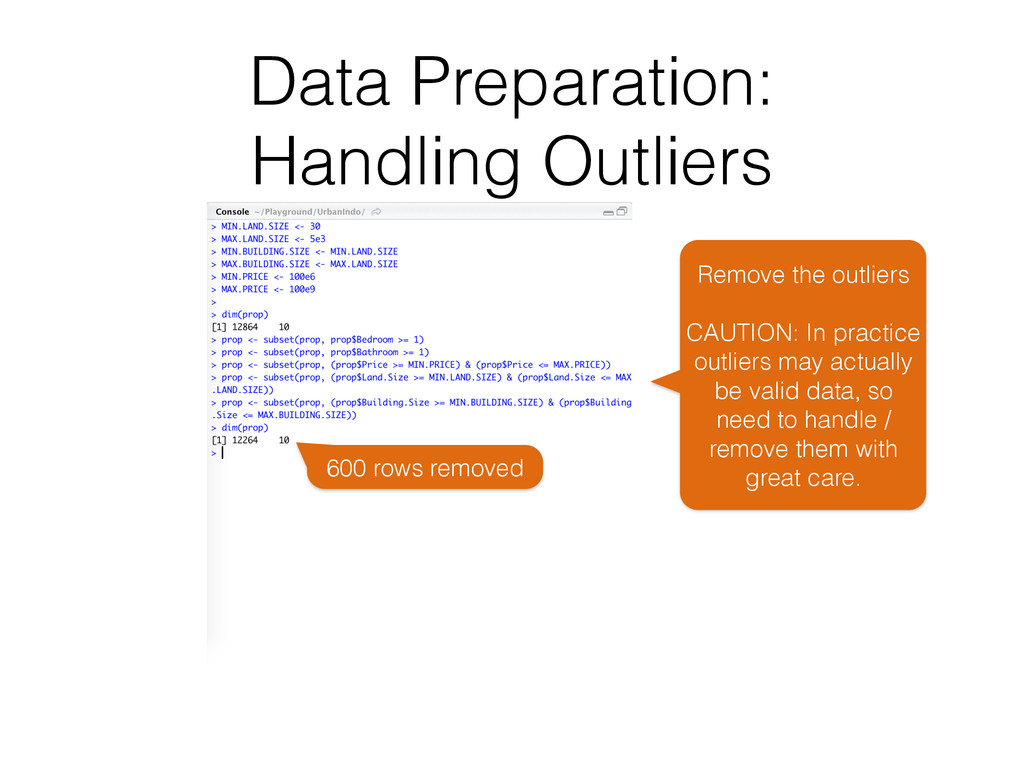
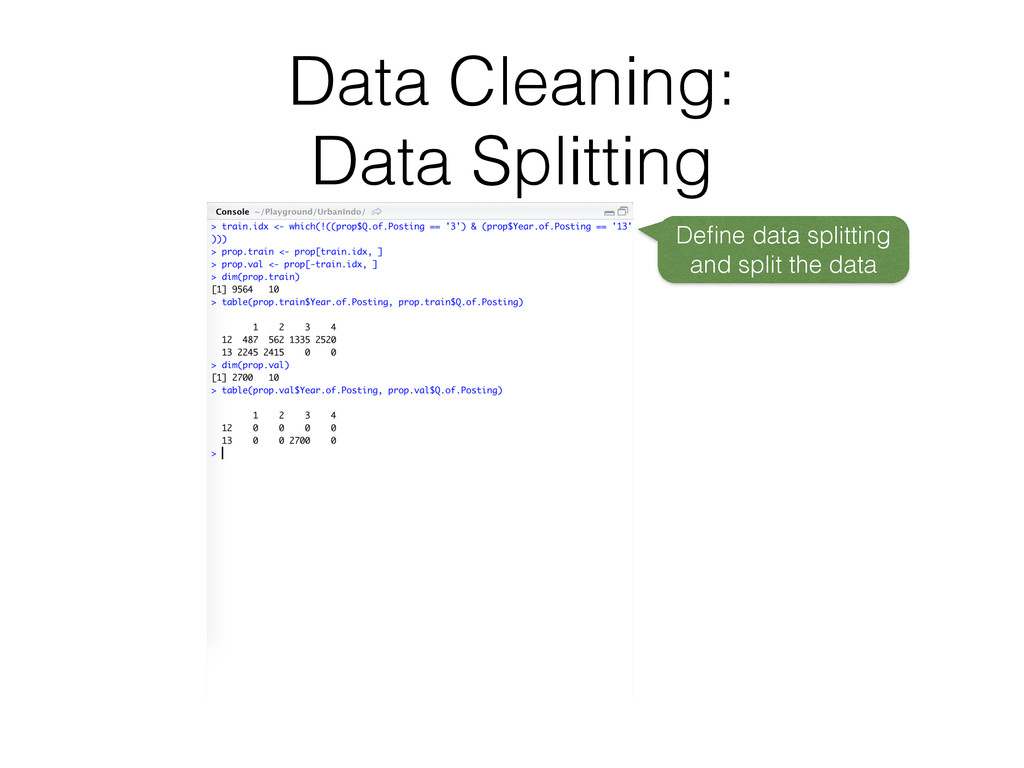
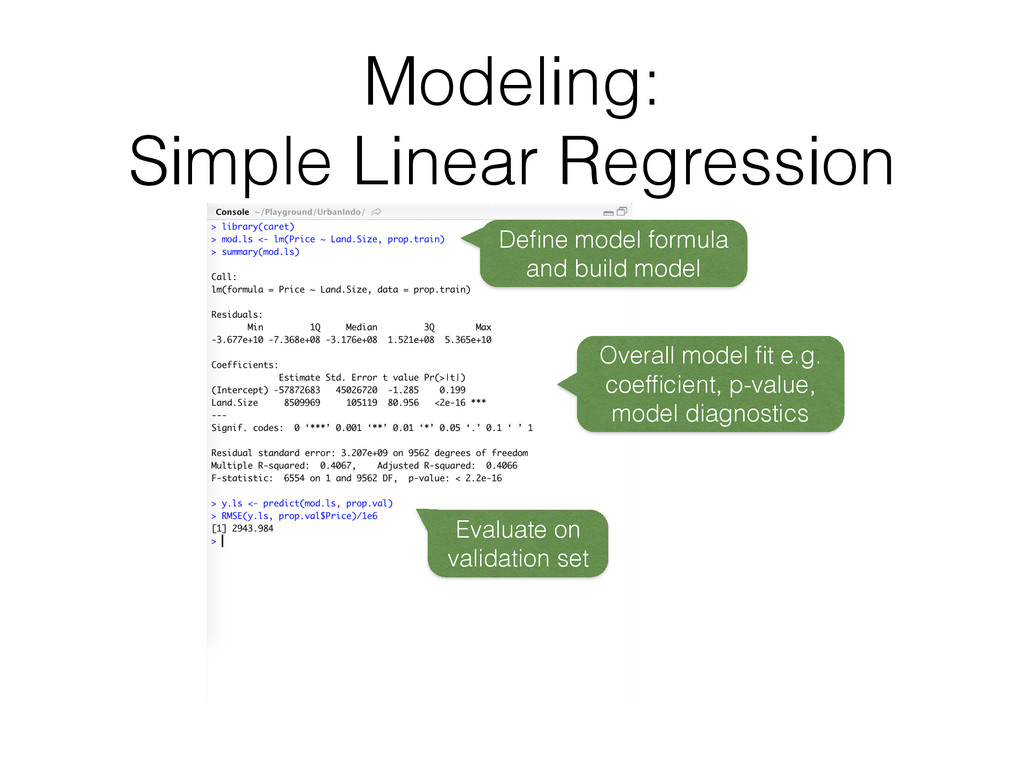
collection nor business understanding
    2. Data understanding

    summary statistics, plotting
    3. Data preparation

    excluding data, feature engineering, outlier handling, data splitting
    4. Modeling

    simple linear regression, multiple regression, model validation
    5. Evaluation

    View Slide

  17. Where to Learn R
    • Coursera’s Data Science specialization (no need to pay)
    • R-bloggers
    • stackoverflow.com, stats.stackexchange.com
    • Books: R for Everyone, The Art of R Programming

    View Slide

  18. Python vs R
    for Data Analysis
    Python

    + numpy + scipy + pandas + scikit-learn
    • Faster
    • More programming features
    • Better for production
    R

    • More statistical communities
    • More statistical libraries
    • Better for visualisation /
    reporting

    quora.com/Which-­‐is-­‐be1er-­‐for-­‐data-­‐analysis-­‐R-­‐or-­‐Python  
    blog.udacity.com/2015/01/python-­‐vs-­‐r-­‐learn-­‐first.html

    View Slide