Upgrade to Pro — share decks privately, control downloads, hide ads and more …

Trace by RisingStack - Monitoring Microservices

Sponsored · Your Podcast. Everywhere. Effortlessly. Share. Educate. Inspire. Entertain. You do you. We'll handle the rest. →

Trace by RisingStack - Monitoring Microservices

Trace is a visualised stack trace platform designed for microservice monitoring.

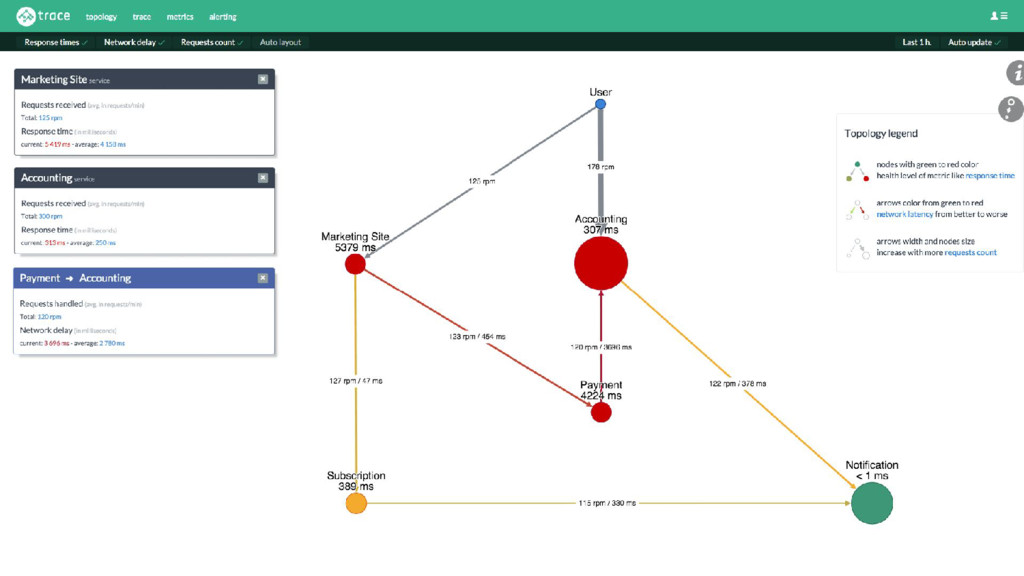
Topology view of your services to better understand and track how your applications communicate with each other. Trace also helps to detect issues like increased network latency in your microservice architecture.

Trace view to have distributed stack-trace across your architecture. You can immediately localise the issue and see what’s the problem instead of spending a lot of time to figure out what’s wrong.

Advanced alerting about connections, process times and other changes in your microservice architecture. You’ll never miss an important change in your applications.

Avatar for RisingStack

RisingStack

January 29, 2016

Other Decks in Technology

Transcript

  1. $ whoami Work - RisingStack Twitter - @nthgergo GitHub -

    gergelyke Stuff I write - https://blog.risingstack.com
  2. A microservice monitoring and debugging tool that empowers you to

    get all the metrics you need when operating microservices. Get Trace
  3. The microservice pattern is not the silver bullet for designing

    systems - it helps a lot, but also comes with new challenges. Monitoring microservices
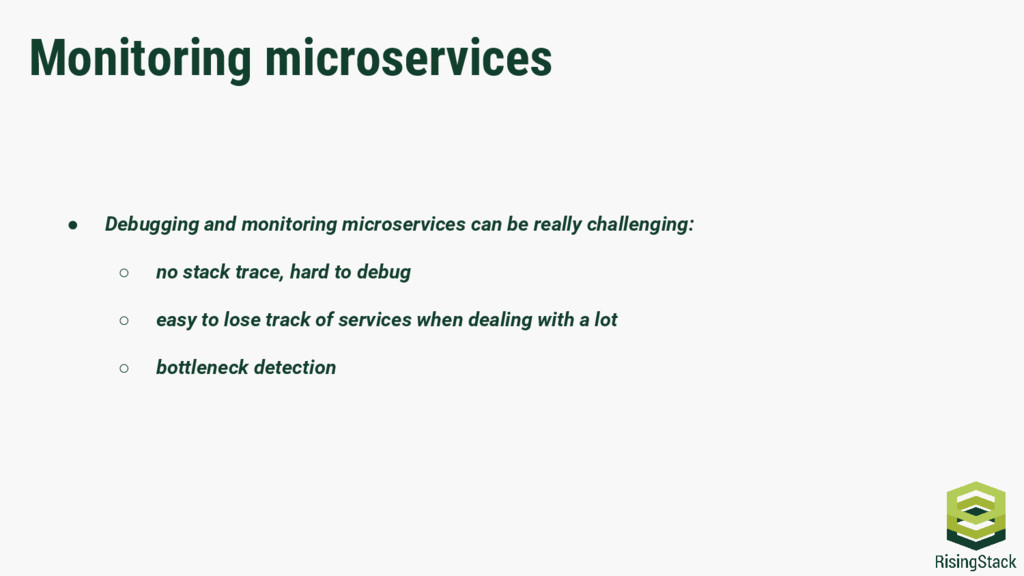
  4. • Debugging and monitoring microservices can be really challenging: ◦

    no stack trace, hard to debug ◦ easy to lose track of services when dealing with a lot ◦ bottleneck detection Monitoring microservices
  5. • Trace solves these problems by adding the ability to

    ◦ do distributed stack traces, ◦ topology view for your services, ◦ and alerting for overwhelmed services, ◦ third-party service monitoring (coming soon), ◦ trace heterogeneous infrastructures with languages like Java, PHP or Ruby (coming soon). Monitoring microservices
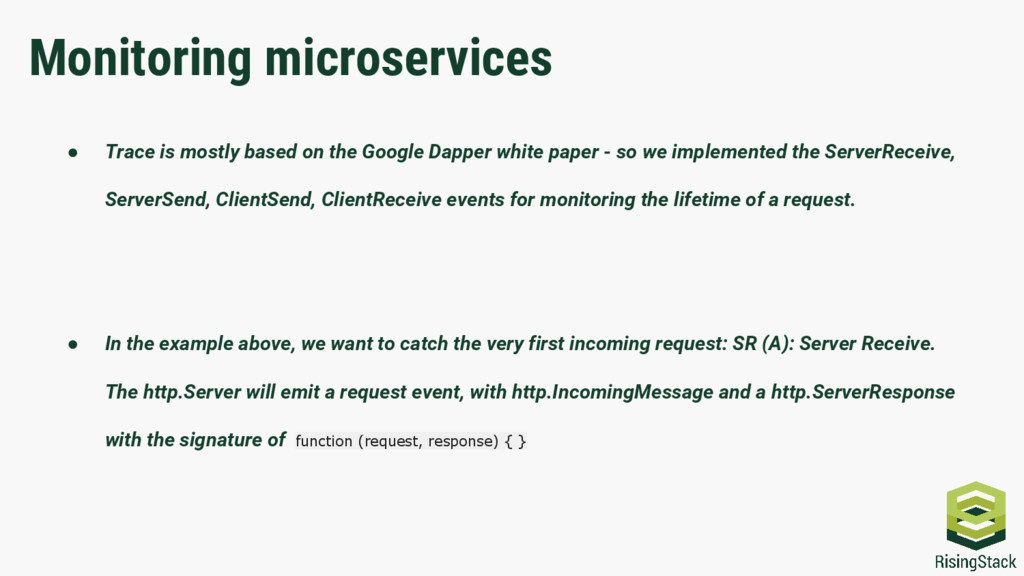
  6. • Trace is mostly based on the Google Dapper white

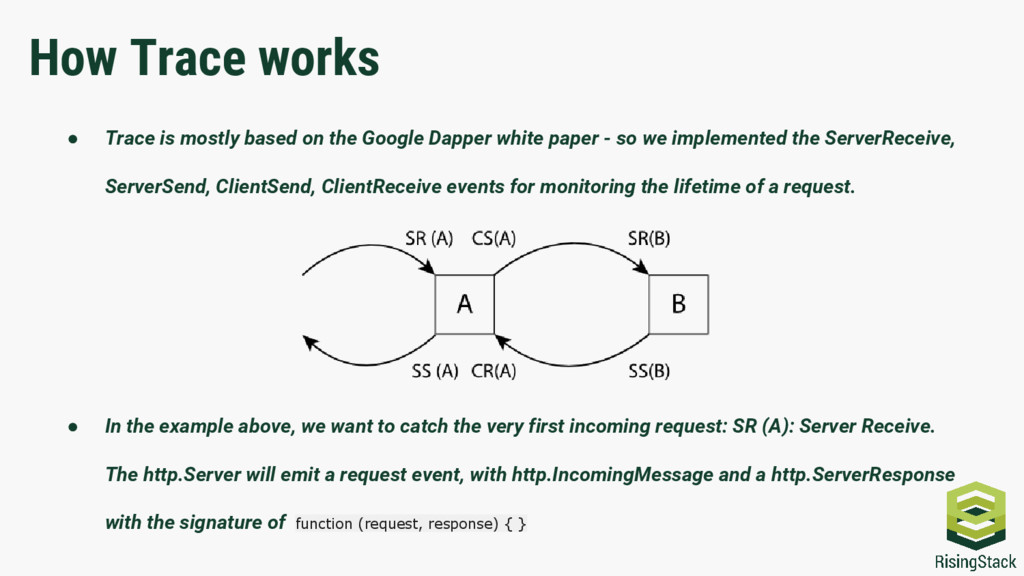
    paper - so we implemented the ServerReceive, ServerSend, ClientSend, ClientReceive events for monitoring the lifetime of a request. • In the example above, we want to catch the very first incoming request: SR (A): Server Receive. The http.Server will emit a request event, with http.IncomingMessage and a http.ServerResponse with the signature of function (request, response) { } Monitoring microservices
  7. With wrapping the http core module's request function and the

    Server.prototype object, we can sniff all the information we need. How Trace works
  8. Trace is mostly based on the Google Dapper white paper

    - so we implemented the ServerReceive, ServerSend, ClientSend, ClientReceive events for monitoring the lifetime of a request. How Trace works
  9. How Trace works • Trace is mostly based on the

    Google Dapper white paper - so we implemented the ServerReceive, ServerSend, ClientSend, ClientReceive events for monitoring the lifetime of a request. • In the example above, we want to catch the very first incoming request: SR (A): Server Receive. The http.Server will emit a request event, with http.IncomingMessage and a http.ServerResponse with the signature of function (request, response) { }
  10. In the wrapper, we can record every information we want,

    like timing, the source, the requested path, or even the whole HTTP header for further investigation. How Trace works
  11. We do it by setting a request-id header on the

    outgoing requests. Transaction tracking
  12. • If our service has to call another service before

    it can send the response to its caller, we have to track this kind of request-response pairs, spans as well. A span always comes from http.request by calling an endpoint. By wrapping the http.request function, we can do the same as in the http. Server.prototype with one minor difference: here we want to pair the corresponding request and response, and assign a span-id to it. Transaction tracking
  13. • However, the request-id will just pass through the span.

    In order to store the generated request-id, we use Continuation-Local Storage: after a request arrived and we generated the request-id, we store it in CLS, so when we try to call another service we can just get it back. Transaction tracking
  14. • Trace is completely open source - feel free to

    play with it, open issues, send pull requests. We will soon start to implement Trace to other languages as well - if you'd like to participate, say hi, and let's get working on them! Getting started
  15. • Trace is also available as a hosted service. If

    you don't want run your own infrastructure we provide microservice monitoring as a service as well. This is what it looks like: Getting started