Automatically detecting anomalies and their causes in business-metric time-series. A fairly simple and configurable anomaly detection method that adjusts quickly to changing distributions.
care about web data of people who want to buy clothes … so we care about customer origin data and show them clothes they can buy … so we care about customer browsing habits and we get commission. so we care about order data
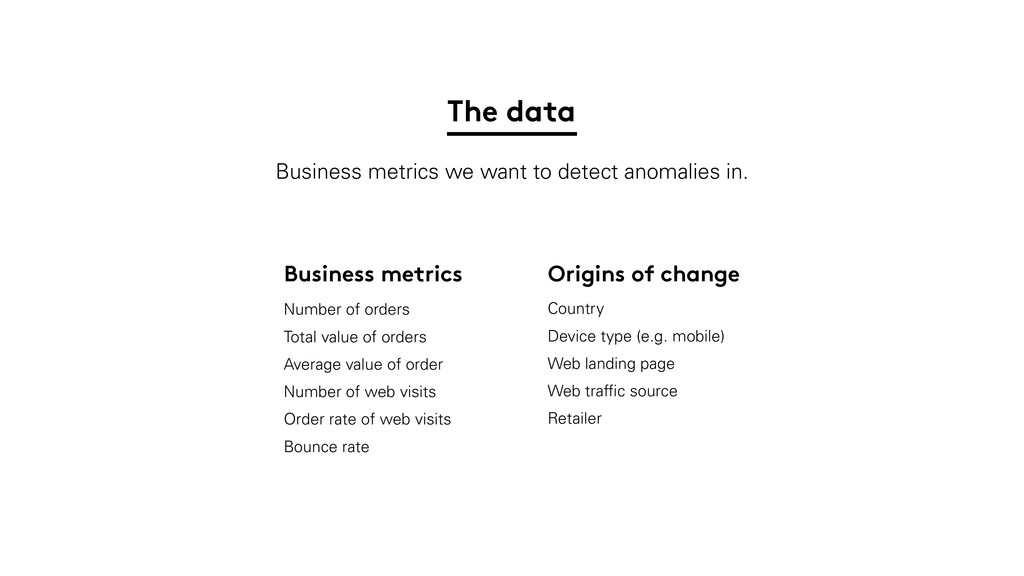
orders Average value of order Number of web visits Order rate of web visits Bounce rate Business metrics we want to detect anomalies in. Origins of change Country Device type (e.g. mobile) Web landing page Web traffic source Retailer
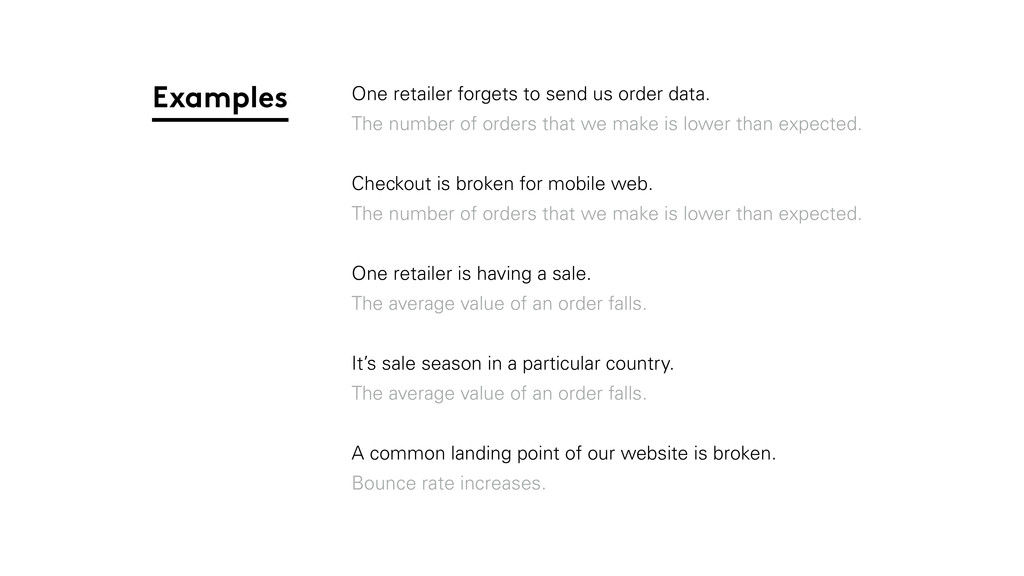
of orders that we make is lower than expected. Checkout is broken for mobile web. The number of orders that we make is lower than expected. One retailer is having a sale. The average value of an order falls. It’s sale season in a particular country. The average value of an order falls. A common landing point of our website is broken. Bounce rate increases. Examples
the algorithm must be robust to slightly dodgy history. Explainability is important so we can’t use super-complicated models. We only care if the current value is anomalous so we don’t need a historic report on all anomalies.
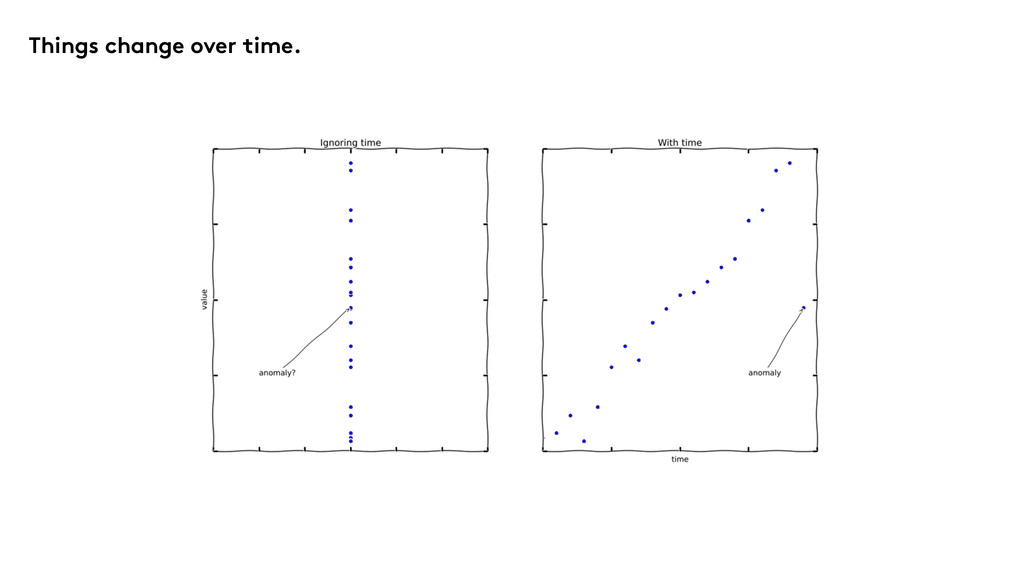
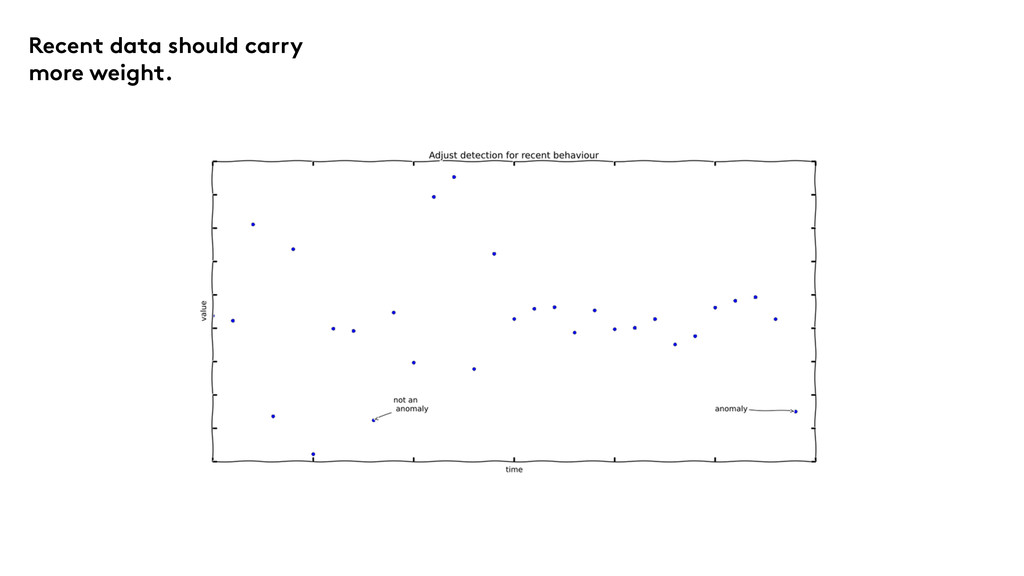
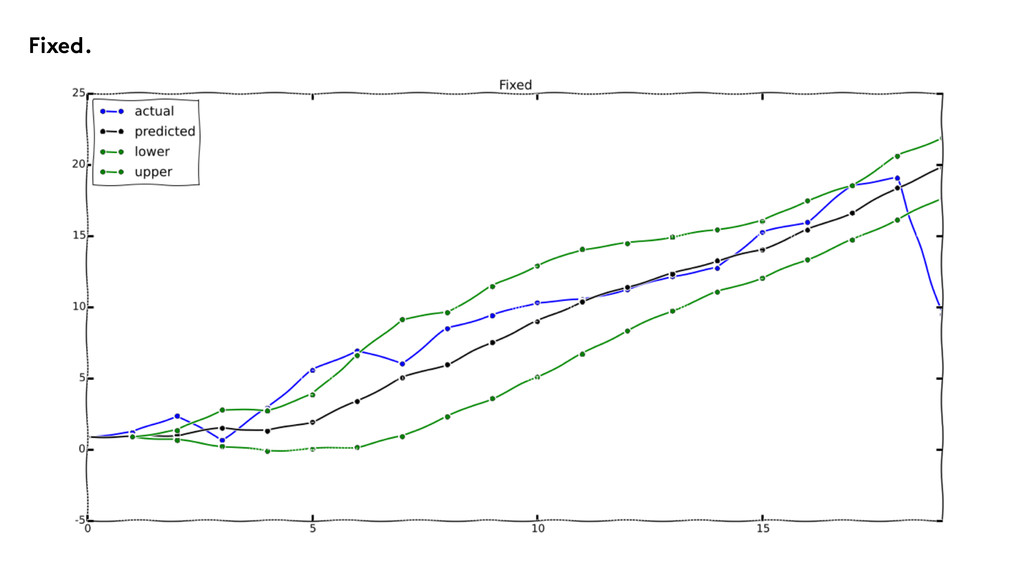
by a significant margin. Our expectation should be more dependent on the recent past than the whole history. Our definition of significant should be more dependent on the recent past than the whole history. So what is an anomaly again?
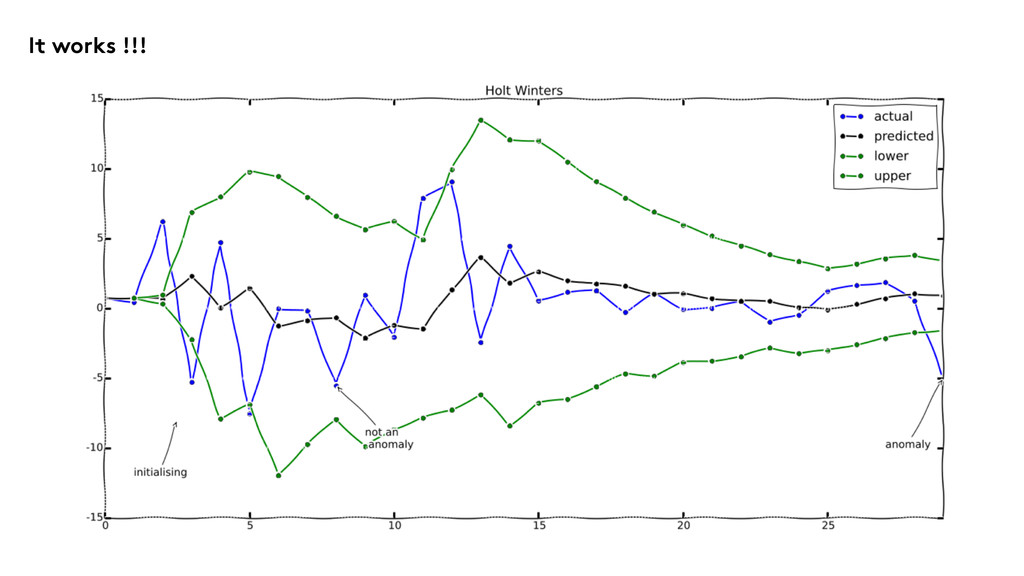
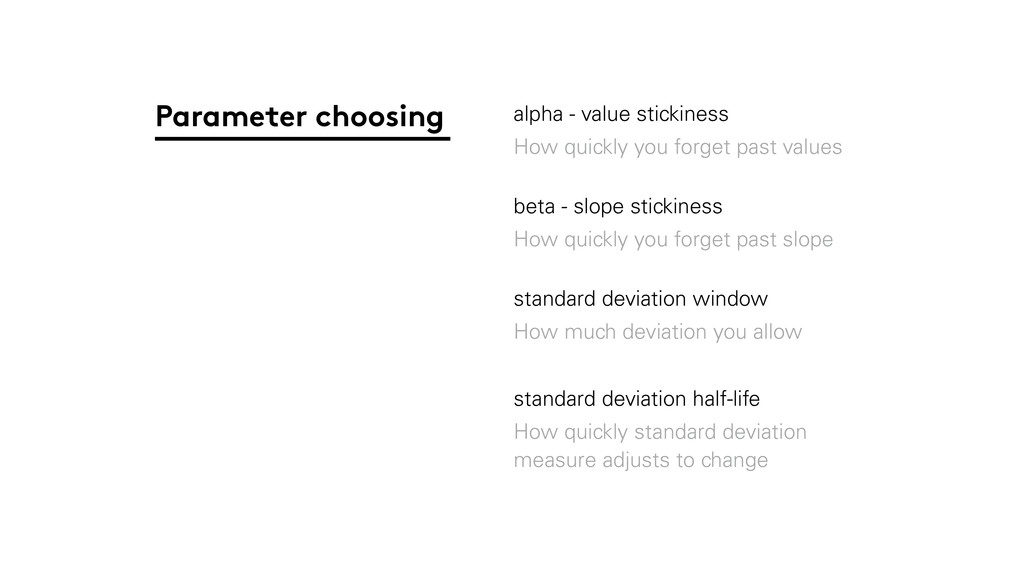
This takes all the past into account, but weights the most recent past as more predictive. This is called Holt method, or sometimes Holt-Winters method (definitions vary). Choose alpha between 0 and 1. Lower values of alpha adapt to changes slower, so lead to more stable predictions, but don’t adapt so quickly to genuine change. Idea
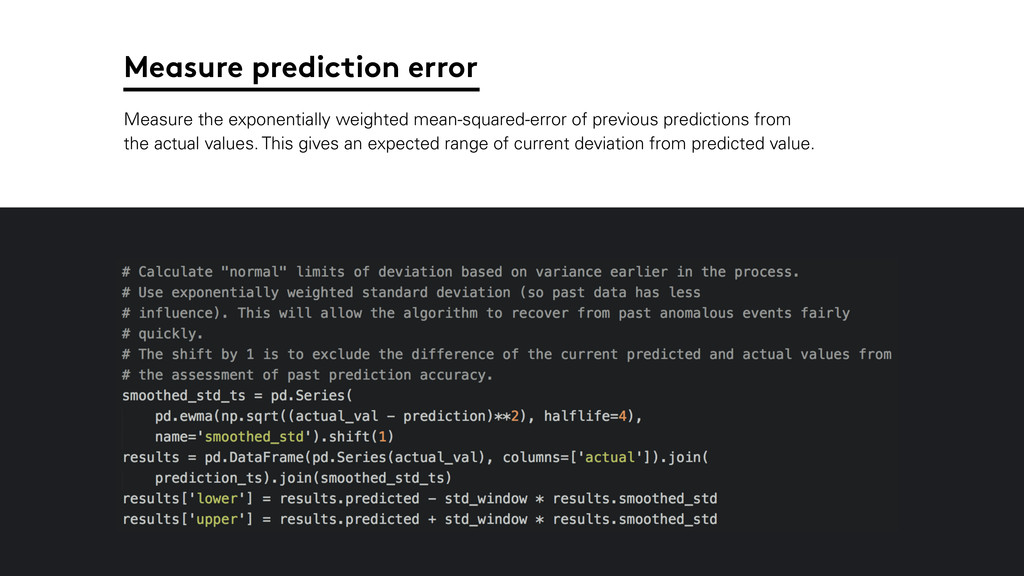
past values beta - slope stickiness How quickly you forget past slope standard deviation window How much deviation you allow standard deviation half-life How quickly standard deviation measure adjusts to change
orders Average value of order Number of web visits Order rate of web visits Bounce rate Business metrics we want to detect anomalies in. Origins of change Country Device type (e.g. mobile) Web landing page Web traffic source Retailer
of orders that we make is lower than expected. Checkout is broken for mobile web. The number of orders that we make is lower than expected. One retailer is having a sale. The average value of an order falls. It’s sale season in a particular country. The average value of an order falls. A common landing point of our website is broken. Bounce rate increases. Examples
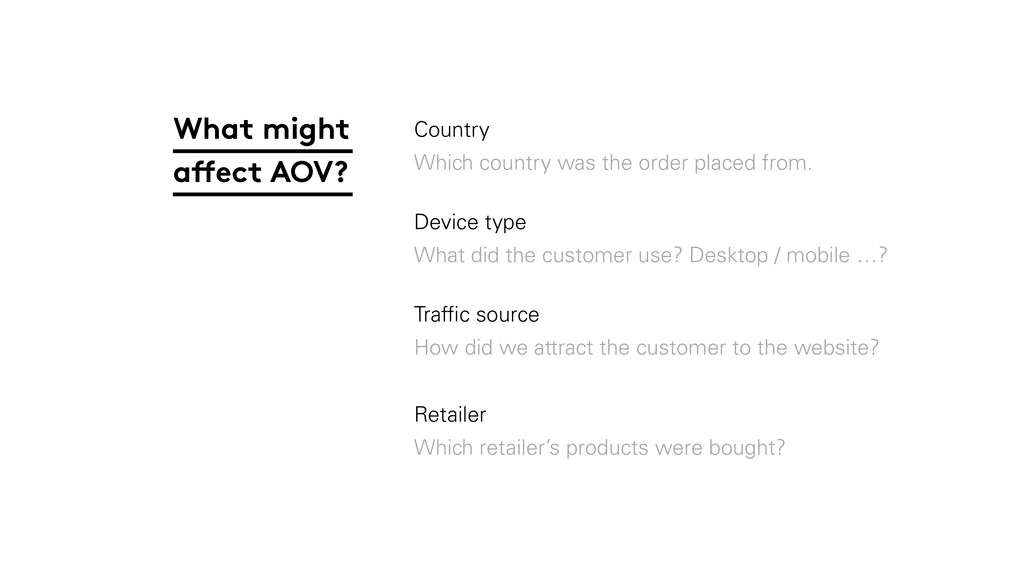
placed from. Device type What did the customer use? Desktop / mobile …? Traffic source How did we attract the customer to the website? Retailer Which retailer’s products were bought?
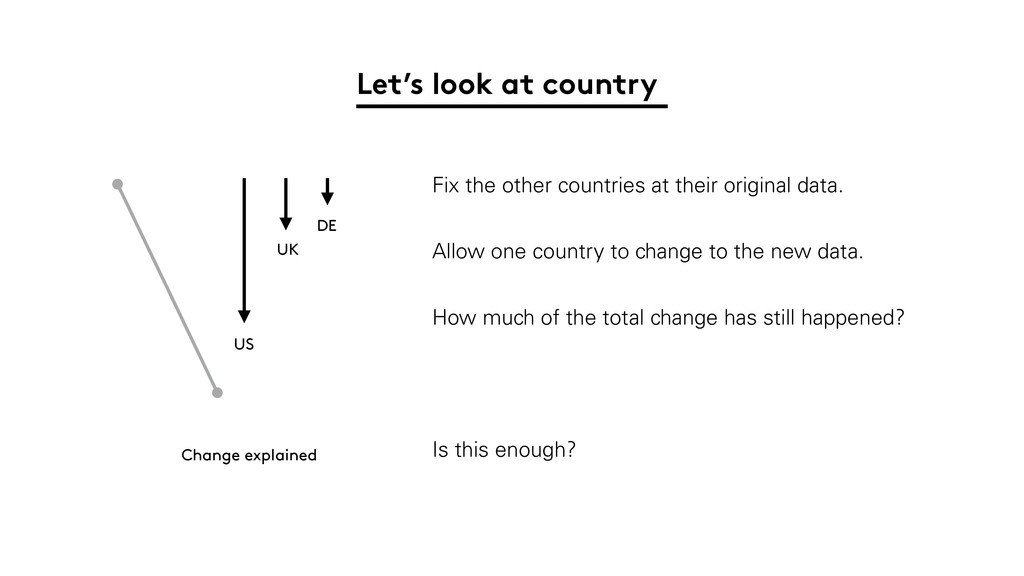
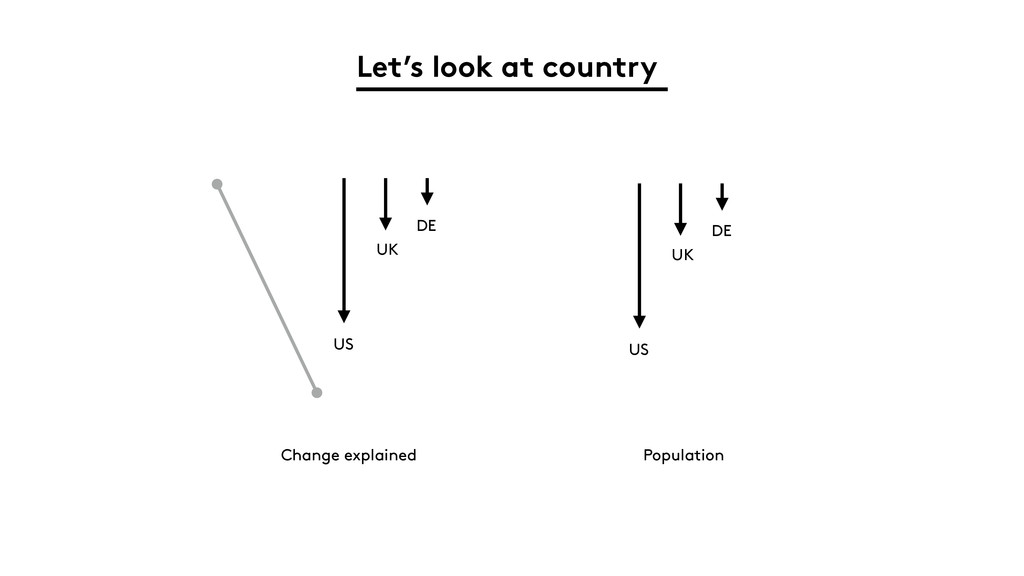
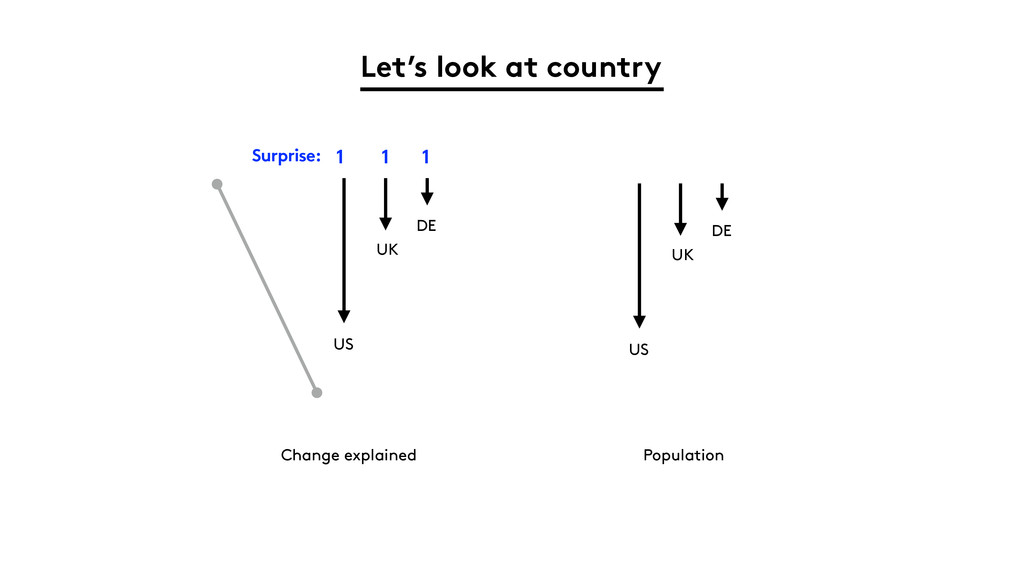
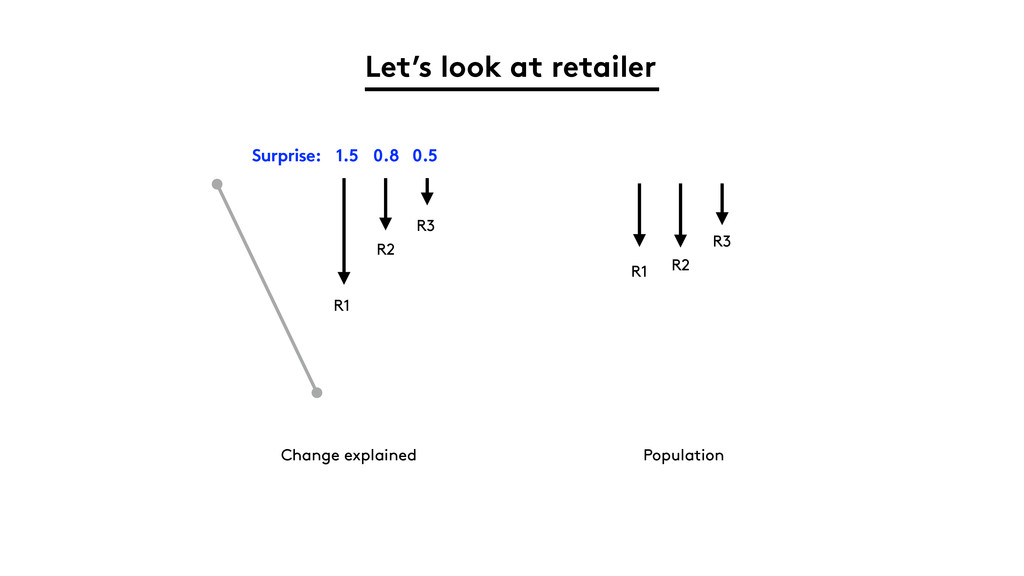
the other countries at their original data. Allow one country to change to the new data. How much of the total change has still happened? Is this enough?
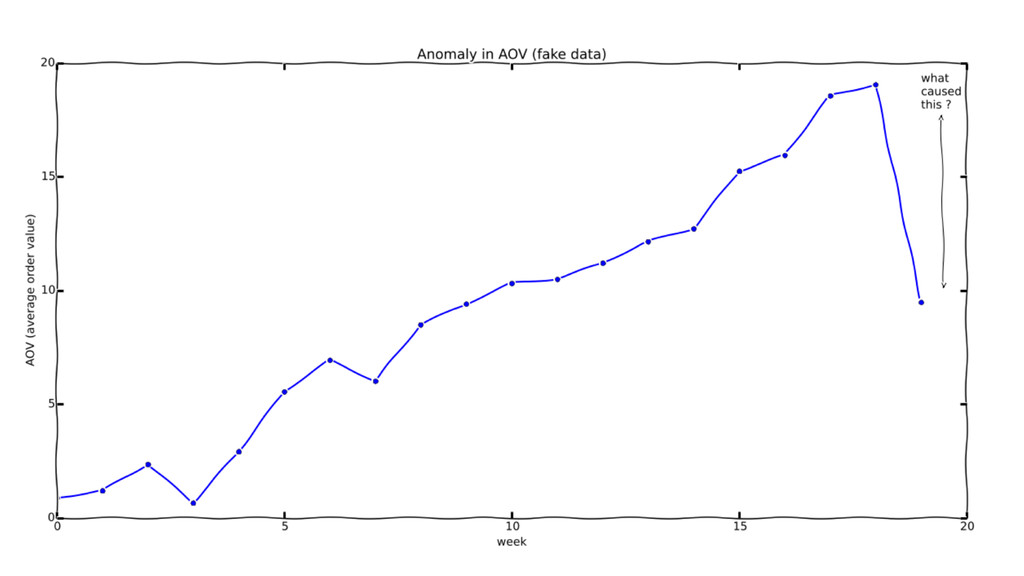
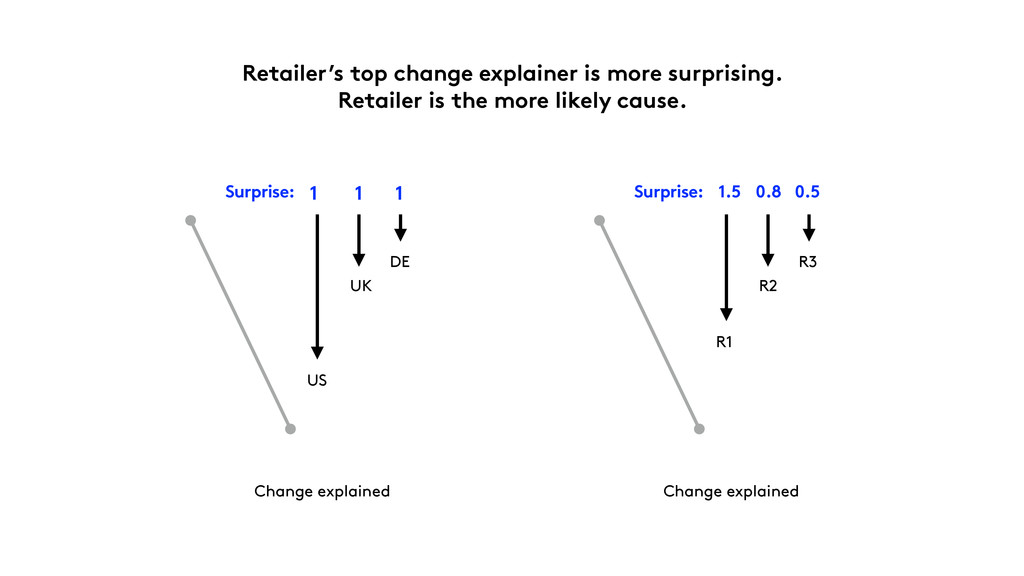
drop in AOV, and the cause is likely retailer-driven (by R1). Useful stats are handed over (all calculated as described earlier). The business analyst can begin a useful investigation. The outcome