Upgrade to Pro — share decks privately, control downloads, hide ads and more …

Front-to-Back: Architecting your data reporting...

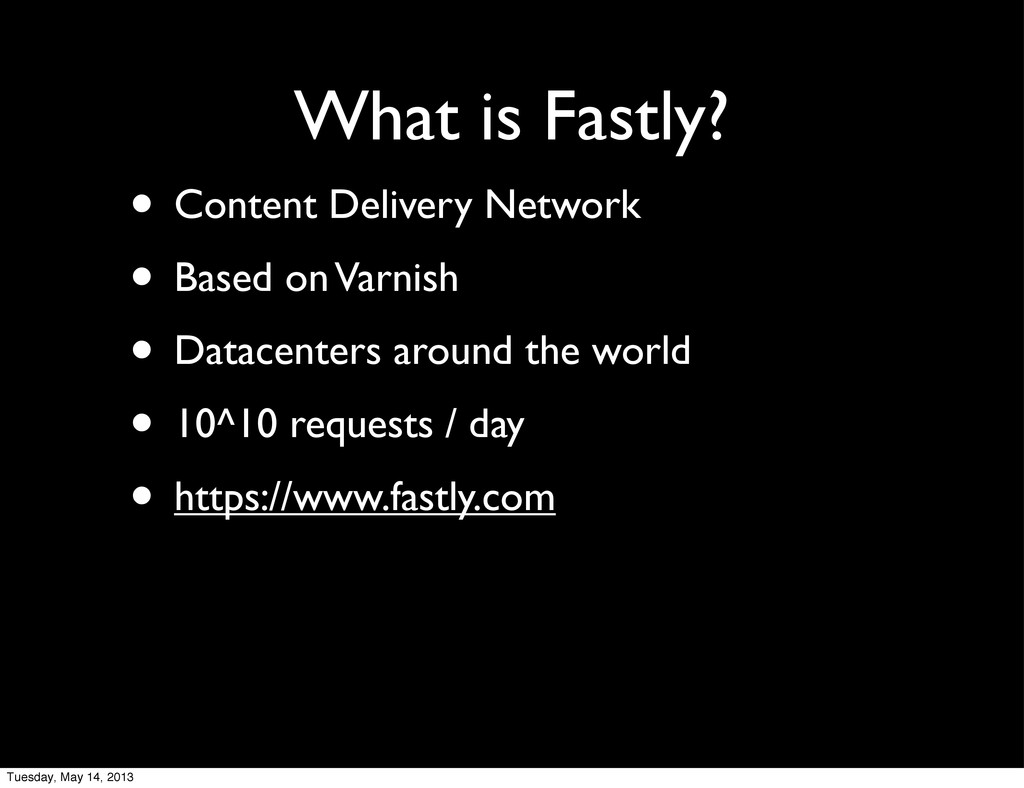
Front-to-Back: Architecting your data reporting and visualization stack

A Fastly.com warstory that details the trials, tribulations, and lessons learned from building a custom stats and reporting system. Talk given at SctolandJS 2013 (http://scotlandjs.com/).

Ryan Sandor Richards

May 09, 2013
Tweet

More Decks by Ryan Sandor Richards

Other Decks in Programming

Transcript

  1. • Content Delivery Network • Based on Varnish • Datacenters

    around the world • 10^10 requests / day • https://www.fastly.com What is Fastly? Tuesday, May 14, 2013
  2. Stats Architecture Backend Middle-end Front-end Collection & Storage Querying &

    Publishing Visualization & Reporting Tuesday, May 14, 2013
  3. • You can’t • Queuing and waiting before publishing (eventual

    convergence) • Backfill in the Visualizations Fixing Latency Tuesday, May 14, 2013
  4. Fixing ØMQ and Leaks • Caused by bindings and node

    • Replaced ØMQ with HTTP • Rewritten in Perl (GASP!) Tuesday, May 14, 2013
  5. Fixing Socket.IO • Quit Using It • Used a third-party

    expert: PubNub Tuesday, May 14, 2013
  6. d3 is sweet, but... • Didn’t work well for real-time

    vis (this is before cubism, etc.) • I had very little experience with it • Ended up using HTML5 Canvas Tuesday, May 14, 2013
  7. •USE WHAT YOU KNOW... • Perl vs. Node • HTTP

    vs. ØMQ • Canvas vs. d3 •IF YOU DON’T KNOW... • PubNub over Socket.IO Lessons Tuesday, May 14, 2013
  8. We Knew Nothing • What did our users need? •

    What did we need internally? • Should we have an API? • How fast is our data growing? • What’s visualizations are needed? Tuesday, May 14, 2013
  9. But we had a plan... • A month of investigative

    interviews (Internal & Customers) • Design an architecture up front • Peer review and sanity checking • Implement by Q2 2013 Tuesday, May 14, 2013
  10. The Interviews • 1-on-1 interviews with everyone in the company

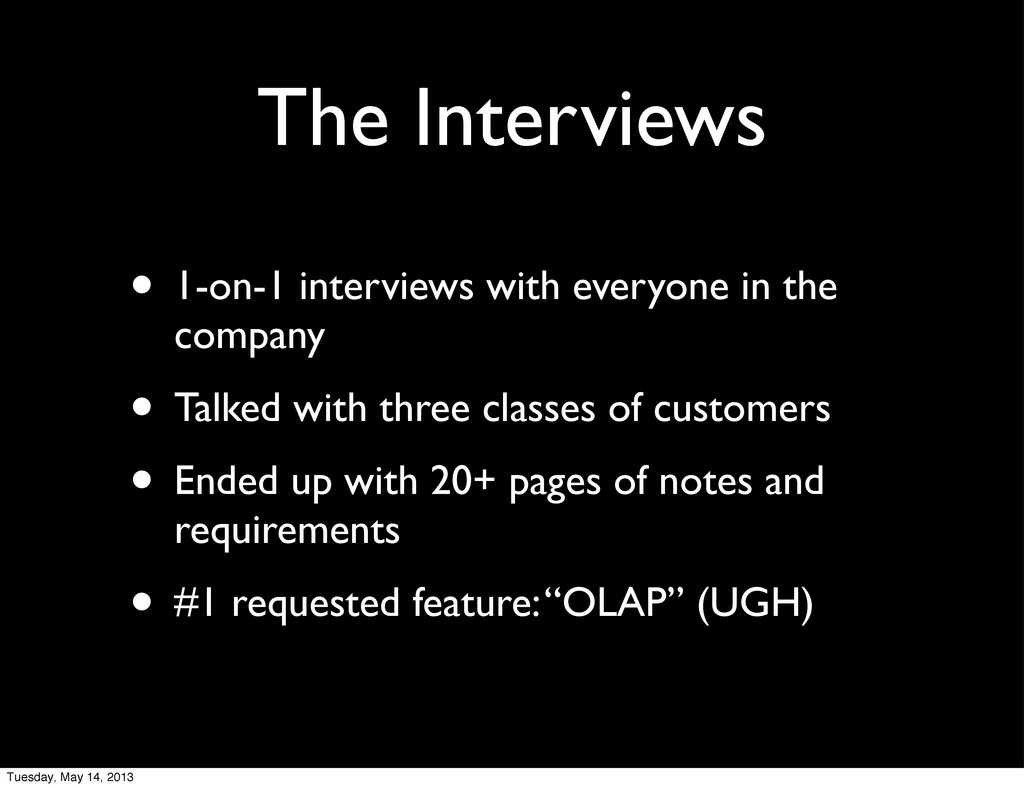
    • Talked with three classes of customers • Ended up with 20+ pages of notes and requirements • #1 requested feature: “OLAP” (UGH) Tuesday, May 14, 2013
  11. API • Built using Sinatra • Indepedent from the core

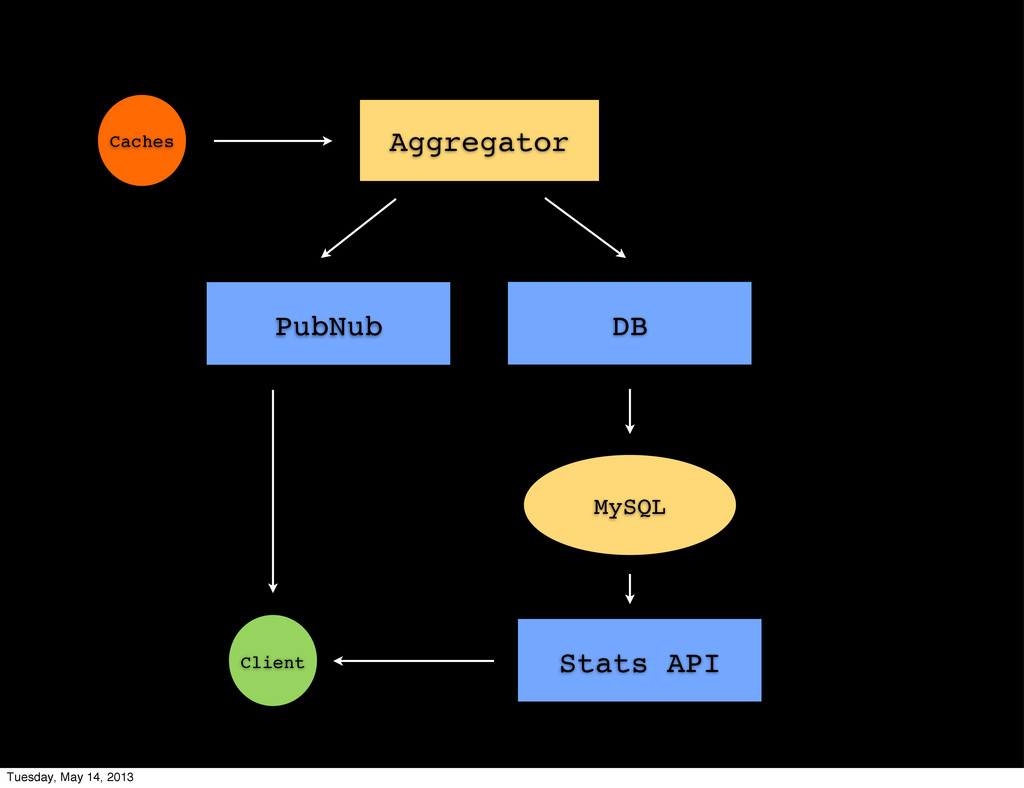
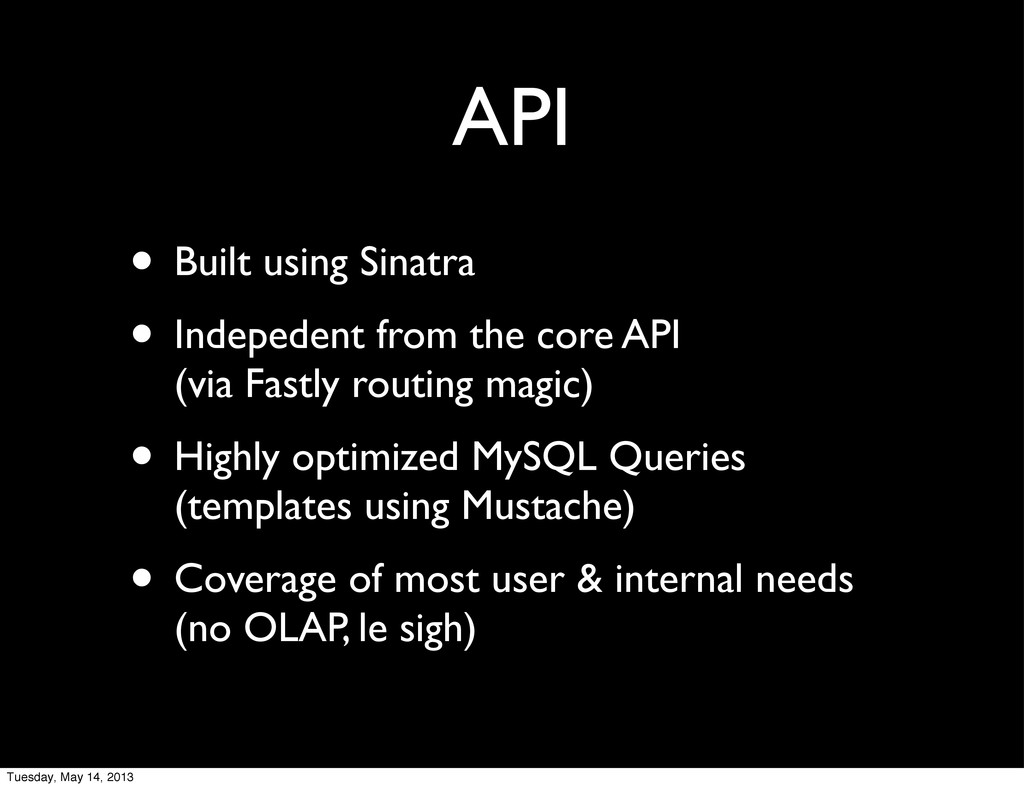
    API (via Fastly routing magic) • Highly optimized MySQL Queries (templates using Mustache) • Coverage of most user & internal needs (no OLAP, le sigh) Tuesday, May 14, 2013
  12. API • Easy to use time parameters from=2 weeks ago&

    to=now& by=hour via Chronic (github.com/mojombo/chronic) • Good amount of query types: By Time, Aggregate, Percentile, Usage, etc. Tuesday, May 14, 2013
  13. The Interface • Uses d3 • It’s neat-o but not

    perfect • Displays the information users need the most Tuesday, May 14, 2013
  14. The Future • “Done” is a myth • Data evolves,

    so does visualization and reporting • Working on “By Second” historical stats (Using Amazon RedShift) • And a better interface... Tuesday, May 14, 2013