the tools that accomplish this. These tools includes tracing tools, sampling tools, and tools based on fixed counters. It does not include benchmark tools, which modify the state of the system by performing a workload experiment” Excerpt From: Brendan Gregg. “BPF Performance Tools: Linux System and Application Observability.” Definition
our systems. What characteristics did the queries that timed out at 500ms share in common? Service versions? • Instrumentation produces data. • Querying data answers our questions.
Instrumentation code is how we get telemetry. • Telemetry data can include traces, logs, and/or metrics. All different views into the same underlying truth.
summary statistics. • Logs ◦ Detailed debugging information emitted by processes. • Distributed Tracing ◦ Provides insights into the full lifecycles, aka traces of requests to a system, allowing you to pinpoint failures and performance issues. Structured data can be transmuted into any of these!
value (e.g. CPU utilization) • Cumulative counters ◦ Cumulative sums of data since process start (e.g. request counts) • Cumulative histogram ◦ Grouped counters for a range of buckets (e.g. 0-10ms, 11-20ms) • Rates ◦ The derivative of a counter, typically. (e.g. requests per second) • Aggregation by tags ◦ Data can be joined along shared tags (e.g. hostname, cluster name).
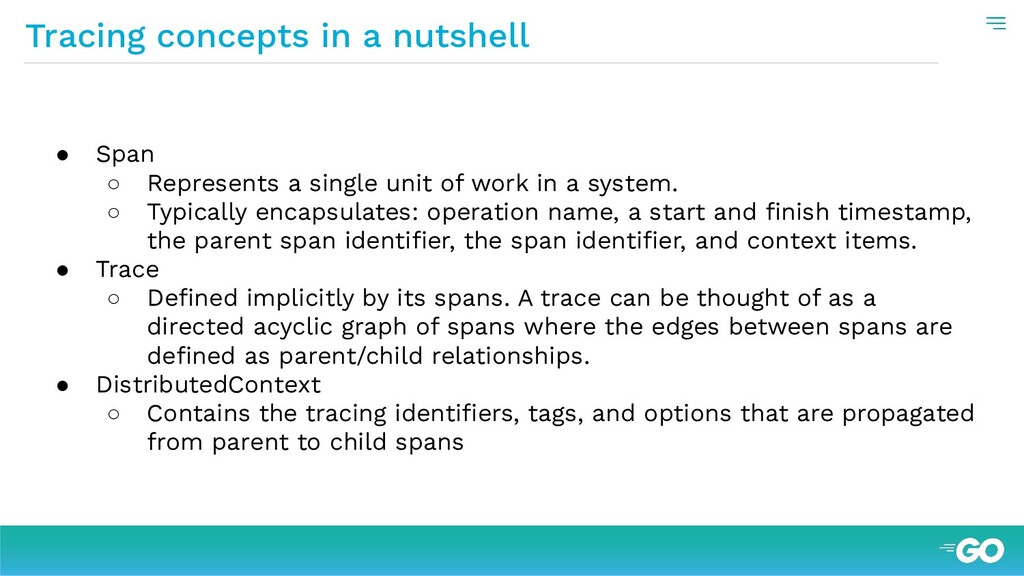
single unit of work in a system. ◦ Typically encapsulates: operation name, a start and finish timestamp, the parent span identifier, the span identifier, and context items. • Trace ◦ Defined implicitly by its spans. A trace can be thought of as a directed acyclic graph of spans where the edges between spans are defined as parent/child relationships. • DistributedContext ◦ Contains the tracing identifiers, tags, and options that are propagated from parent to child spans
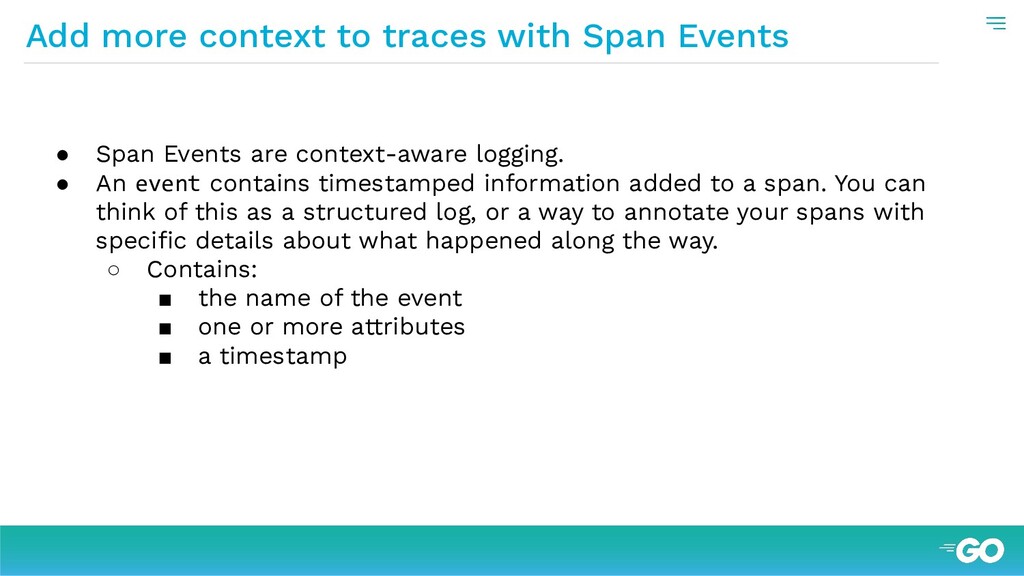
Events are context-aware logging. • An event contains timestamped information added to a span. You can think of this as a structured log, or a way to annotate your spans with specific details about what happened along the way. ◦ Contains: ▪ the name of the event ▪ one or more attributes ▪ a timestamp
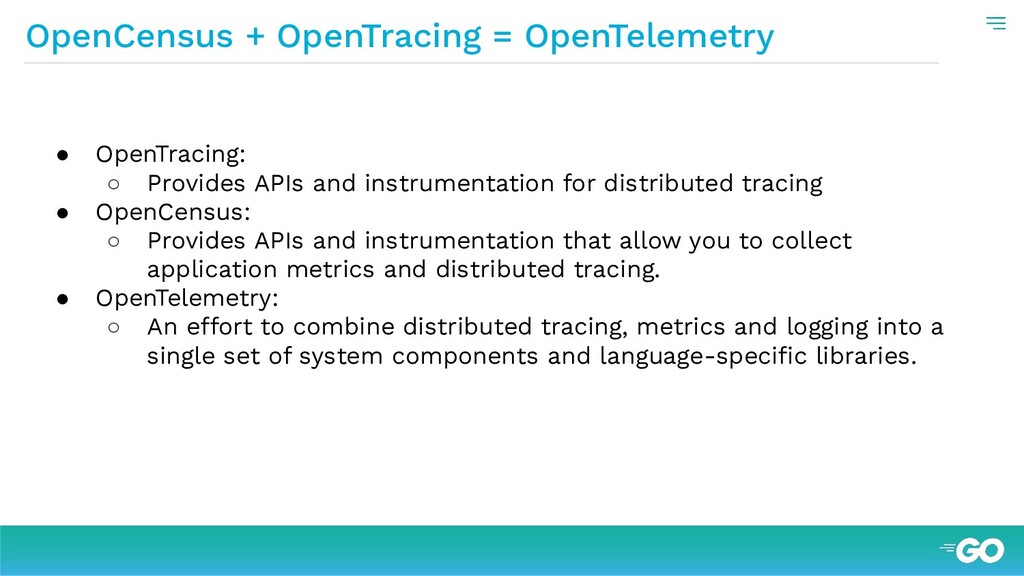
and instrumentation for distributed tracing • OpenCensus: ◦ Provides APIs and instrumentation that allow you to collect application metrics and distributed tracing. • OpenTelemetry: ◦ An effort to combine distributed tracing, metrics and logging into a single set of system components and language-specific libraries.
What you will do: • Translating business requirements into scalable technical solutions; • Producing high-quality maintainable code, testing and collaboratively review it to ensure efficiency; • Pairing with team members on functional and nonfunctional requirements and spread design philosophy, goals and improve the code quality across the team; • Participating in preparing systems requirements, specifications and design; • Ensuring maintainability of core app assets and artifacts; • Researching new tools, learn and experiment with new languages and technologies and growing continuously with us; • Continuously refactoring applications and architectures to maintain high quality levels and experience in troubleshooting server performance - memory issues, GC tuning and resource leaks If you are interested, send your CV to [email protected]. Don't forget to include the role name and your name on the subject line. Sampingan @sampingan.business & @sampingan.id Follow us on www.sampingan.co.id