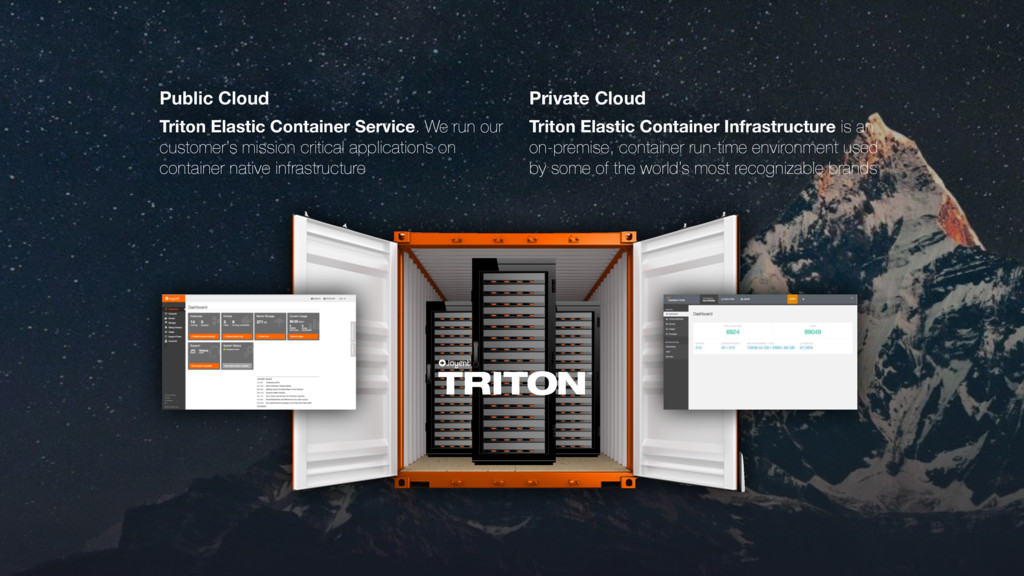
mission critical applications on container native infrastructure Private Cloud Triton Elastic Container Infrastructure is an on-premise, container run-time environment used by some of the world’s most recognizable brands
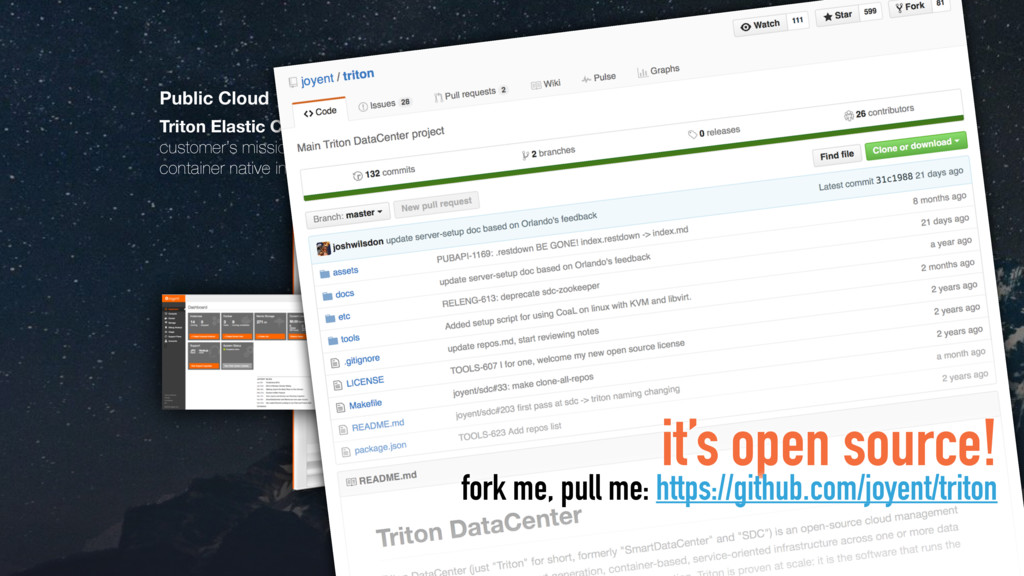
mission critical applications on container native infrastructure Private Cloud Triton Elastic Container Infrastructure is an on-premise, container run-time environment used by some of the world’s most recognizable brands it’s open source! fork me, pull me: https://github.com/joyent/triton
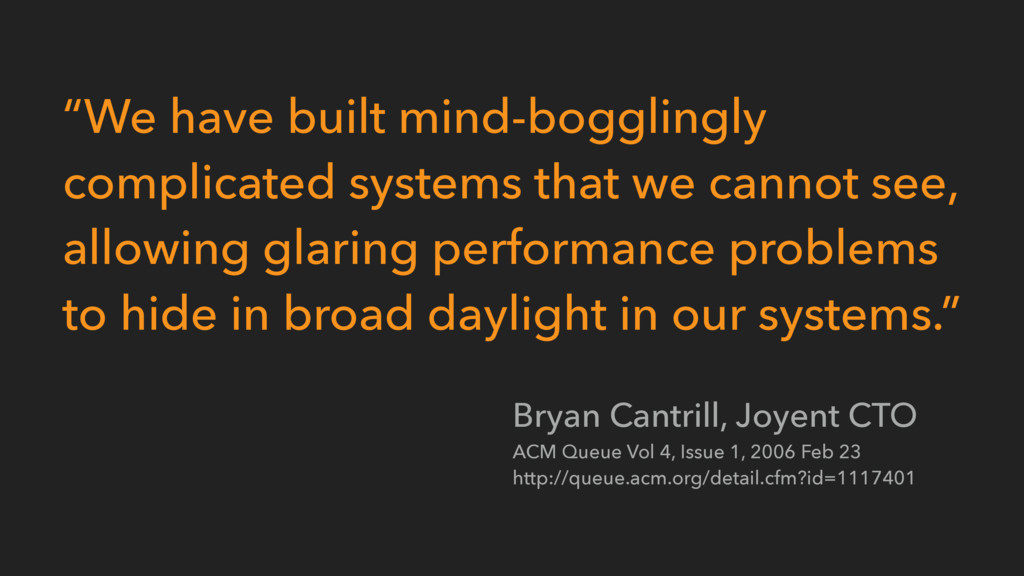
of abstraction, but they are often first encountered and attributed at the lowest layers of abstraction.” Bryan Cantrill, Joyent CTO ACM Queue Vol 4, Issue 1, 2006 Feb 23 http://queue.acm.org/detail.cfm?id=1117401
or Linux (LX) infrastructure containers, or Docker application containers, running as Solaris Zones ▸ Proven battle-tested multi-tenant security ▸ Bare-metal performance ▸ Isolation provides observability w/o interference
▸ API is awkward for high-dimensionality ▸ Want to improve scalability w/ aggregation ▸ Want better availability ▸ No path for end users to application-level metrics
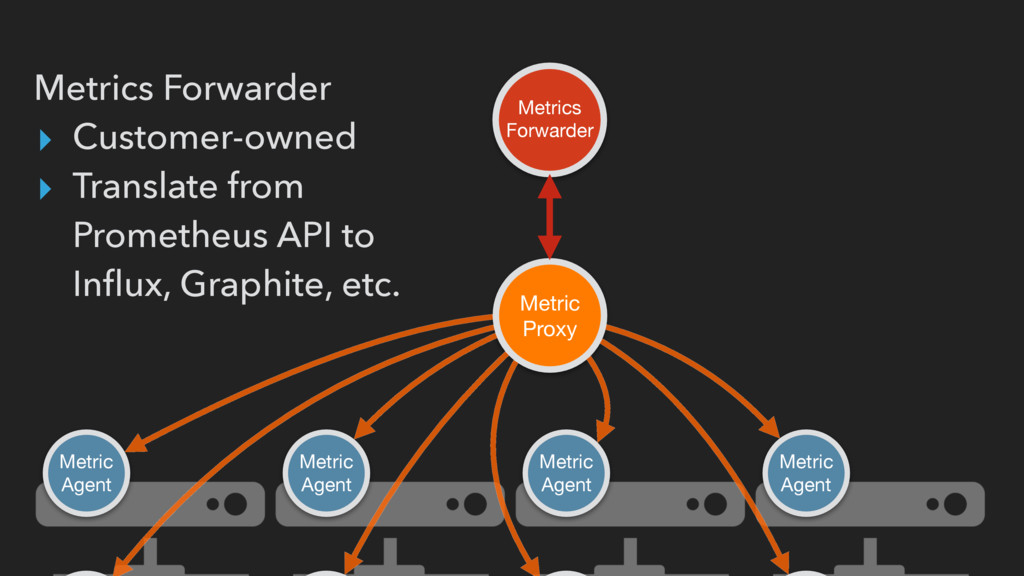
API for customers (end- users, developers, etc.) to deploy their containers. ▸ One customer can’t cause brown-outs for other customers! ▸ Give customers a sane migration path or let them use their existing monitoring
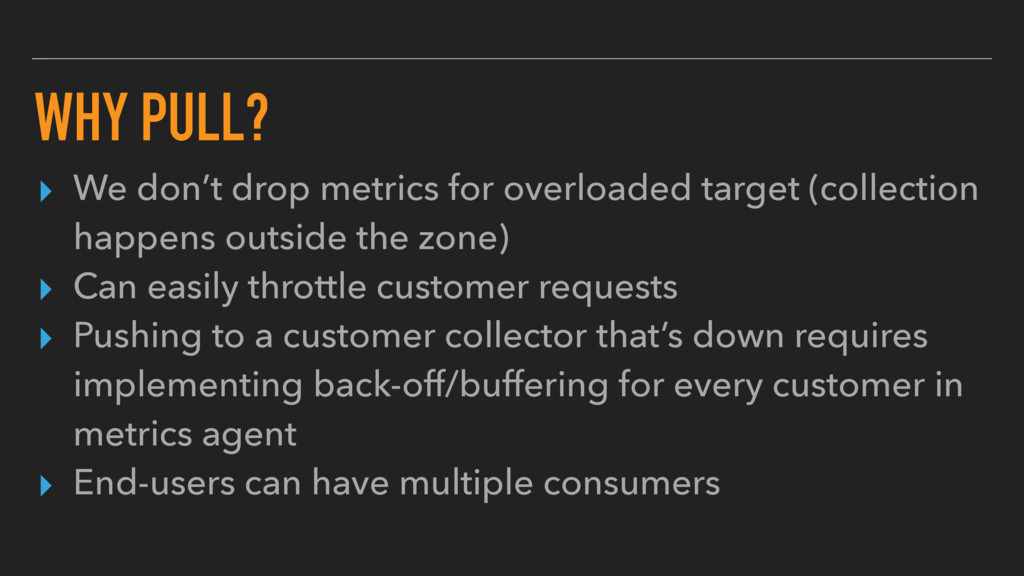
(collection happens outside the zone) ▸ Can easily throttle customer requests ▸ Pushing to a customer collector that’s down requires implementing back-off/buffering for every customer in metrics agent ▸ End-users can have multiple consumers
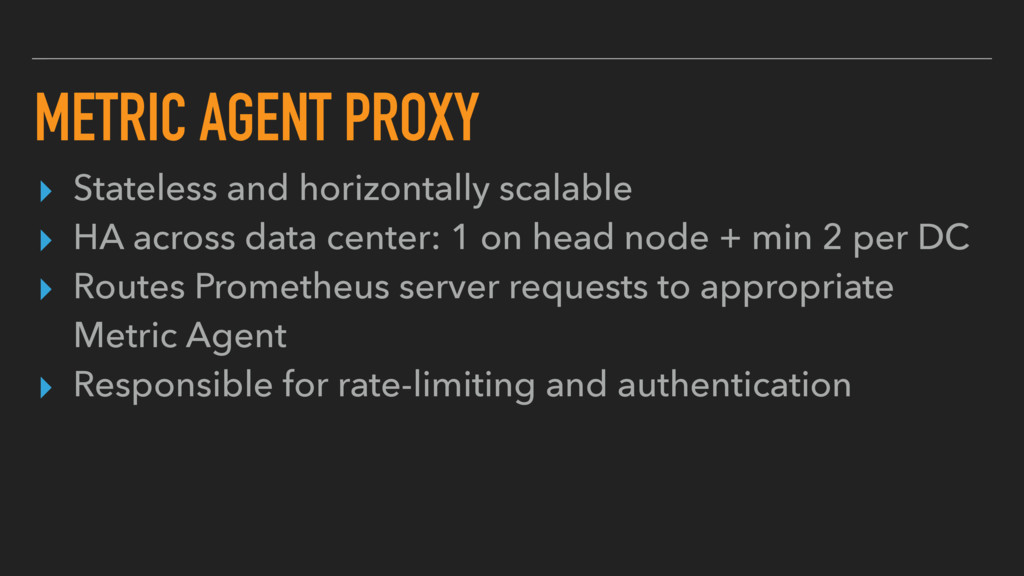
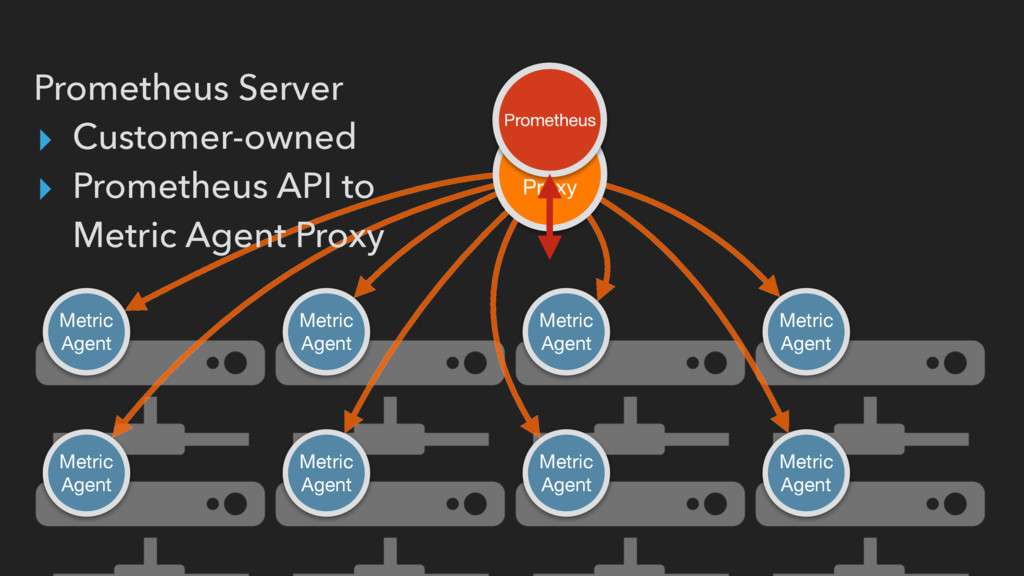
across data center: 1 on head node + min 2 per DC ▸ Routes Prometheus server requests to appropriate Metric Agent ▸ Responsible for rate-limiting and authentication
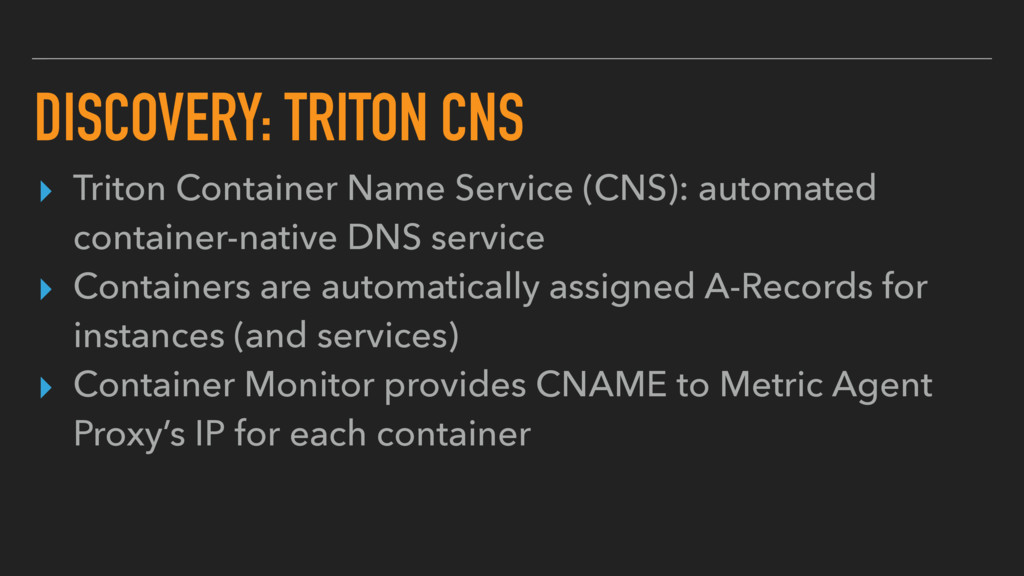
container-native DNS service ▸ Containers are automatically assigned A-Records for instances (and services) ▸ Container Monitor provides CNAME to Metric Agent Proxy’s IP for each container
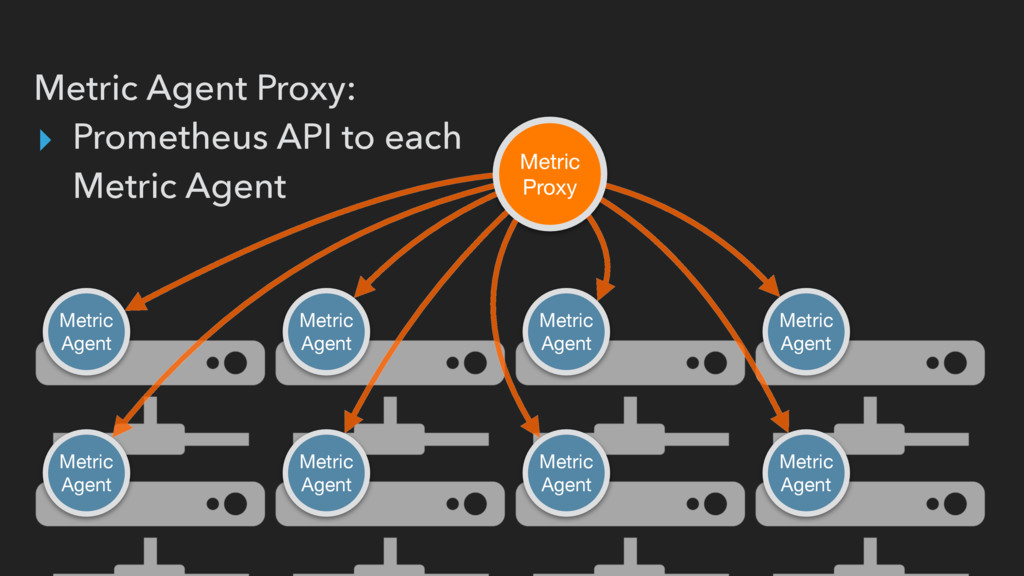
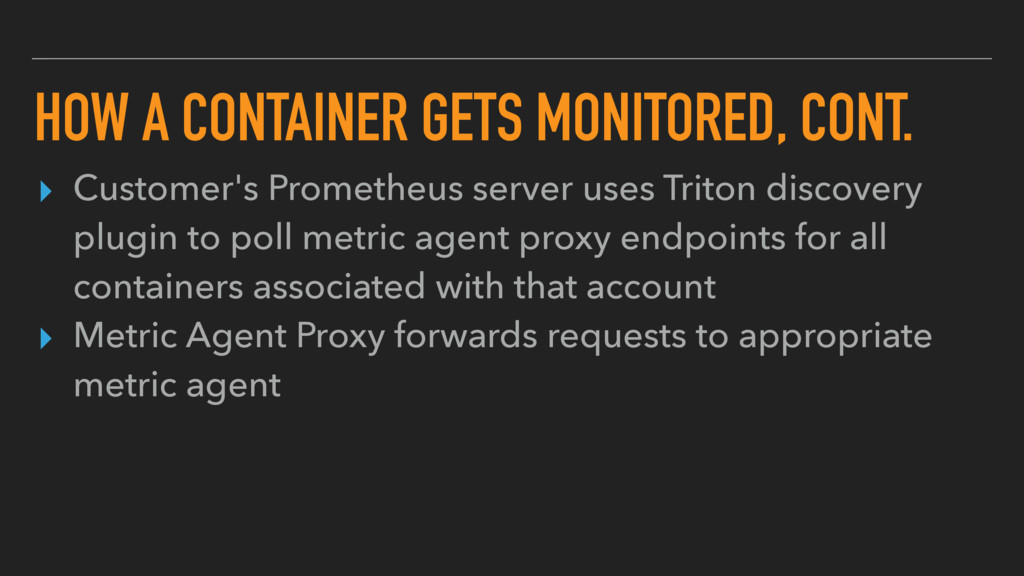
uses Triton discovery plugin to poll metric agent proxy endpoints for all containers associated with that account ▸ Metric Agent Proxy forwards requests to appropriate metric agent