Upgrade to Pro — share decks privately, control downloads, hide ads and more …

Visualizing Your Data: Incorporating Mongo into Loggly Infrastructure

mongodb
June 29, 2011

Visualizing Your Data: Incorporating Mongo into Loggly Infrastructure

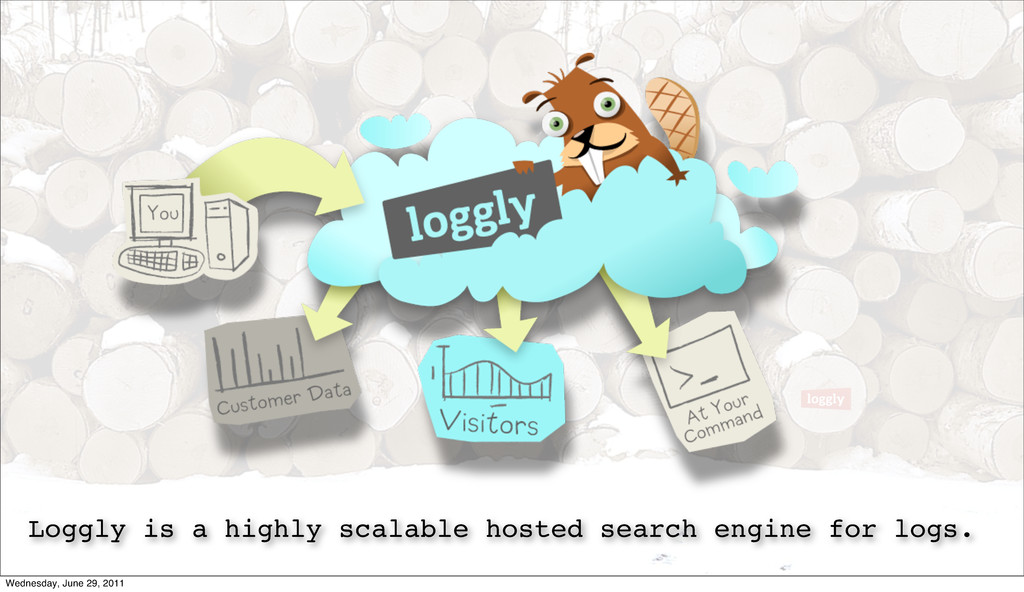
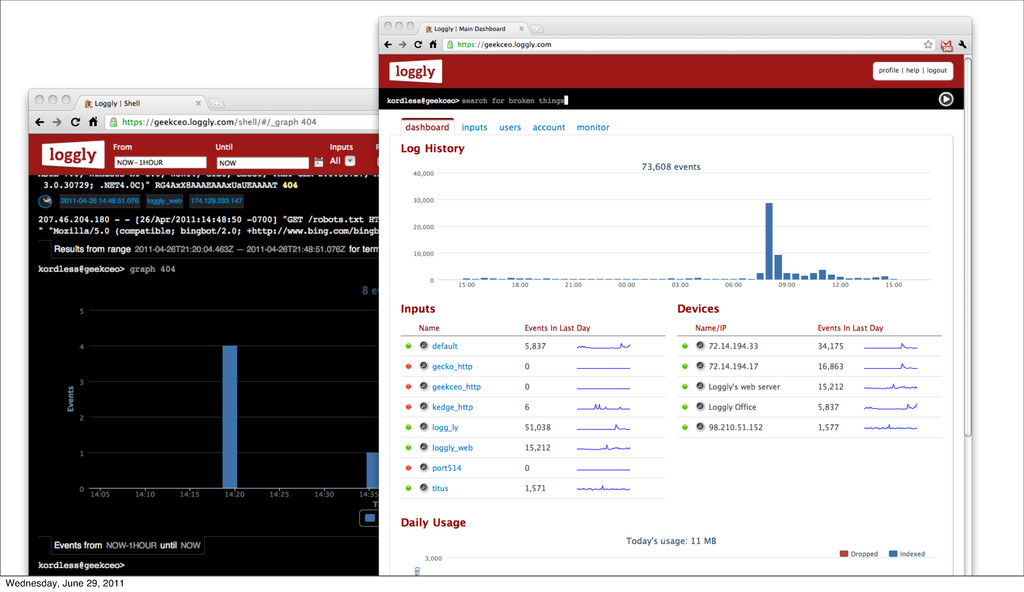
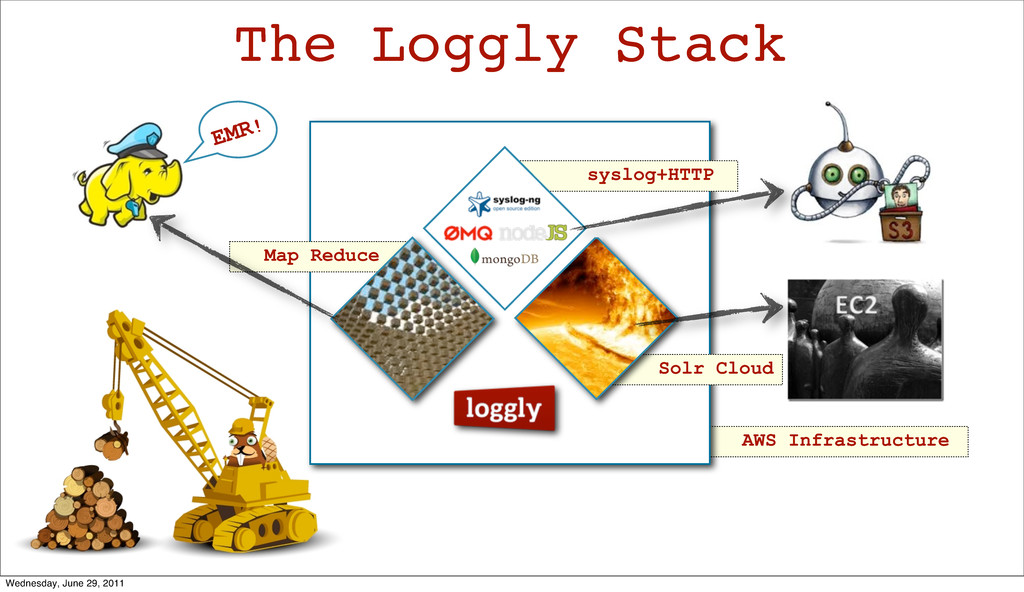
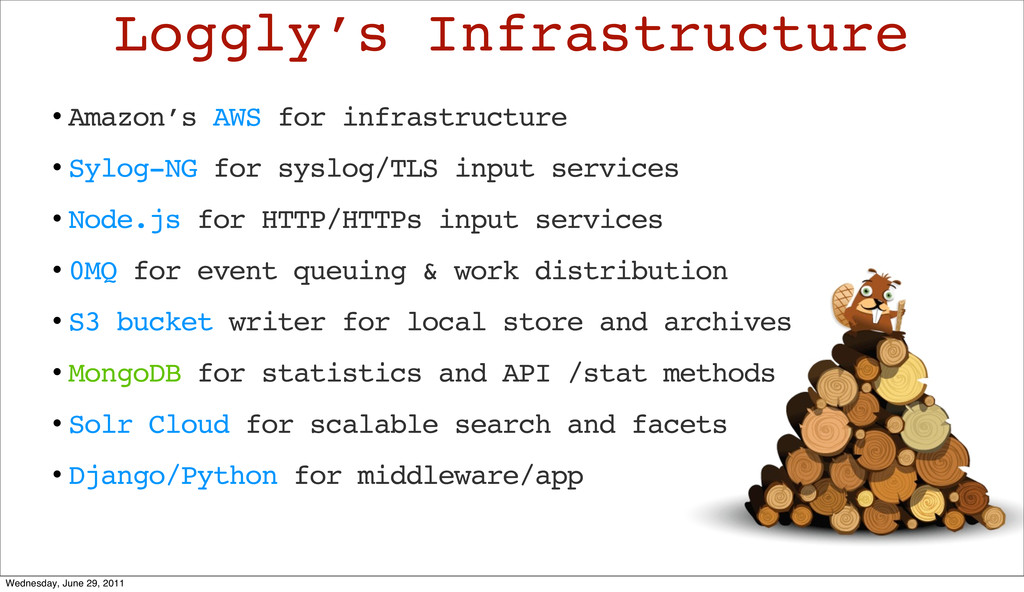
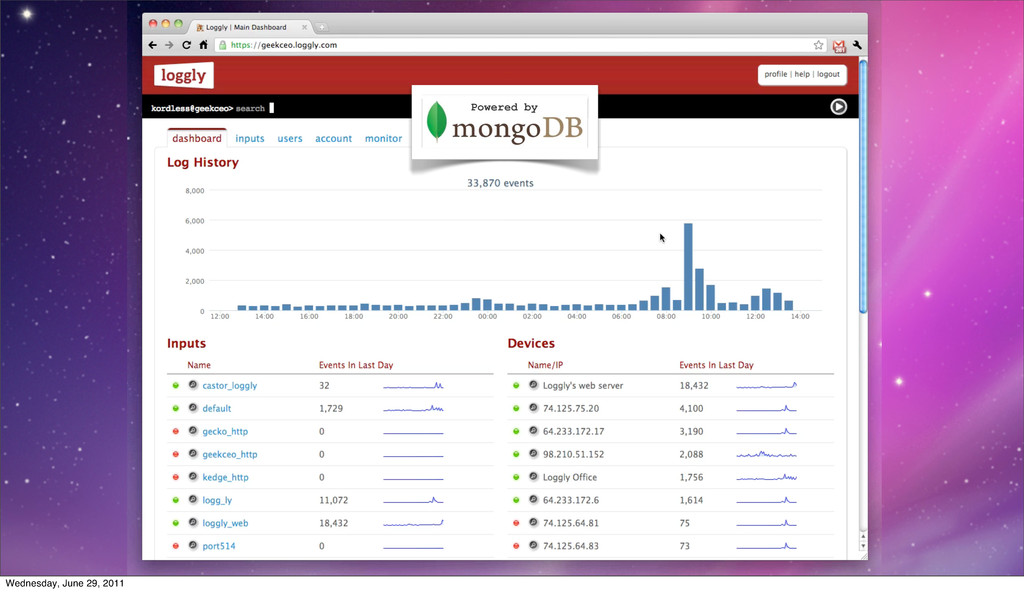
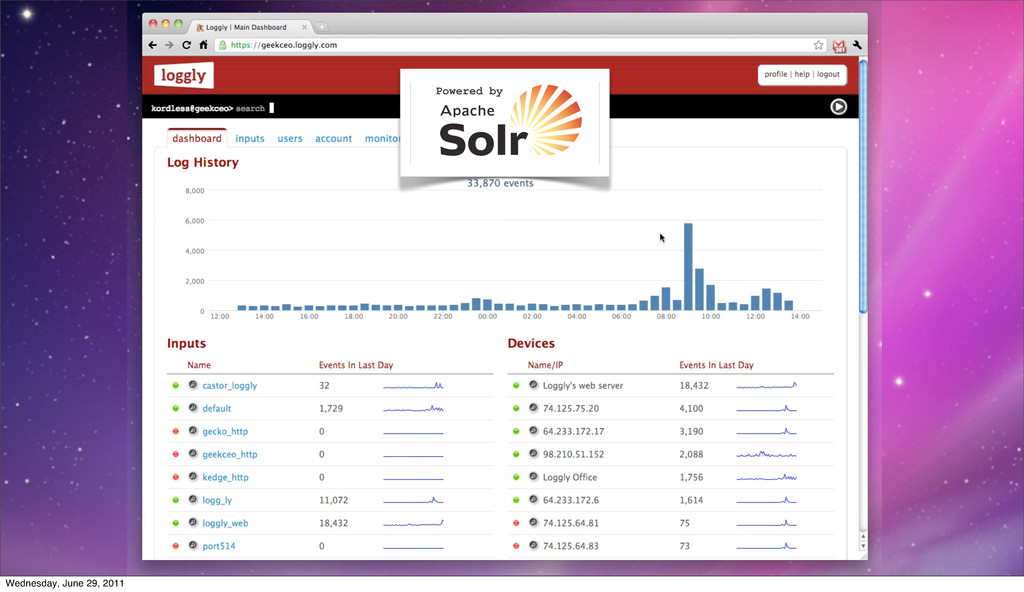
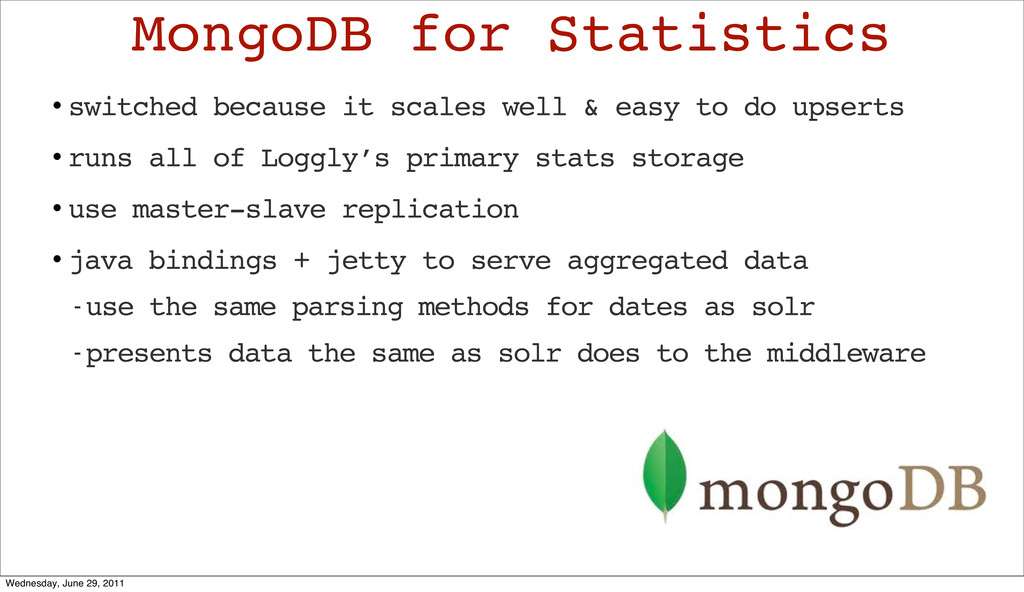
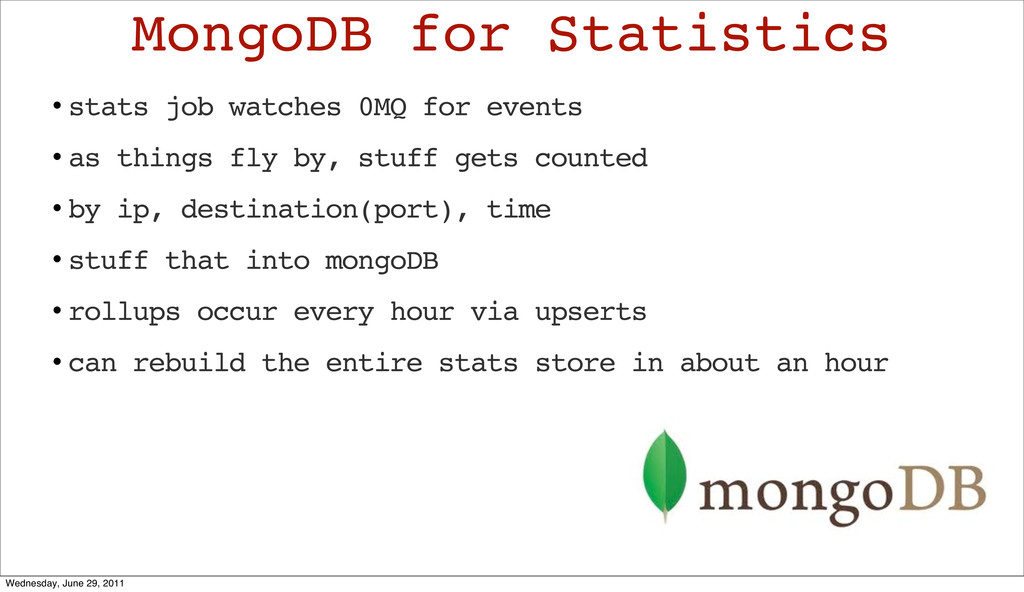
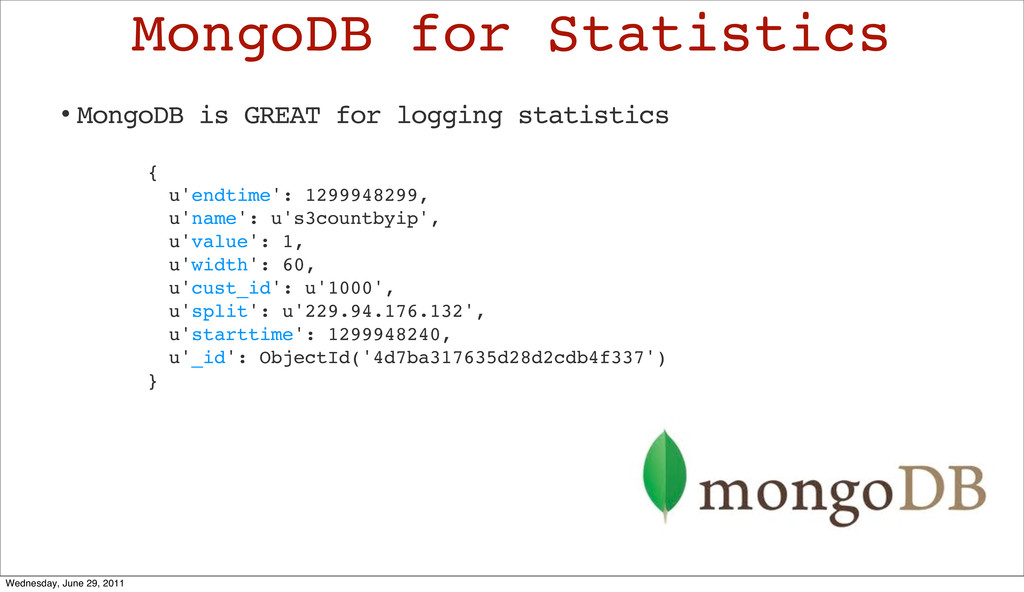
At Loggly we use MongoDB as a repository of statistics. We collect data on both the size and count of incoming events by originating ip and destination. These statistics on incoming events are used to drive the dashboards on the front page of every Loggly customer sub-domain that break down the last 24hrs of data flow by input and ip. This allows customers to get usage and flow information at a glance the minute they login without having to run solr searches across our indexes. We'll talk about how we tied Mongo into our infrastructure, and how we expose the data to the end users via our REST APIs.

mongodb

June 29, 2011
Tweet

More Decks by mongodb

Other Decks in Technology

Transcript

  1. • Amazon’s AWS for infrastructure • Sylog-NG for syslog/TLS input

    services • Node.js for HTTP/HTTPs input services • 0MQ for event queuing & work distribution • S3 bucket writer for local store and archives • MongoDB for statistics and API /stat methods • Solr Cloud for scalable search and facets • Django/Python for middleware/app Loggly’s Infrastructure Wednesday, June 29, 2011
  2. • switched because it scales well & easy to do

    upserts • runs all of Loggly’s primary stats storage • use master-slave replication • java bindings + jetty to serve aggregated data - use the same parsing methods for dates as solr - presents data the same as solr does to the middleware MongoDB for Statistics Wednesday, June 29, 2011
  3. • stats job watches 0MQ for events • as things

    fly by, stuff gets counted • by ip, destination(port), time • stuff that into mongoDB • rollups occur every hour via upserts • can rebuild the entire stats store in about an hour MongoDB for Statistics Wednesday, June 29, 2011
  4. MongoDB for Statistics { u'endtime': 1299948299, u'name': u's3countbyip', u'value': 1,

    u'width': 60, u'cust_id': u'1000', u'split': u'229.94.176.132', u'starttime': 1299948240, u'_id': ObjectId('4d7ba317635d28d2cdb4f337') } • MongoDB is GREAT for logging statistics Wednesday, June 29, 2011
  5. • MongoDB is PERFECT for logging stuff if it’s semi-structured

    More Logging w/ MongoDB { "version": "1.0", "host": "webhead2", "short_message": "Short message", "full_message": "Backtrace here\n\nmore stuff", "timestamp": 1291899928, "level": 1, "facility": "payment-backend", "file": "/var/www/somefile.rb", "line": 356, "_user_id": 42, "_something_else": "foo" } Wednesday, June 29, 2011
  6. • Voxify’s Robert Stewart @ http://logg.ly/tpM • Wrote log4mongo-java parked

    on Github More Logging w/ MongoDB Wednesday, June 29, 2011
  7. • logstash by Jordan Sissel (Loggly’s devops extraordinaire) • http://logstash.net/

    • uses MongoDB for output channel More Logging w/ MongoDB Wednesday, June 29, 2011
  8. • graylog2 by Lennart Koopmann (@_lennart) • http://graylog2.org/ • uses

    MongoDB for storage and search (with ElasticSearch) More Logging w/ MongoDB Wednesday, June 29, 2011
  9. • Highcharts @ http://highcharts.com/ • Protoviz @ http://vis.stanford.edu/protovis/ • Smoothie

    Charts @ http://smoothiecharts.org/ • Google Earth plugin @ http://code.google.com/apis/earth/ • Google Charts @ http://code.google.com/apis/chart/ Visualization Stuff Wednesday, June 29, 2011
  10. Free Stuff • Free accounts at http://loggly.com/signup • Free stickers

    • Free shirts • Free lunch • Free advice Wednesday, June 29, 2011
  11. If you like beavers, you should work here! 18 Follow

    me @loggly on Twitter! http://logg.ly/jobs Wednesday, June 29, 2011