To call human to prevent a business level issue • Be able to debug issues • Trends to see changes over time and drive technical and business decision. • To feed into other systems(Ex Automation, Security) • Alerting • Building dashboard
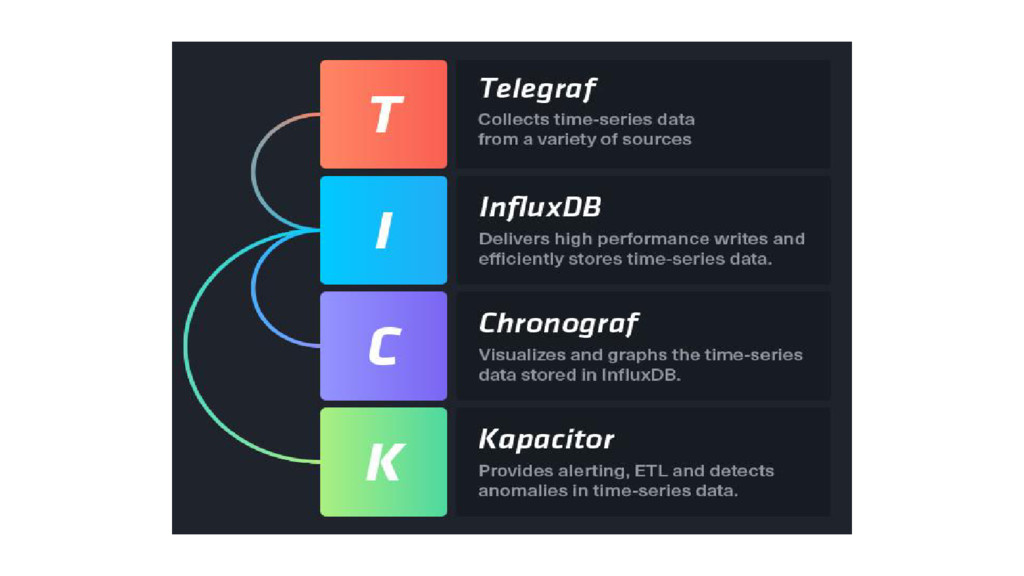
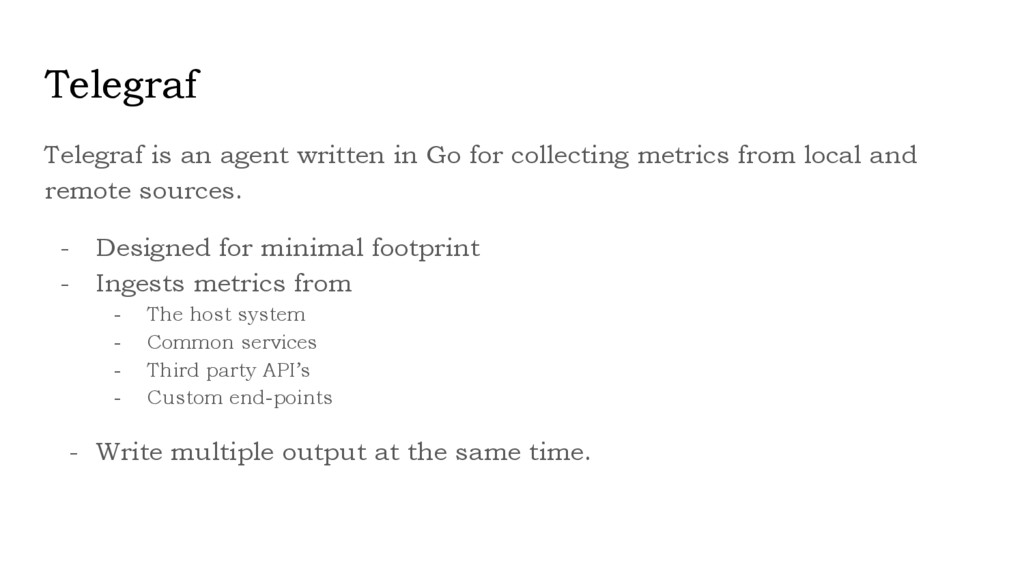
metrics from local and remote sources. - Designed for minimal footprint - Ingests metrics from - The host system - Common services - Third party API’s - Custom end-points - Write multiple output at the same time.
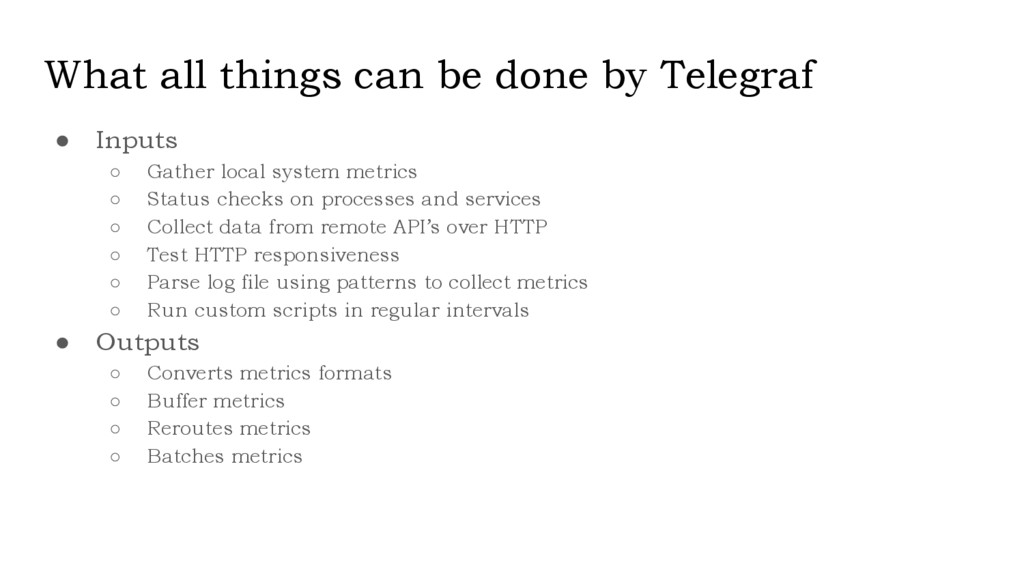
◦ Gather local system metrics ◦ Status checks on processes and services ◦ Collect data from remote API’s over HTTP ◦ Test HTTP responsiveness ◦ Parse log file using patterns to collect metrics ◦ Run custom scripts in regular intervals • Outputs ◦ Converts metrics formats ◦ Buffer metrics ◦ Reroutes metrics ◦ Batches metrics
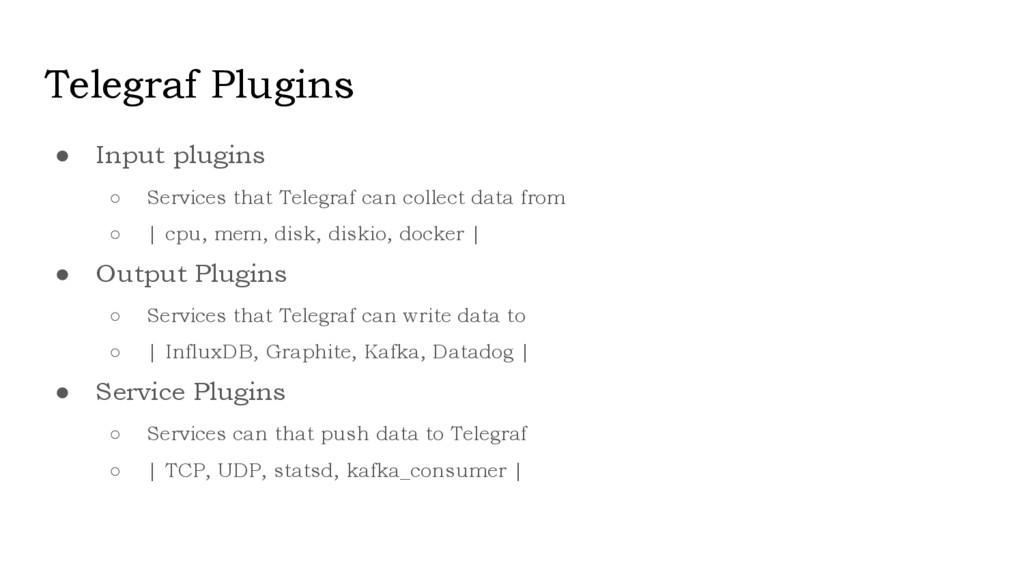
collect data from ◦ | cpu, mem, disk, diskio, docker | • Output Plugins ◦ Services that Telegraf can write data to ◦ | InfluxDB, Graphite, Kafka, Datadog | • Service Plugins ◦ Services can that push data to Telegraf ◦ | TCP, UDP, statsd, kafka_consumer |